静止衛星「ひまわり5号(GMS-5)」の位置を表示(北緯90度のみ)
satellite.py
# !/usr/bin/python3
# coding: UTF-8

from mpl_toolkits.basemap import Basemap
import numpy as np
import matplotlib.pyplot as plt
import sys

def get_input(prompt):
    if sys.hexversion > 0x03000000:
        return input(prompt)
    else:
        return raw_input(prompt)

lon_0 = float(get_input('東経 (度):'))
# lat_0 = float(get_input('北緯[静止衛星の場合は90] (度):'))
lat_0 = 90.0

font = {'family':'IPAGothic'}

m = Basemap(projection='ortho',lon_0=lon_0,lat_0 = lat_0,resolution='l')
m.drawcoastlines()
m.fillcontinents(color='coral',lake_color='aqua')
m.drawmapboundary(fill_color='aqua')
m.drawcountries()

m.drawmeridians(np.arange(0, 360, 10))
m.drawparallels(np.arange(-90, 90, 10))

Height = 36000000 # (m) 静止衛星の高度
center = 6378100 # (m) 地球中心座標
r = center + Height
x = np.linspace(-r, r, 10000, endpoint=True)
y = np.sqrt(r ** 2 - x ** 2)

plt.plot(x + center, y + center, 'gray', linewidth=1)  #衛星軌道
plt.plot(x + center, -y + center, 'gray', linewidth=1)

lon_satellite = 140  #(度) ひまわり5号(GMS-5)
lon_s = center + np.sin((lon_satellite-lon_0)*np.pi/180)*r
lat_s = center - np.cos((lon_satellite-lon_0)*np.pi/180)*r
plt.text(lon_s,lat_s,'ひまわり5号(GMS-5)',fontsize=9,color='red', **font)

# 衛星の位置
xx=[center,lon_s]
yy=[center,lat_s]
plt.plot(xx,yy,linewidth=1,color='gray')

spece = 10
plt.axis([-spece-Height, spece+center*2+Height, -spece-Height, spece+center*2+Height])  #グラフの範囲

plt.show()
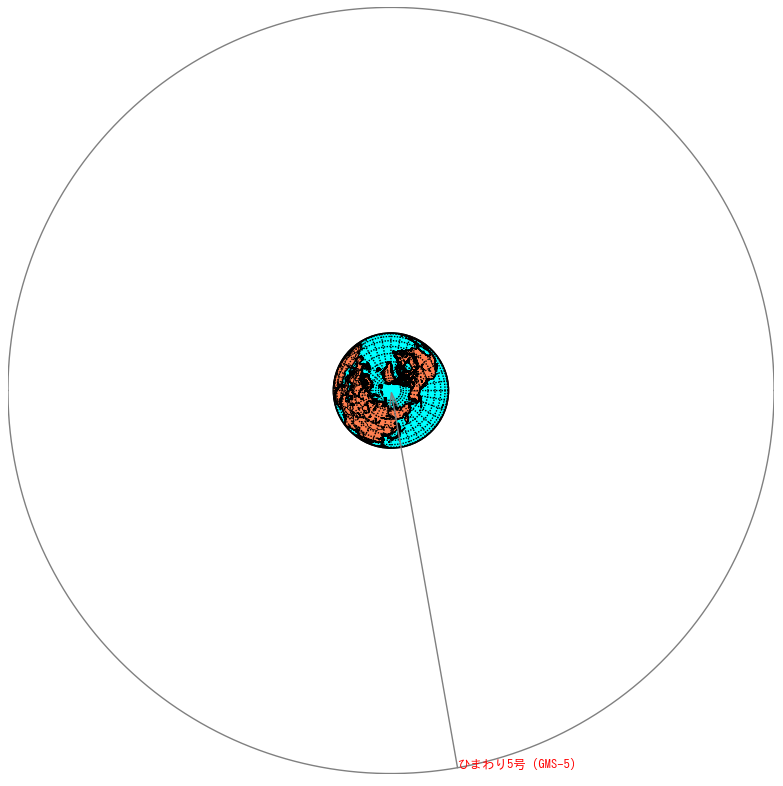
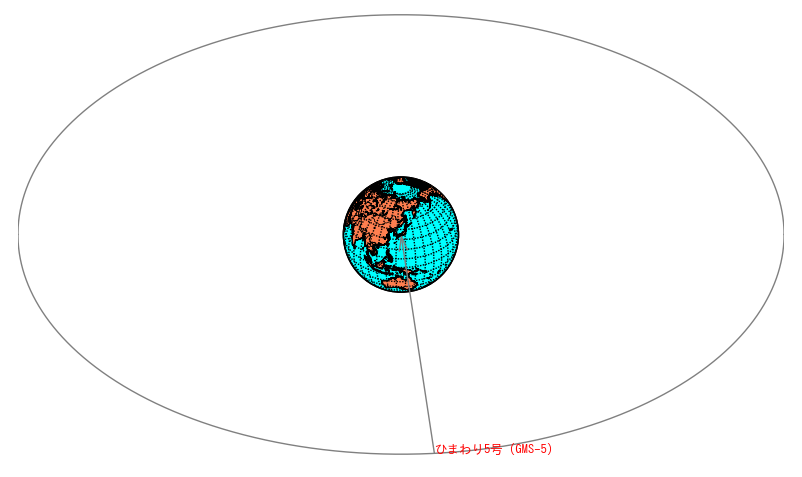
静止衛星「ひまわり5号(GMS-5)」の位置を表示(北緯90度〜0.1度)
注意)東経50度〜230度 以外は地球の裏側になっているようです。
原因がわかりました。楕円の式にx座標を入れてy座標を求めていたが、同じx座標にy座標が+と-で2つあった。(こんなことは常識だろうが、数学にうといので気が付かなかった。)
修正済。
# !/usr/bin/python3
# coding: UTF-8

from mpl_toolkits.basemap import Basemap
import numpy as np
import matplotlib.pyplot as plt
import sys

def get_input(prompt):
    if sys.hexversion > 0x03000000:
        return input(prompt)
    else:
        return raw_input(prompt)

lon_0 = float(get_input('東経 (度):'))
lat_0 = float(get_input('北緯 90 => lat_0 > 0 (度):'))


font = {'family':'IPAGothic'}

m = Basemap(projection='ortho',lon_0=lon_0,lat_0 = lat_0,resolution='l')
m.drawcoastlines()
m.fillcontinents(color='coral',lake_color='aqua')
m.drawmapboundary(fill_color='aqua')
m.drawcountries()

m.drawmeridians(np.arange(0, 360, 10))
m.drawparallels(np.arange(-90, 90, 10))

Height = 36000000 # (m) 静止衛星の高度
center = 6378100 # (m) 地球中心座標
r = center + Height
x = np.linspace(-r, r, 10000, endpoint=True)
if lat_0 == 90:
    y = np.sqrt(r ** 2 - x ** 2)
elif lat_0 <90 and lat_0 > 0:
    y = np.sqrt((r * np.sin(lat_0 * np.pi / 180)) ** 2 * (1 - x ** 2 / r ** 2))
else:
    quit() # 90 = lat_0 > 0 以外は終了

plt.plot(x + center, y + center, 'gray', linewidth=1)  #衛星軌道
plt.plot(x + center, -y + center, 'gray', linewidth=1)

lon_satellite = 140  #(度) ひまわり5号(GMS-5)
lon_s = center + np.sin((lon_satellite-lon_0)*np.pi/180)*r
if lat_0 == 90:
    lat_s = center - np.cos((lon_satellite-lon_0)*np.pi/180)*r
elif (lat_0 < 90) and (lat_0 > 0):
    if (lon_0 < lon_satellite + 90) and (lon_0 > lon_satellite - 90):
        lat_s = center - np.sqrt((r * np.sin(lat_0 * np.pi / 180)) ** 2 * (1 - (np.sin((lon_satellite-lon_0)*np.pi/180)*r) ** 2 / r ** 2))
    elif (lon_0 > lon_satellite + 90) or (lon_0 < lon_satellite - 90):
        lat_s = center + np.sqrt((r * np.sin(lat_0 * np.pi / 180)) ** 2 * (1 - (np.sin((lon_satellite-lon_0)*np.pi/180)*r) ** 2 / r ** 2))
else:
    quit()

plt.text(lon_s,lat_s,'ひまわり5号(GMS-5)',fontsize=9,color='red', **font)
# 衛星の位置
xx=[center,lon_s]
yy=[center,lat_s]
plt.plot(xx,yy,linewidth=1,color='gray')

spece = 10
plt.axis([-spece-Height, spece+center*2+Height, -spece-Height, spece+center*2+Height])  #グラフの範囲

plt.show()
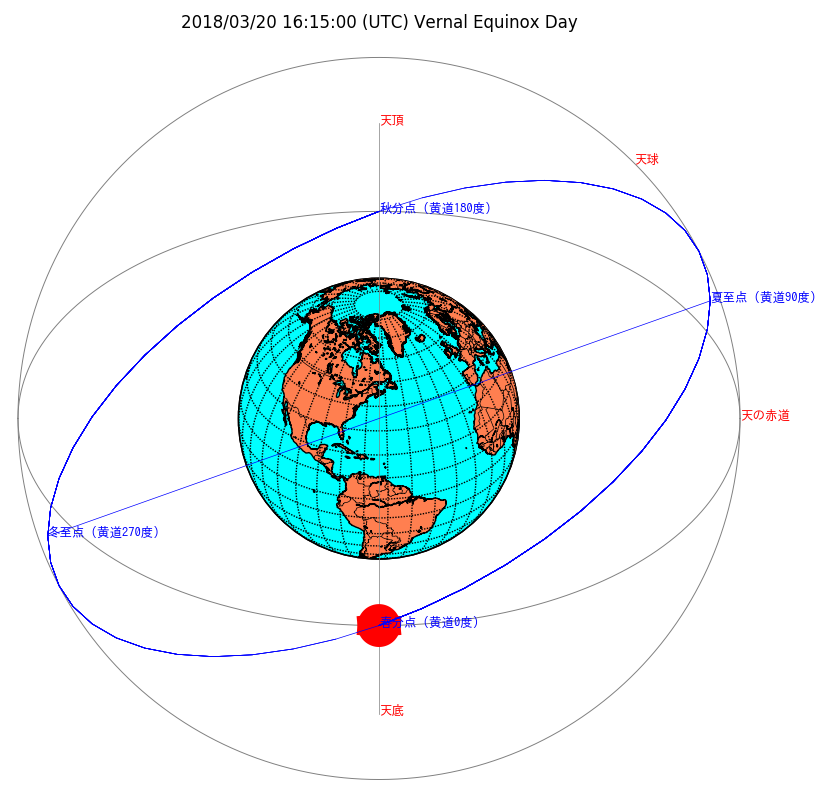
2018年に地球が春分点を通過した時の地球と太陽
黄道の楕円は軌道を分割し座標を計算し、折れ線グラフで楕円を描画しました。
天文関係は難しいですね。なかなか理解が出来ません。
# !/usr/bin/python3
# coding: UTF-8

from mpl_toolkits.basemap import Basemap
import numpy as np
import matplotlib.pyplot as plt
import datetime
import sys

def get_input(prompt): #データ入力に必要
    if sys.hexversion > 0x03000000:
        return input(prompt)
    else:
        return raw_input(prompt)

def sun_revolution_cycle(h):
    #太陽が引数H時間に何度公転するか計算
    revolution_cycle = 365.242190402 #太陽公転周期(日)
    return np.pi * 2 / revolution_cycle / 24 * h  #(単位:ラジアン)

def earth_rotation_period(h):
    #地球が引数H時間に何度自転するか計算
    #地球の自転周期は約23時間56分4.06秒
    rotation_period = 23. +  56. / 60. + 4.06 / 3600. #地球の自転周期(h)
    return np.pi * 2 / rotation_period * h  #(単位:ラジアン)

ve_str = '2018/03/20 16:15:00' #春分点通過日時(UTC)
def vernal_equinox_longitude():
    #地球が春分点の通過時に正午になる東経を計算
    #引数ve_detetime:春分点通過日時(JST) #文字列 例'2018/03/21 01:15:44'
    ve = datetime.datetime.strptime(ve_str, '%Y/%m/%d %H:%M:%S') #日付型への変換
    #ve_ust = ve - datetime.timedelta(hours=9) #UTCに変換

    ve_h = ve.hour
    ve_m = ve.minute
    ve_s = ve.second

    ve_hh = ve_h + ve_m / 60. + ve_s /3600.
    ve_12 = ve_hh - 12. #結果が+の場合、正午 以降

    #正午から春分点通過時までに自転、公転した角度(ラジアン)
    sun_rot = sun_revolution_cycle(ve_12)
    earth_rot = earth_rotation_period(ve_12)
    return -(earth_rot - sun_rot) #地球が春分点の通過時に正午になる東経 #ve_h_f時間に地球がどれだけ自転するか(単位:ラジアン)

def ecliptic_inclination_angle(yaer):
    #引数の年の黄道傾斜角を求める
    t = (yaer - 2000) / 100.
    return (84381.406 - 46.836769 * t - 0.00059 * t ** 2 + 0.001813 * t ** 3) / 3600. / 180. * np.pi #黄道傾斜角(単位:ラジアン)

# ----追加部
def ecl_xy(lat, r, eia, div_no): #黄道のx,y座標を計算し描画(中心基準)

    #引数
    #lat  地球を見る角度(北緯:ラジアン)
    #r    天球の半径(m)
    #eia  黄道傾斜角(ラジアン)
    #黄道の楕円 a = r
    b = r * np.sin(eia)  #黄道の楕円 b
    i = 0
    for i in range(int(div_no/2)):
        div_angle = 2 * np.pi / div_no * (i+1)  #分割した角度(ラジアン)
        B8 = r *np.cos(div_angle)

        B14 = np.sqrt(b ** 2 *(1 - B8 ** 2 / r ** 2))
        B18 = np.arctan(B14 / B8)
        B17 = lat - B18
        B16 = np.sqrt(B8 ** 2 + B14 ** 2)
        ecl_x1 = r * np.sin(div_angle) * np.cos(eia)  #中心基準
        ecl_y1 = -(B16 * np.sin(B17))

        if (np.pi / 2 < div_angle) and (div_angle <= np.pi):
            ecl_y1 = -ecl_y1

        x_ecl_1.append(ecl_x1 + center)
        y_ecl_1.append(ecl_y1 + center)
        plt.plot(x_ecl_1,y_ecl_1,linewidth=0.5,color='blue') #黄道軌道/2

    x_ecl_2=[ecl_x1 + center]
    y_ecl_2=[ecl_y1 + center]
    j = 0
    for j in range(int(div_no/2)):
        div_angle2 = -2 * np.pi / div_no * (j+1)
        B8_ = r *np.cos(div_angle2)
        B14_ = np.sqrt(b ** 2 *(1 - B8_ ** 2 / r ** 2))
        B18_ = np.arctan(B14_ / B8_)
        B17_ = lat - B18_
        B16_ = np.sqrt(B8_ ** 2 + B14_ ** 2)
        ecl_x2 = r * np.sin(div_angle2) * np.cos(eia)
        ecl_y2 = -(B16_ * np.sin(B17_))

        if (-np.pi / 2 <= div_angle2) and (div_angle2 > -np.pi):
            ecl_y2 = -ecl_y2

        x_ecl_2.append(ecl_x2 + center)
        y_ecl_2.append(ecl_y2 + center)
        plt.plot(x_ecl_2,y_ecl_2,linewidth=0.5,color='blue') #黄道軌道/2
# ----

lon_1 = vernal_equinox_longitude() * 180 / np.pi #度に変換
lat_1 = float(get_input('北緯 (度):'))
lon_0 = lon_1 / 180 * np.pi #ラジアンに変換
lat_0 = lat_1 / 180 * np.pi

font = {'family':'IPAGothic'}

m = Basemap(projection='ortho',lon_0=lon_1,lat_0 = lat_1,resolution='l')
m.drawcoastlines()
m.fillcontinents(color='coral',lake_color='aqua')
m.drawmapboundary(fill_color='aqua')
m.drawcountries()

m.drawmeridians(np.arange(0, 360, 10))
m.drawparallels(np.arange(-90, 90, 10))

Height = 10000000 # (m) 天球の高度(地上から)
center = 6378100 # (m) 地球中心座標
r = center + Height #天球の地球の中心からの距離
x = np.linspace(-r, r, 10000, endpoint=True)
y1 = np.sqrt(r ** 2 - x ** 2)
if lat_1 == 90:
    y = np.sqrt(r ** 2 - x ** 2)
elif lat_1 != 90:
    y = np.sqrt((r * np.sin(lat_0)) ** 2 * (1 - x ** 2 / r ** 2))  #天の赤道
    y2 = r * np.cos(lat_0) #地軸

plt.plot(x + center, y1 + center, 'gray', linewidth=0.7)  #天球
plt.plot(x + center, -y1 + center, 'gray', linewidth=0.7)

plt.plot(x + center, y + center, 'gray', linewidth=0.7)  #天の赤道
plt.plot(x + center, -y + center, 'gray', linewidth=0.7)


xx=[center,center]
yy=[center + y2,center - y2]
plt.plot(xx,yy,linewidth=0.5,color='gray') #地軸


plt.text(center,center + y2,'天頂',fontsize=9,color='red', **font)
plt.text(center,center - y2,'天底',fontsize=9,color='red', **font)
plt.text(center + r / np.sqrt(2),center + r / np.sqrt(2),'天球',fontsize=9,color='red', **font)

r3 = 500000 #太陽の半径
x3 = np.linspace(-r3, r3, 100, endpoint=True)
y3 = np.sqrt(r3 ** 2 - x3 ** 2)
if lat_1 > 0:
    plt.plot(x3+center, y3+(center - np.sqrt((r * np.sin(lat_0)) ** 2)), 'red', linewidth=15)  #太陽
    plt.plot(x3+center, -y3+(center - np.sqrt((r * np.sin(lat_0)) ** 2)), 'red', linewidth=15)
    plt.text(center,center - np.sqrt((r * np.sin(lat_0)) ** 2),'春分点(黄道0度)',fontsize=9,color='blue', **font)
    plt.text(center,center + np.sqrt((r * np.sin(lat_0)) ** 2),'秋分点(黄道180度)',fontsize=9,color='blue', **font)
else:
    plt.plot(x3+center, y3+(center + np.sqrt((r * np.sin(lat_0)) ** 2)), 'red', linewidth=15)   #太陽
    plt.plot(x3+center, -y3+(center + np.sqrt((r * np.sin(lat_0)) ** 2)), 'red', linewidth=15)
    plt.text(center,center + np.sqrt((r * np.sin(lat_0)) ** 2),'春分点(黄道0度)',fontsize=9,color='blue', **font)
    plt.text(center,center - np.sqrt((r * np.sin(lat_0)) ** 2),'秋分点(黄道180度)',fontsize=9,color='blue', **font)

plt.text(center + r,center,'天の赤道',fontsize=9,color='red', **font)

# 黄道(Ecliptic)
year1 = int(ve_str[:4])  #表示する西暦年
ecl_year1 = ecliptic_inclination_angle(year1)  #その年の黄道傾斜角(ラジアン)
ecl_x = np.cos(ecl_year1) * r #夏至点(黄道90度)
ecl_y = np.cos(lat_0) * r * np.sin(ecl_year1)
x_ecl = [center + ecl_x,center - ecl_x]
y_ecl = [center + ecl_y,center - ecl_y]
plt.plot(x_ecl,y_ecl,linewidth=0.5,color='blue') #夏至点と冬至点を結ぶ線
plt.text(center + ecl_x,center + ecl_y,'夏至点(黄道90度)',fontsize=9,color='blue', **font)
plt.text(center - ecl_x,center - ecl_y,'冬至点(黄道270度)',fontsize=9,color='blue', **font)

# ---追加部
# 黄道を分割して、座標を計算し折れ線グラフで楕円を描画する
div_no = 48 #黄道分割数
x_ecl_1 = [center] #春秋分点の座標から始める
if lat_1 < 0:
    y_ecl_1 = [np.sqrt((r * np.sin(lat_0)) ** 2) + center]
elif lat_1 >= 0:
    y_ecl_1 = [-np.sqrt((r * np.sin(lat_0)) ** 2) + center]

ecl_xy(lat_0, r, ecl_year1,div_no) #黄道を描画する関数
# ---

spece = 1000000
plt.axis([-spece-Height, spece+center*2+Height, -spece-Height, spece+center*2+Height])  #グラフの範囲

plt.title('{} (UTC) Vernal Equinox Day'.format(ve_str))

plt.show()