実行した環境
Ubuntu Stdio 18.04LTS
Python 3.6.7
参考
簡単なアナログ時計
https://qiita.com/ty21ky/items/c4e91fbb749ae2309f69
のコメント欄で教えて頂いたコード
Pythonで世界地図-18(地球が自転するアニメグラフ)
https://qiita.com/ty21ky/items/0c6c7b53eeaa789a89c5
約半年ぶりにPythonをさわったので、殆ど忘れているので思い出すために作りました。
見苦しいコードかも知れませんが、ご了承ください。
basemap_clock.py
# !/usr/bin/python3
# -*- coding: utf-8 -*-
import numpy as np
from matplotlib import pyplot as plt
from mpl_toolkits.basemap import Basemap
from matplotlib import animation
from datetime import datetime #日時を取得
from math import pi
lat = 0. #地球を描画する中心位置座標(北緯)
lon = 135. #(東経)
center = 6378136.6 #地球の半径(m)
def _update(frame):
# 現在の画面を消去する
plt.cla()
#時計の関数
def point(x, y, angle, distance):
return (x + np.sin(np.radians(angle)) * distance,
y + np.cos(np.radians(angle)) * distance)
def clock():
def needle(divide, length, width):
def draw(time):
angle = (time % divide) / divide * 360
x0 = y0 = center
x1, y1 = point(x0, y0, angle, length)
plt.plot([x0,x1],[y0,y1], 'b', linewidth = width)
return draw
draw_hour = needle( 12, length=center * 0.5, width=6)
draw_minute = needle( 60, length=center * 0.85, width=4)
draw_second = needle( 60, length=center * 0.9, width=2)
now = datetime.now()
draw_hour(now.hour + now.minute / 60 + now.second / 3600)
draw_minute(now.minute + now.second / 60)
draw_second(now.second)
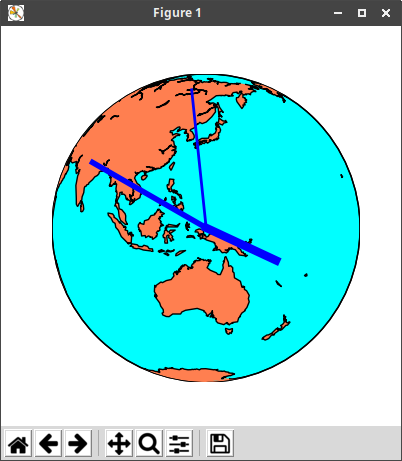
#時計描画
clock()
#地球描画
my_map = Basemap(projection='ortho', lat_0=lat, lon_0=lon,resolution='c', area_thresh=10000.0)
my_map.drawcoastlines() #海岸線描画
my_map.drawmapboundary(fill_color='aqua') #海も陸地も着色する
my_map.fillcontinents(color='coral',lake_color='aqua') #陸地と湖の色の指定
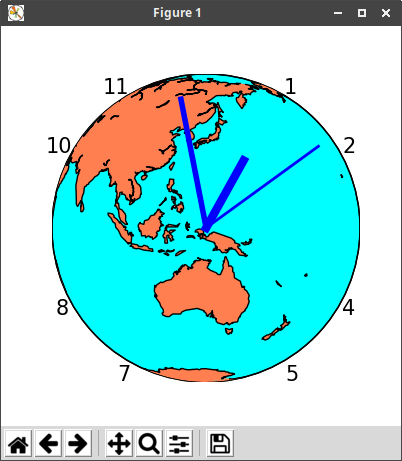
#文字盤(3,6,9,12時はなし。グラフの範囲外のため)
plt.text(center * (1+np.cos(60/180*pi)), center * (1+np.sin(60/180*pi)), '1', color="k", fontsize=15) #1時
plt.text(center * (1+np.cos(30/180*pi))+100000, center * (1+np.sin(30/180*pi))-100000, '2', color="k", fontsize=15) #2時
plt.text(center * (1+np.cos(30/180*pi))+100000, center * (1-np.sin(30/180*pi))-400000, '4', color="k", fontsize=15) #4時
plt.text(center * (1+np.cos(60/180*pi))+100000, center * (1-np.sin(60/180*pi))-800000, '5', color="k", fontsize=15) #5時
plt.text(center * (1-np.cos(60/180*pi))-500000, center * (1-np.sin(60/180*pi))-800000, '7', color="k", fontsize=15) #7時
plt.text(center * (1-np.cos(30/180*pi))-700000, center * (1-np.sin(30/180*pi))-400000, '8', color="k", fontsize=15) #8時
plt.text(center * (1-np.cos(30/180*pi))-1100000, center * (1+np.sin(30/180*pi))-100000, '10', color="k", fontsize=15) #10時
plt.text(center * (1-np.cos(60/180*pi))-1100000, center * (1+np.sin(60/180*pi)), '11', color="k", fontsize=15) #11時
return
def main():
# 描画領域
fig = plt.figure(figsize=(4, 4))
params = {
'fig': fig,
'func': _update, # グラフを更新する関数
'interval': 500, # 更新間隔 (ミリ秒)
'repeat': True, # 繰り返す
}
anime = animation.FuncAnimation(**params)
# グラフを表示する
plt.show()
plt.close() #クローズしてメモリを開放する。連続して行う場合は必ず必要。
if __name__ == '__main__':
main()