はじめに
go-echarts
を使ってチャートを出力するシリーズの3つ目の記事です。
1つ目は、
です。
今回は、横棒グラフの出力方法です。
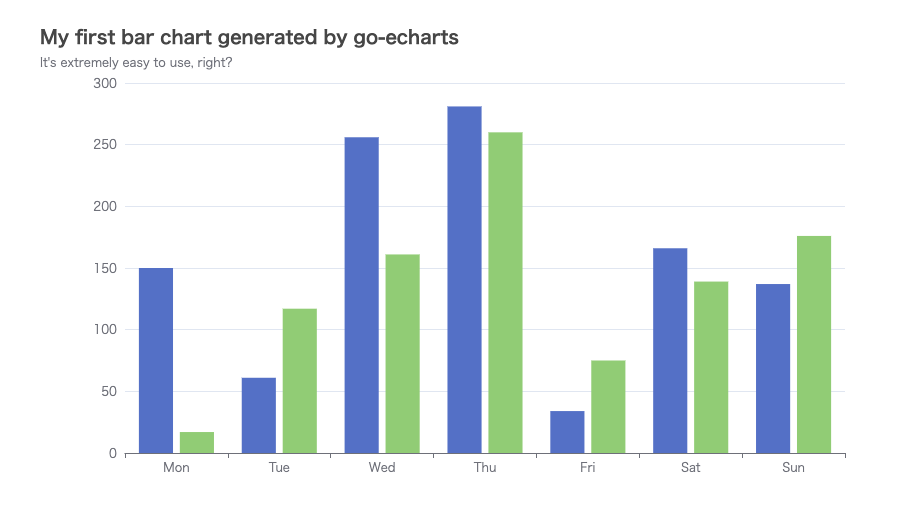
go-echartsのGitHubにあるサンプルプログラムを、そのまま実行すると縦棒グラフ
が表示されます。
これを1行追加するだけで、横棒グラフにできるという、お話です。
横棒グラフの出力
横棒グラフは、
package main

import (
	"math/rand"
	"os"

	"github.com/go-echarts/go-echarts/v2/charts"
	"github.com/go-echarts/go-echarts/v2/opts"
)

// generate random data for bar chart
func generateBarItems() []opts.BarData {
	items := make([]opts.BarData, 0)
	for i := 0; i < 7; i++ {
		items = append(items, opts.BarData{Value: rand.Intn(300)})
	}
	return items
}

func main() {
	// create a new bar instance
	bar := charts.NewBar()
	// set some global options like Title/Legend/ToolTip or anything else
	bar.SetGlobalOptions(
		charts.WithTitleOpts(opts.Title{
			Title:    "My first bar chart generated by go-echarts",
			Subtitle: "It's extremely easy to use, right?",
		}),
		charts.WithLegendOpts(opts.Legend{Show: opts.Bool(false)}),
	)

	// Put data into instance
	bar.SetXAxis([]string{"Mon", "Tue", "Wed", "Thu", "Fri", "Sat", "Sun"}).
		AddSeries("Category A", generateBarItems()).
		AddSeries("Category B", generateBarItems())
	// X <-> Y
	bar.XYReversal()
	// Where the magic happens
	f, _ := os.Create("hbar.html")
	bar.Render(f)
}
です。
サンプルのコードから変更したのは、
// X <-> Y
	bar.XYReversal()
の行を追加して、X軸とY軸を入れ替えただけです。
ただし凡例がタイトルに重なって見にくいので、
charts.WithLegendOpts(opts.Legend{Show: opts.Bool(false)}),
の行も追加しています。

