はじめに
本記事は Java アプリで任意のメトリクスをInstana で可視化する(JMX編) の続きとなります。
今回は、JMXでは無く、micrometer で JavaアプリのConnectionPoolの状態を Instana で可視化してみます。
検証用サンプルアプリ
Instana で Javaアプリ内のデータベースコネクションプールのメトリクスをmicrometer経由で可視化します。
今回は、Spring Boot を使います。
(生Javaアプリだとうまくmicrometerが動かなかったので、Web上で実績の多いSpring Bootを採用しました)
以下の内容で、データベースにただひたすらデータを登録するアプリケーションを作成します。
環境
JMXと同じです。アプリがSpring Boot を使っているだけです。
OS: RHEL9.6
Java: OpenJDK17
Framework: Spring Boot
Connection Pool: Apache Commons DBCP2 2.13
JDBC Driver: IBM Db2 JDBC Driver (Type 4) 12.1.3
データベース: Db2 v12.1.3
Instana Agent: エージェントバージョン:2025.12.12.0748、ブートバージョン:1.2.49
データベースとInstana Agentは導入済みとします。
Instana Agent と Db2 の導入・監視については InstanaでDb2を監視してみよう! を参考にしてください。
実装
アプリ概要と事前準備は Java アプリで任意のメトリクスをInstana で可視化する(JMX編) を参照してください。
ファイルが多いので、今回はSpring Boot内でのmicrometer設定だけを記載します。
metrics/DbcpMetricsConfig.java
package com.example.db2pool.metrics;

import io.micrometer.core.instrument.Gauge;
import io.micrometer.core.instrument.MeterRegistry;
import io.micrometer.core.instrument.Counter;
import io.micrometer.core.instrument.Timer;
import org.apache.commons.dbcp2.BasicDataSource;
import org.springframework.context.annotation.Bean;
import org.springframework.context.annotation.Configuration;

@Configuration
public class DbcpMetricsConfig {

    @Bean
    public Counter insertCounter(MeterRegistry registry) {
        return Counter.builder("db2.insert.count")
                .description("Number of rows inserted into Test1")
                .register(registry);
    }

    @Bean
    public Timer insertTimer(MeterRegistry registry) {
        return Timer.builder("db2.insert.timer")
                .description("Insertion duration into Test1")
                .register(registry);
    }

    @Bean
    public Object dbcpGauges(MeterRegistry registry, BasicDataSource dataSource) {
        Gauge.builder("dbcp.num.active", dataSource, BasicDataSource::getNumActive)
                .description("Active connections in Apache Commons DBCP pool")
                .tag("pool", "Db2Pool")
                .register(registry);

        Gauge.builder("dbcp.num.idle", dataSource, BasicDataSource::getNumIdle)
                .description("Idle connections in Apache Commons DBCP pool")
                .tag("pool", "Db2Pool")
                .register(registry);
        // Return a dummy bean so Spring instantiates this configuration
        return new Object();
    }
}
Instana設定
Instana 側は、設定不要で自動的に取り込みを行います!!
JMXより楽ですね (びっくり)
実行
Mavenビルドで作成されたJarファイルを使って実行します。
java -jar target/db2-dbcp-micrometer-demo-0.1.0.jar
こんな出力が出れば無事起動完了です。
  .   ____          _            __ _ _
 /\\ / ___'_ __ _ _(_)_ __  __ _ \ \ \ \
( ( )\___ | '_ | '_| | '_ \/ _` | \ \ \ \
 \\/  ___)| |_)| | | | | || (_| |  ) ) ) )
  '  |____| .__|_| |_|_| |_\__, | / / / /
 =========|_|==============|___/=/_/_/_/

 :: Spring Boot ::                (v3.3.5)

2025-12-22T01:58:12.793Z  INFO 481004 --- [db2-dbcp-micrometer-demo] [           main] com.example.db2pool.Application          : Starting Application v0.1.0 using Java 17.0.17 with PID 481004 (/home/itzuser/db2-dbcp-micrometer-demo/target/db2-dbcp-micrometer-demo-0.1.0.jar started by itzuser in /home/itzuser/db2-dbcp-micrometer-demo)
2025-12-22T01:58:12.798Z  INFO 481004 --- [db2-dbcp-micrometer-demo] [           main] com.example.db2pool.Application          : No active profile set, falling back to 1 default profile: "default"
2025-12-22T01:58:14.227Z  INFO 481004 --- [db2-dbcp-micrometer-demo] [           main] c.e.db2pool.runner.BurstLoadRunner       : BurstLoadRunner started: generating concurrent DB work to show DBCP pool metrics fluctuations
2025-12-22T01:58:15.278Z  INFO 481004 --- [db2-dbcp-micrometer-demo] [           main] com.example.db2pool.Application          : Started Application in 3.045 seconds (process running for 3.612)
数分待ちます。
Instanaでの可視化
まずはインフラストラクチャーを確認します。
JVMがちゃんと認識されました。

db2-dbcp-micrometer-demo 0.1.0 をクリックしてダッシュボードを開くを選択します。
JVMのスレッド数やヒープ・メモリーなどを見ることができる画面に遷移しました。
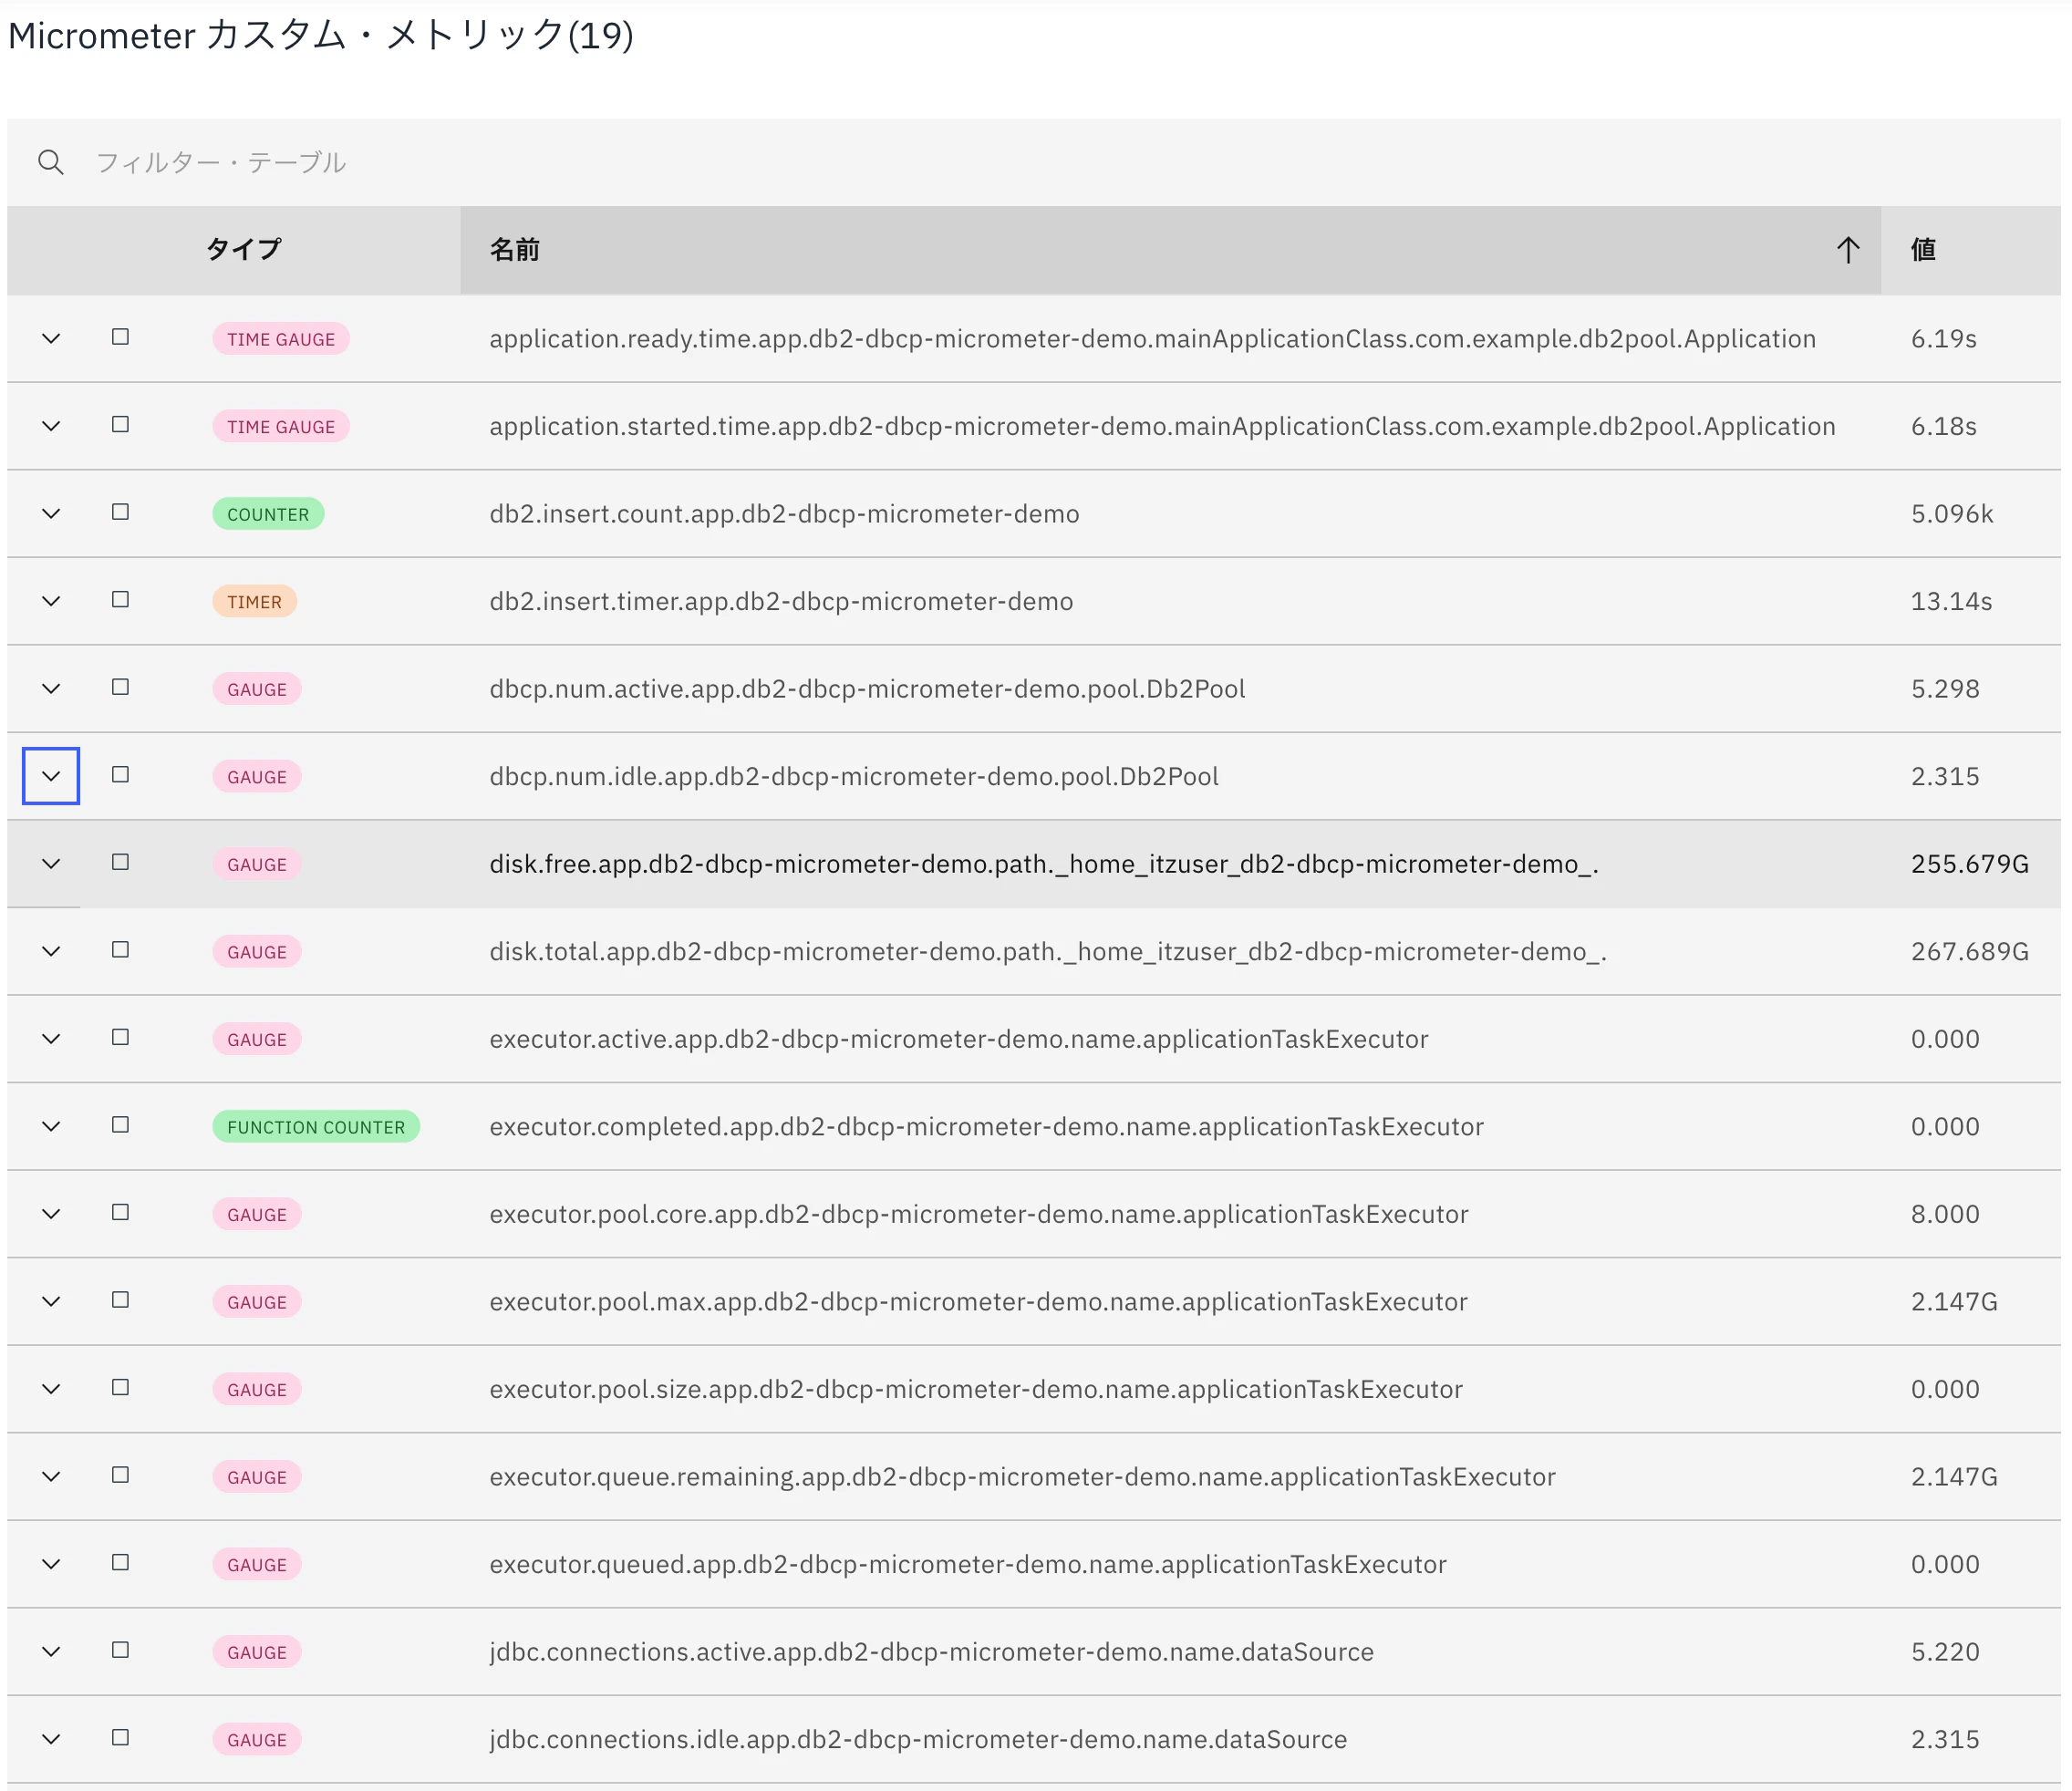
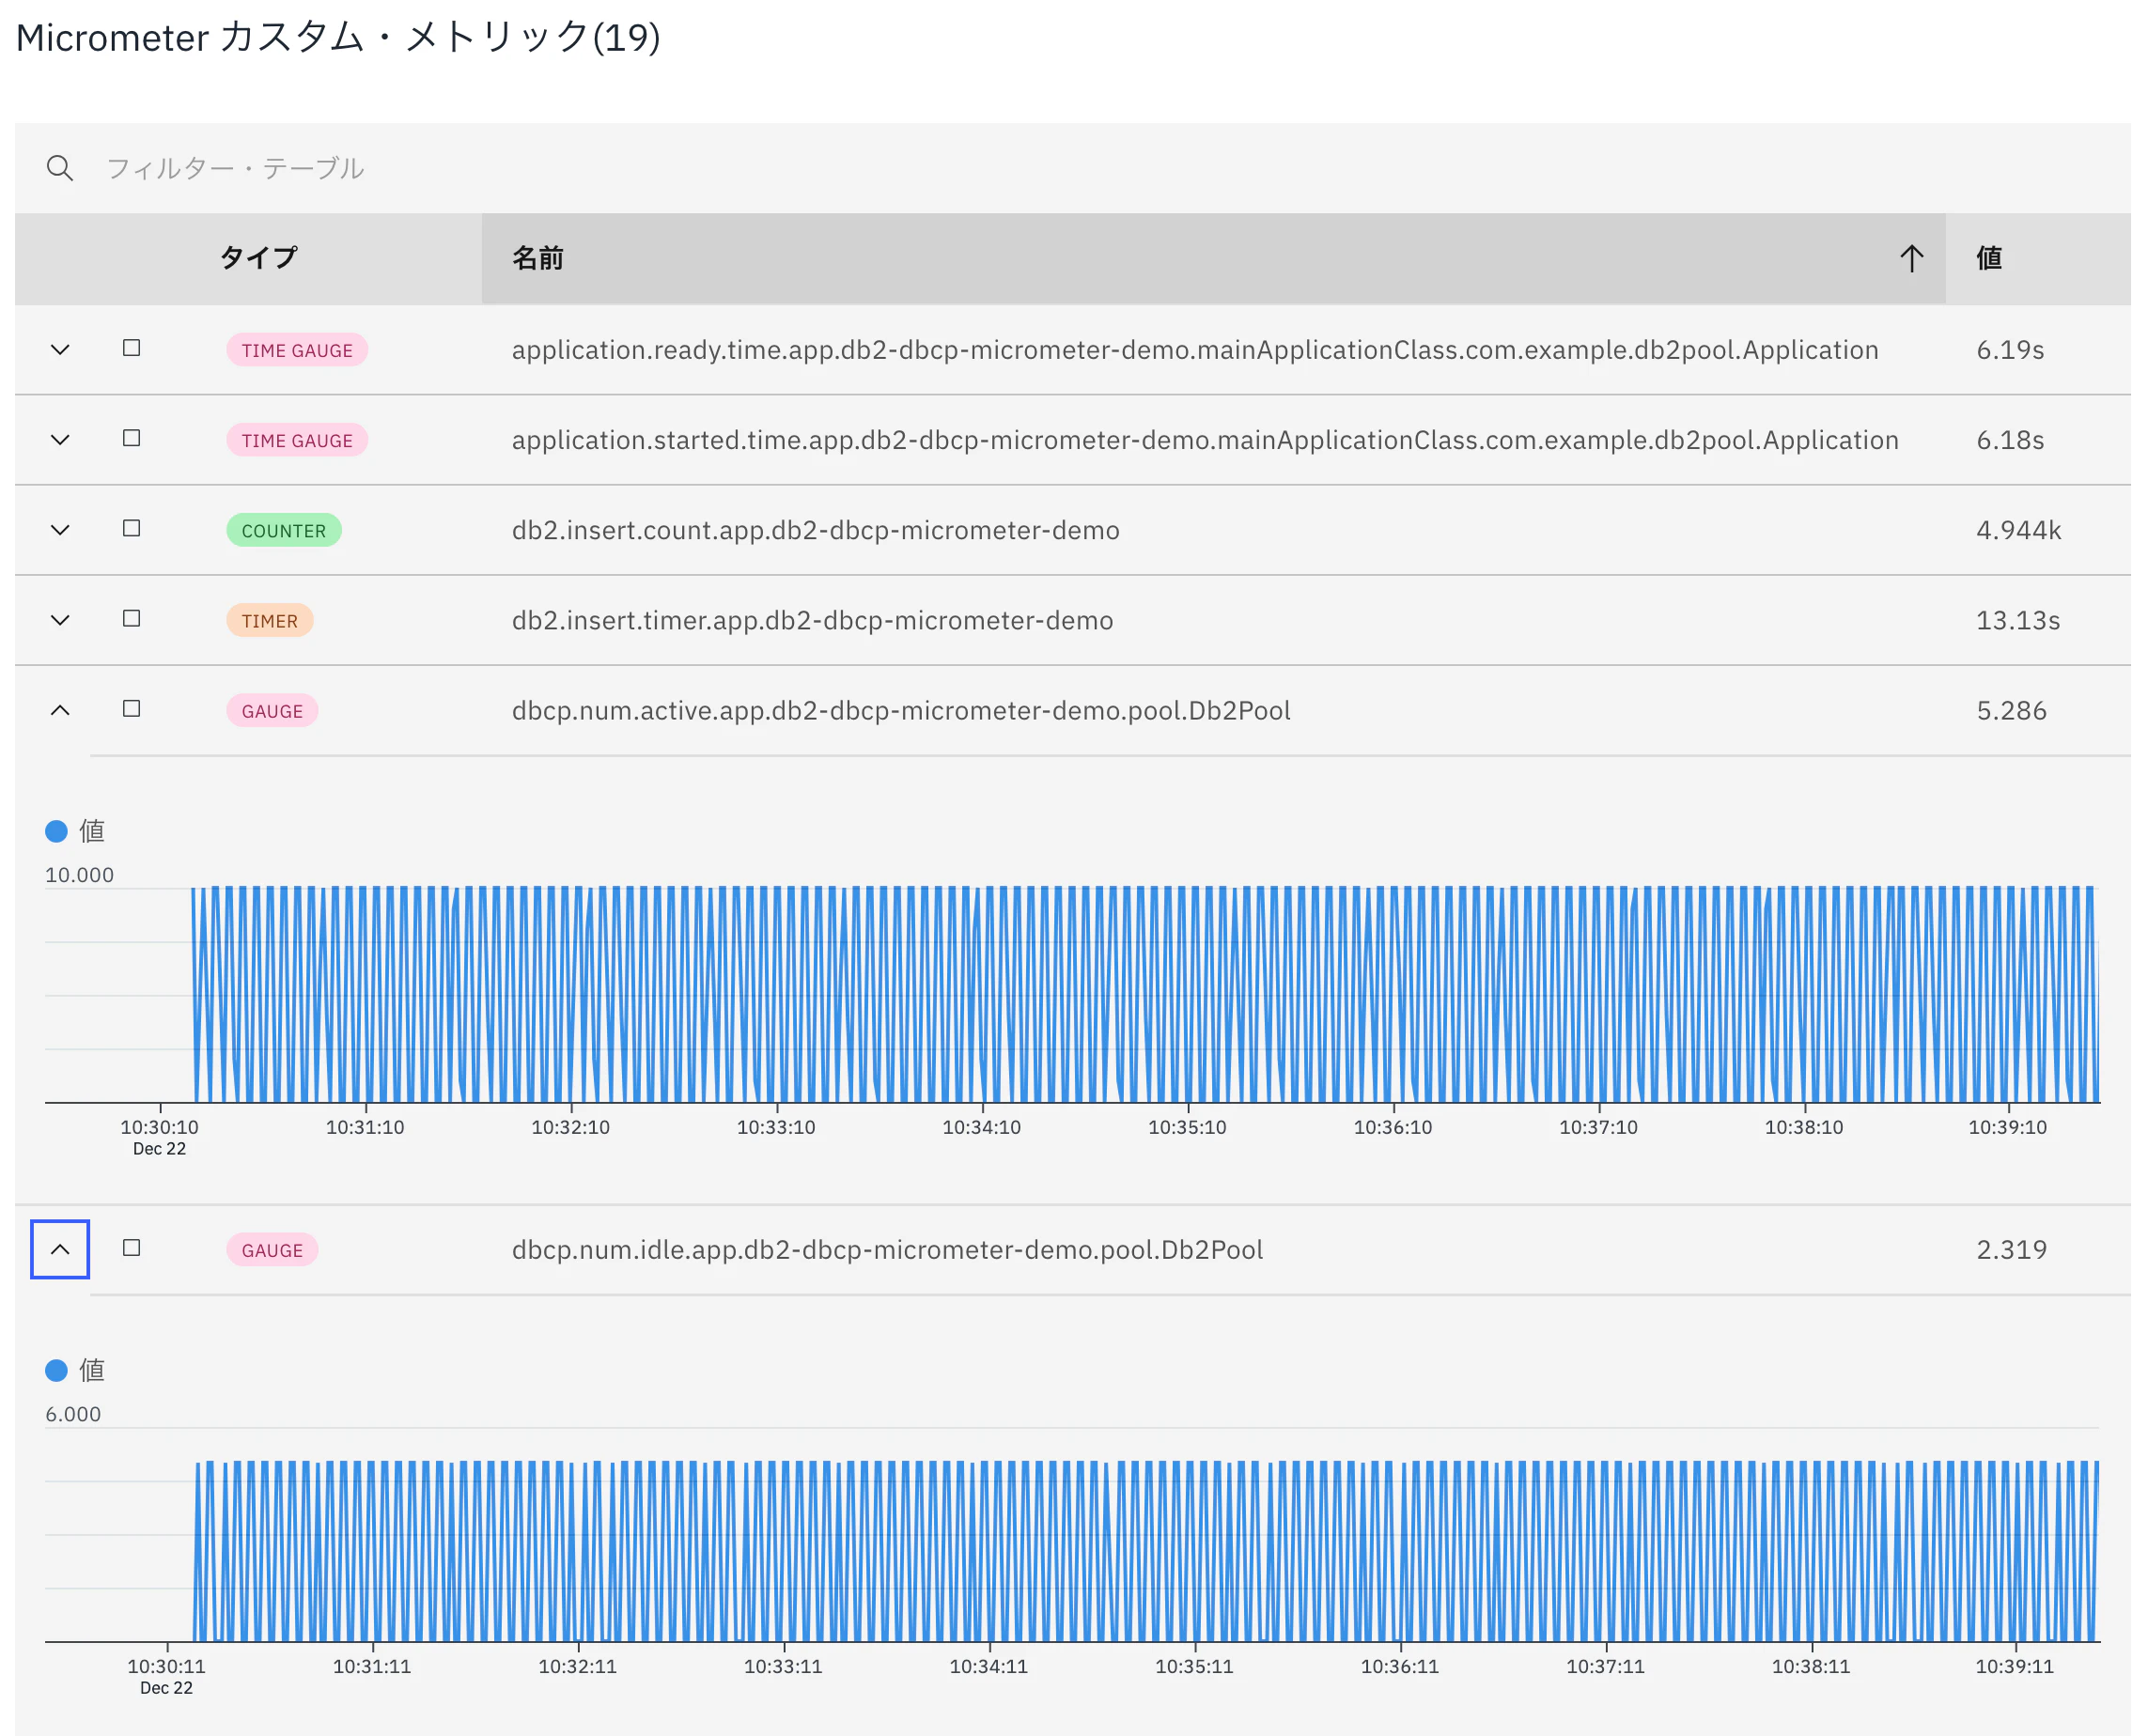
このページの一番下まで遷移すると、Micrometer カスタム・メトリック があることが確認できます。
上から3番目〜6番目までの4つが、今回明示的に作成したカスタムメトリックです。それ以外はMicrometer(Spring)側が自動的に出力したメトリクスですね。
項目をオープンすると、ちゃんとグラフを確認できることを確認しました。
JMXより若干簡単ですね!SpringBootを使っている場合はMicrometerの方が必要な作業は少なさそうです。
必要に応じて使いやすい方を選択ください。
カスタムダッシュボード
カスタムダッシュボードについてもJMX編をご確認いただくとして、
カスタムダッシュボードでもmicrometerメトリクスを選択できます!

Micrometerでも簡単に可視化できることが確認できました。
もし Instana が対応していないJavaアプリのメトリクスを可視化したい場合は、JMX や Micrometer の利用を検討してください!