目的
- Pythonでカオスマップを作れないかと思い、ベン図に画像を載せる方法を調査・実験してみた
結果
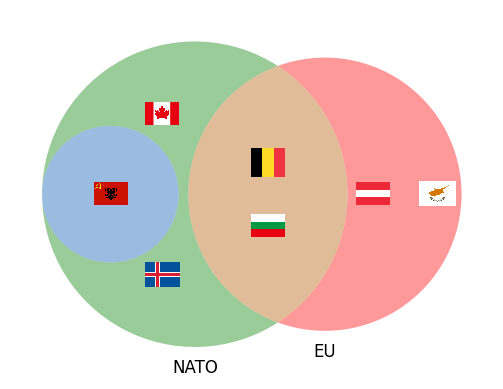
- matplotlib_vennを使って下記のような図を作成できた
(元ネタはこちら)
大まかな流れ
- matplotlib_vennを使ってベン図を描画
- 画像を各領域に配置する
コード整理中につき、現状のコード全文へのリンク・より詳細にご興味がある場合はこちらからどうぞ
ポイント:matplotlibでの画像の扱い方
-
matplotlibのOffsetImage、AnnotationBboxを作成し、AxesにArtistとして追加することで作図した
- AnnotationBboxは、特定の位置 xy を参照する OffsetBox のコンテナであるため、OffsetImageを設定することで、グラフの設定した位置に画像を描画するArtistとすることができる
- OffsetImageはImageを読み込めるOffsetBox(コンテナとなるArtist要素)
-
OffsetImage、AnnotationBboxのクラス継承関係は下記の通り(matplotlibのドキュメントの図に追記)
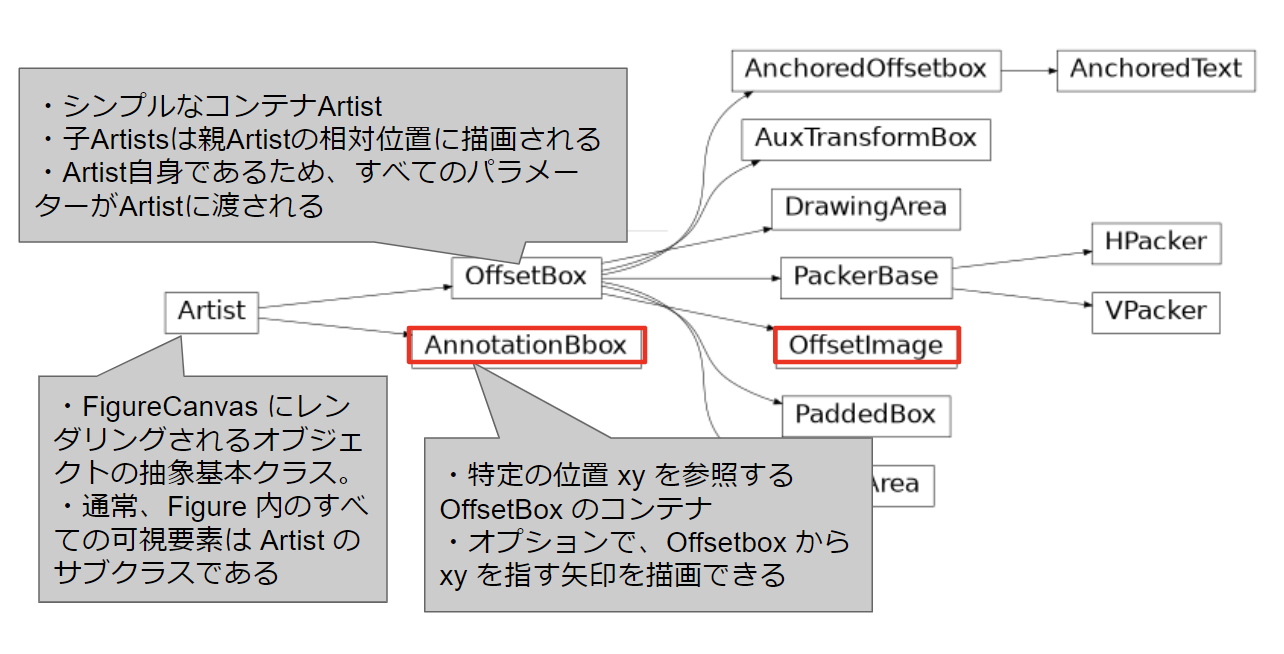
-
該当部分のコードは下記
def im_rend(list_data, ax=None):
    if ax is None:
        ax = plt.gca()
    artists = []
    for data in list_data:
        try:
            data["image"] = plt.imread(data["image"])
        except:
            pass
        im = OffsetImage(data["image"], zoom=data["zoom"])
        ab = AnnotationBbox(im, (data["x"], data["y"]), xycoords='data', frameon=False)
        artists.append(ax.add_artist(ab))
    return artists
- list_dataは下記のようなデータ構造のdictionaryのリスト
{
    'x': (画像を表示するx座標),
    'y': (画像を表示するy座標),
    'image': (画像ファイルのパス),
    'zoom': (画像の拡大率)
}
下記の記事を参考にさせていただきました