はじめに
以前投稿した「netstatで通信の接続状況を定期監視」では、netstatの結果をファイルに書き出すまででしたが、今回は接続先毎に状況を可視化できるようにしてみました。
必要なもの
- Git for Windows(Git Bashを利用します)
- Microsoft Excel(グラフを描画します)
監視スクリプト
netstat_monitor.sh
#!/bin/bash
output_file=`date '+%Y%m%dT%H%M%S'`.tsv
echo "output: ${output_file}"
echo -e "datetime\tserver\tcount" > ${output_file}

while :
do
  date_now=`date '+%Y%m%dT%H%M%S'`
  netstat -an | egrep "ESTABLISHED|CLOSE_WAIT|TIME_WAIT" | awk '{print $3}' | sort | uniq -c | awk '{printf("%s\t%s\n",$2,$1)'} | sed "s/^/${date_now}\t/g" >> ${output_file}
  echo ${date_now}

  sleep 5
done
ポート番号をカットしてサーバー毎にカウントする場合は```awk '{print $3}' | sed "s/:[0-9]+$//g" | sort |
Linuxの場合は```awk '{print $3}'```を```awk '{print $5}'```にします。

```:実行例
$ ./netstat_monitor.sh
output: 20200419T141531.tsv
20200419T141531
20200419T141537
20200419T141542
20200419T141547
20200419T141552
20200419T141557
20200419T141603
:

停止するには[CTRL]+[C]
Excelでグラフ化
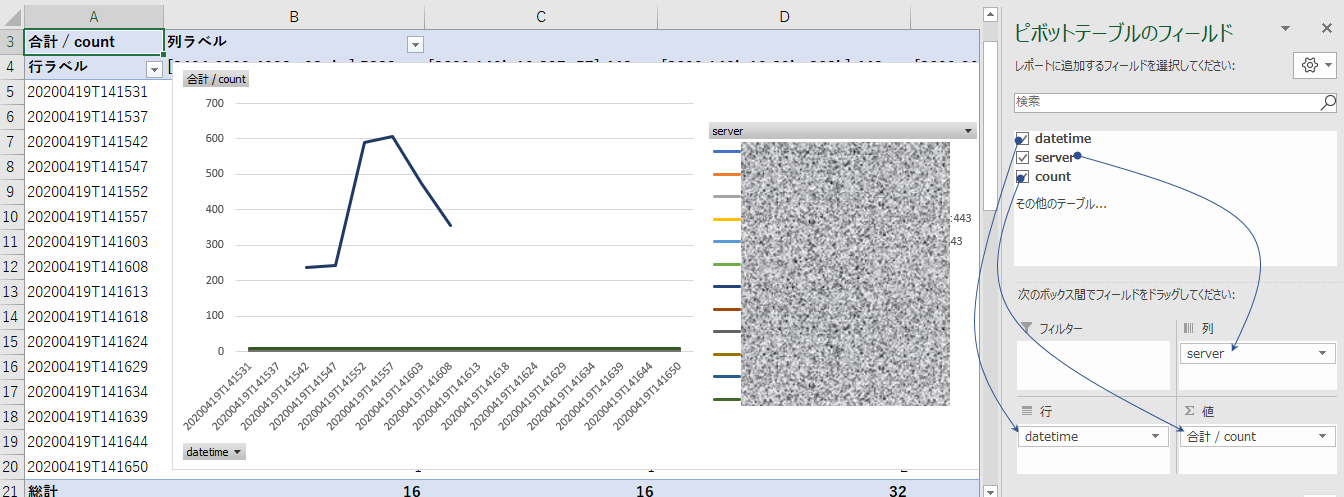
出力されたtsvファイルをExcelに取り込み、ビボットテーブルで集計し、折れ線グラフで可視化します。
Excelに取り込み
ビボットテーブルで集計し、折れ線グラフにする
下図のように、ビボットテーブルのフィールドを設定し、集計結果を基にグラフ化します。

今回のサンプル例は、C# HttpClientのマルチスレッド・プログラムで某サイトにアクセスした結果です。一気に600ポート消費しています。その後、プログラムを停止し消費ポート数が減っていくのが分かります。
