概要
前回は複数のグラフを重ねて表示しました.
[【matplotlib基礎】複数のグラフを重ねて表示する]
(https://qiita.com/trami/items/b501abe7667e55ab2c9f)
今回は,複数のグラフを並べて表示したいと思います.
動作環境
- Windows10(64bit)
- Python 3.7.2
コード
では,早速実装していきましょう.
graph_align.py
"""複数のグラフを並べて描画するプログラム"""
import numpy as np
import matplotlib.pyplot as plt

# figure()でグラフを表示する領域をつくり,figというオブジェクトにする.
fig = plt.figure()

# add_subplot()でグラフを描画する領域を追加する.引数は行,列,場所
ax1 = fig.add_subplot(2, 2, 1)
ax2 = fig.add_subplot(2, 2, 2)
ax3 = fig.add_subplot(2, 2, 3)
ax4 = fig.add_subplot(2, 2, 4)

t = np.linspace(-10, 10, 1000)
y1 = np.sin(t)
y2 = np.cos(t)
y3 = np.abs(np.sin(t))
y4 = np.sin(t)**2

c1,c2,c3,c4 = "blue","green","red","black"      # 各プロットの色
l1,l2,l3,l4 = "sin","cos","abs(sin)","sin**2"   # 各ラベル

ax1.plot(t, y1, color=c1, label=l1)
ax2.plot(t, y2, color=c2, label=l2)
ax3.plot(t, y3, color=c3, label=l3)
ax4.plot(t, y4, color=c4, label=l4)
ax1.legend(loc = 'upper right') #凡例
ax2.legend(loc = 'upper right') #凡例
ax3.legend(loc = 'upper right') #凡例
ax4.legend(loc = 'upper right') #凡例
fig.tight_layout()              #レイアウトの設定
plt.show()
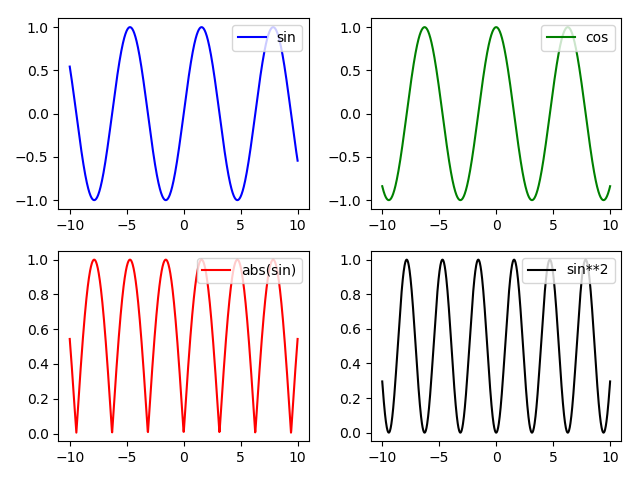
実行結果は以下のようになります.
解説
- fig, axesオブジェクトの作成
コメントにあるように,add_subplot()の引数は行,列,場所となります.
fig = plt.figure()
ax1 = fig.add_subplot(2, 2, 1)
ax2 = fig.add_subplot(2, 2, 2)
ax3 = fig.add_subplot(2, 2, 3)
ax4 = fig.add_subplot(2, 2, 4)
一行で以下のように記述することもでいます.
fig, axes = plt.subplots(nrows=2, ncols=2, sharex=False)
このようにした場合,後半部分を以下のように変更すれば同じ結果が得られます.
axes[0,0].plot(t, y1, color=c1, label=l1) # ax1 = axes[0,0]
axes[0,1].plot(t, y2, color=c2, label=l2) # ax2 = axes[1,0]
axes[1,0].plot(t, y3, color=c3, label=l3) # ax3 = axes[1,0]
axes[1,1].plot(t, y4, color=c4, label=l4) # ax4 = axes[1,1]
あとは,前回のように各種設定を必要に応じてしてあげれば完成です.
まとめ
いかがだったでしょうか?
グラフを並べて描画して比較したいこともよくあると思うのでそのようなときに便利だと思います.
コードに関して建設的な意見があればコメントいただけると助かります.
