はじめに
前回、「Node-Redを利用して基本的なデータ分析をやってみました」において、弊社デモ環境から出力したCSVファイル(オフィスのCO2濃度と気温を測定)を読み込み、折れ線グラフ、ヒストグラム、散布図などを作成してみました。
今回はその続編で「箱ひげ図」の表示に挑戦してみました。
※2022年1月頃の寒い時期のデータを使用しています。
基本的なデータ分析 今回の表示目標
CO2濃度の箱ひげ図
1日の時間帯を以下の4つに分けての表示が今回の表示目標となります。
早朝 00-05 00:00-05:59
午前 06-11 06:00-11:59
午後 12-17 12:00-17:59
夜間 18-23 18:00-23:59
vegaノードを使用して、縦軸に時間帯、横軸にCO2濃度をとり、箱ひげ図を表示します
完成形は以下となりました

<少し考えてみました>
〇時間帯別に見ると以下がわかりました。
早朝 00-05 00:00-5:59
中央値は603、第一四分位が599、第三四分位が606
中央値は他の時間帯と比較して高め
ばらつきがかなり小さい
午前 06-11 06:00-11:59
中央値は552、第一四分位が506、第三四分位が580
中央値は午後、夜間と同程度
ばらつきが大きい
午後 12-17 12:00-17:59
中央値は545、第一四分位が532、第三四分位が569
中央値は午前、夜間と同程度
ばらつきが小さい
夜間 18-23 18:00-23:59
中央値は559、第一四分位が535、第三四分位が609
中央値は午前、午後と同程度
ばらつきが大きい
<ご参考>前回の「Co2濃度の折れ線グラフ」
早朝は600ppm前後で一定値、朝9時前後で450ppmくらいまで下降、
お昼にかけて550ppmくらいまで上昇、午後は少し下降し、夕方にかけて上昇。
夕方から夜間は650ppmくらいまで上昇 といった様子が読み取れます。

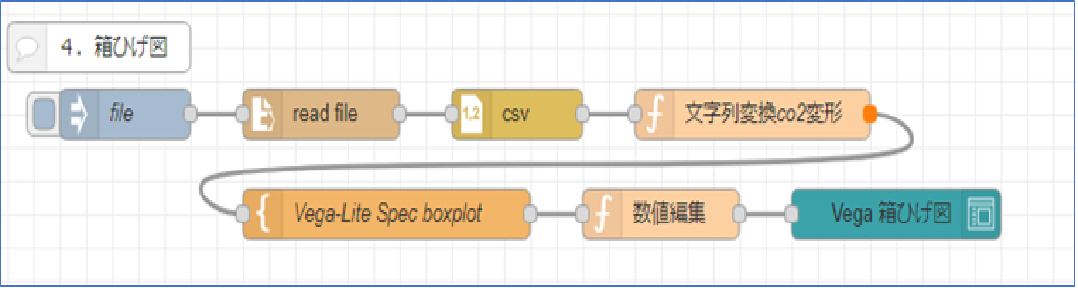
Node-Redで構築 フローの全体図
当方環境はNode-Red ver2.2.2をWindows上で動かしております。
フローの全体は以下となります。ノードは7つでシンプルですが、Functionノード2つにJavaScriptのロジックを入れております。
Node-Redで構築 CSVファイル読込
前回 「Node-Redを利用して基本的なデータ分析をやってみました」と同じ内容です。
https://qiita.com/tota_nissho/items/f6d6d94eb23cd4d9240d
読み込むCSVファイルはヘッダがなく、以下のような形式です。
1列目がタイムスタンプ、2列目がCO2濃度(整数)、3列目が温度となっております。
===
2022/01/04 00:01:19,527,21.1625
・・・
2022/01/04 23:59:19,605,22.2250
===
まず、injectノード(file)ではfilenameをセットします
次に、read fileノード 出力は文字列、文字コードはデフォルトです
最後にCSVノード 区切り文字はコンマ、数値を変換するにチェックを入れます
これでCSVデータをNode-Red上に持ってくる設定ができました。
Node-Redで構築 箱ひげ図 ファイルを時間帯別に分割
まず、Functionノード(文字列変換CO2変形)で、データを分割します。
「1列目がタイムスタンプ、2列目がCO2濃度、3列目が温度」のデータから、
以下の4つのファイルを作成し、CO2濃度順にSORTします。
・早朝 00-05 00:00-05:59 のデータ
・午前 06-11 06:00-11:59 のデータ
・午後 12-17 12:00-17:59 のデータ
・夜間 18-23 18:00-23:59 のデータ
ChangeロールでjSONataなどで設定したかったのですが、方法がわからず、
JavaScriptで実装することといたしました。もう少しシンプルにしたかったのですが、少々冗長なロジックとなり、恐縮です。
ご参考:Functionノード(文字列変換CO2変形)のロジックとなります
以下は変数設定
var file_old = msg.payload;
var v = []; var w = [];var x = [];var y = [];var z = [];
var values01 = [];var values02 = [];var values03 = [];var values04 = [];
var ix=0;
次に、読み込んだCSVファイルを4つの時間帯に分割します。
for (ix = 0; ix < file_old.length; ix ++) {
    if ('00' <= file_old[ix].col1.substr( 11, 2 )  && file_old[ix].col1.substr( 11, 2 ) <= '05') {
      v[ix] = '00-05'; x[ix] = Number(file_old[ix].col2); values01.push({  Time: v[ix], Co2: x[ix]  })
    }  else if ('06' <= file_old[ix].col1.substr( 11, 2 )  && file_old[ix].col1.substr( 11, 2 ) <= '11') {
      v[ix] = '06-11'; x[ix] = Number(file_old[ix].col2); values02.push({  Time: v[ix], Co2: x[ix]  })
    }  else if ('12' <= file_old[ix].col1.substr( 11, 2 )  && file_old[ix].col1.substr( 11, 2 ) <= '17') {
      v[ix] = '12-17'; x[ix] = Number(file_old[ix].col2); values03.push({  Time: v[ix], Co2: x[ix]  })
    } else if ('18' <= file_old[ix].col1.substr( 11, 2 )  && file_old[ix].col1.substr( 11, 2 ) <= '23') {
      v[ix] = '18-23'; x[ix] = Number(file_old[ix].col2); values04.push({  Time: v[ix], Co2: x[ix]  })
    }
    }
最後に分割した4ファイルをCO2の濃度順にSORTします
msg.dataco2_01 = values01;
msg.dataco2_01.sort(function (e, f) {
  if(e.Time < f.Time) { return -1 }
    else if(e.Time > f.Time) { return 1;  }
  if(e.Co2 < f.Co2) { return -1 }
    else if(e.Co2 > f.Co2) { return 1;  }// Co2 を比較
      return 0;});  // いずれにも当てはまらなければ 0 を返す

//以下 msg.dataco2_02からmsg.dataco2_04も同様に処理

return msg;
Node-Redで構築 箱ひげ図 Vegaの設定
templateノードでVegaの設定をします。
{
  "$schema": "https://vega.github.io/schema/vega-lite/v5.json",
  "title": "CO2 時間帯別箱ひげ図",
  "width": 800,
  "height": 300,
  "data": {
    "values": []
  },
  "encoding": {"y": {"field": "Species", "type": "nominal", "title": null}},
  "layer": [
    {
      "mark": {"type": "rule"},
      "encoding": {
        "x": {"field": "lower", "type": "quantitative","scale": {"zero": false}, "title": null},
        "x2": {"field": "upper"}
      }
    },
    {
      "mark": {"type": "bar", "size": 30},
      "encoding": {
        "x": {"field": "q1", "type": "quantitative"},
        "x2": {"field": "q3"},
        "color": {"field": "Species", "type": "nominal", "legend": null}
      }
    },
    {
      "mark": {"type": "tick", "color": "white", "size": 30},
      "encoding": {
        "x": {"field": "median", "type": "quantitative"}
      }
    },
    {
      "transform": [{"flatten": ["outliers"]}],
      "mark": {"type": "point", "style": "boxplot-outliers"},
      "encoding": {
        "x": {"field": "outliers", "type": "quantitative"}
      }
    }
  ]
}
上記の設定手順は以下となります。
・以下をCopyしtemplateノードに貼り付けします。
https://vega.github.io/vega-lite/examples/boxplot_preaggregated.html
・以下5か所を変更
・ titleの変更
・ "width": 800, "height": 300, を追加
・ "values": [] への変更 中身のデータを消去
・ "mark": {"type": "bar", "size": 14} を
"mark": {"type": "bar", "size": 30} に変更 (2か所)
Node-Redで構築 箱ひげ図 数値編集とVegaノード
1.Functionノード(数値変換)は以下となります。
・以下のValue値の部分と同様になるように数値を編集します。
https://vega.github.io/vega-lite/examples/boxplot_preaggregated.html
    "values": [{
      "Species": "Adelie",
      "lower": 2850,
      "q1": 3350,
      "median": 3700,
      "q3": 4000,
      "upper": 4775,
      "outliers": []
    }
以下は変数設定
//変数設定
var file_old_01 = msg.dataco2_01;
var x = [];var y = [];var z = [];var values = [];
var ix1=0;var ix2=0;var ix3=0;var ix0=0;
次に、時間帯で4つに分割したファイルのそれぞれについて、種別(時間帯)と最小値(lower)、第一四分位(q1)、中央値(median)、第三四分位(q3)、最大値(upper)を抽出し、セットします。
for (ix0 = 0; ix0 < 4; ix0 ++) {
//種別(時間帯)と最小値(lower)
    if(ix0==0){file_old_01 = msg.dataco2_01; y[0] = '00-05';}
    else if(ix0==1){file_old_01 = msg.dataco2_02; y[0] = '06-11';}
    else if(ix0==2){file_old_01 = msg.dataco2_03; y[0] = '12-17';}
    else if(ix0==3){file_old_01 = msg.dataco2_04; y[0] = '18-23';}
     y[1] = Number(file_old_01[0].Co2) ;
// 第一四分位(q1)
     ix1 = Number(file_old_01.length-1) / 4;
     if (ix1 == Math.floor(ix1)){
        y[2] = Number(file_old_01[ix1].Co2) ;
     }else{
         ix1 = Math.floor(ix1)
         y[2] = Number(file_old_01[ix1].Co2) + (Number(file_old_01[ix1+1].Co2) - Number(file_old_01[ix1].Co2)) / 2
     }
//中央値(median)
     ix2 = Number(file_old_01.length-1) / 2;
     if (ix2 == Math.floor(ix2)){
        y[3] = Number(file_old_01[ix2].Co2)
     }else{
          ix2 = Math.floor(ix2)
          y[3] = Number(file_old_01[ix2].Co2) + (Number(file_old_01[ix2+1].Co2) - Number(file_old_01[ix2].Co2))/ 2
      }
//第三四分位(q3)
     ix3 = Number(file_old_01.length-1) * 3 / 4;
     if (ix3 == Math.floor(ix3)){
        y[4] = Number(file_old_01[ix3].Co2) ;
     }else{
         ix3 = Math.floor(ix3)
        y[4] = Number(file_old_01[ix3].Co2) + (Number(file_old_01[ix3+1].Co2) - Number(file_old_01[ix3].Co2)) / 2
     }
//最大値(upper)
     y[5] = Number(file_old_01[file_old_01.length-1].Co2) ;

    values.push ({ "Species": y[0], "lower": y[1], "q1": y[2], "median": y[3], "q3": y[4], "upper": y[5], "outliers": []})
}
// 出力設定:
msg.payload.data.values = values;
return msg;
2.最後にVegaノードをセットし、Group,Size,Nameをセットします
おわりに、続編に向けて
今回は「箱ひげ図」にチャレンジしてみました。
Vegaノードでは各種可視化がまだまだ可能なようですので、引き続き試していきたいと考えています。