1
1

Delete article

Deleted articles cannot be recovered.

Draft of this article would be also deleted.

Are you sure you want to delete this article?

More than 5 years have passed since last update.

[Numpyを使用]等間隔の数値を生成する方法~グラフ描写に便利~

Last updated at Posted at 2018-04-06

matplotlibを用いてグラフを書くときグラフの範囲(x軸0〜2πなど)を設定するために必要になる関数についてまとめる.もしこれを読んだらこの記事を読んでグラフを描写してみてほしいです.

#今回紹介する関数

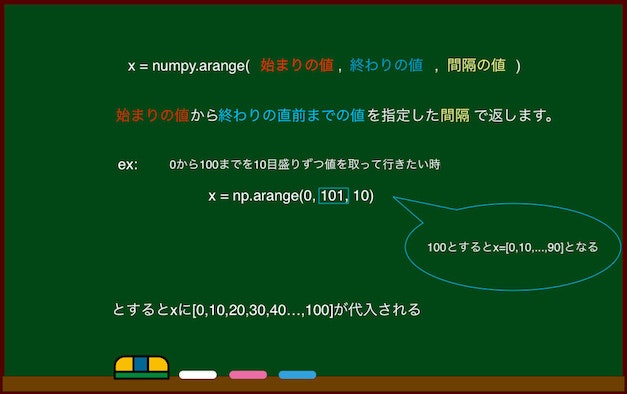
  1. numpy.arange()
    始まりから終わりの直前までの数値を指定した間隔 で返します。
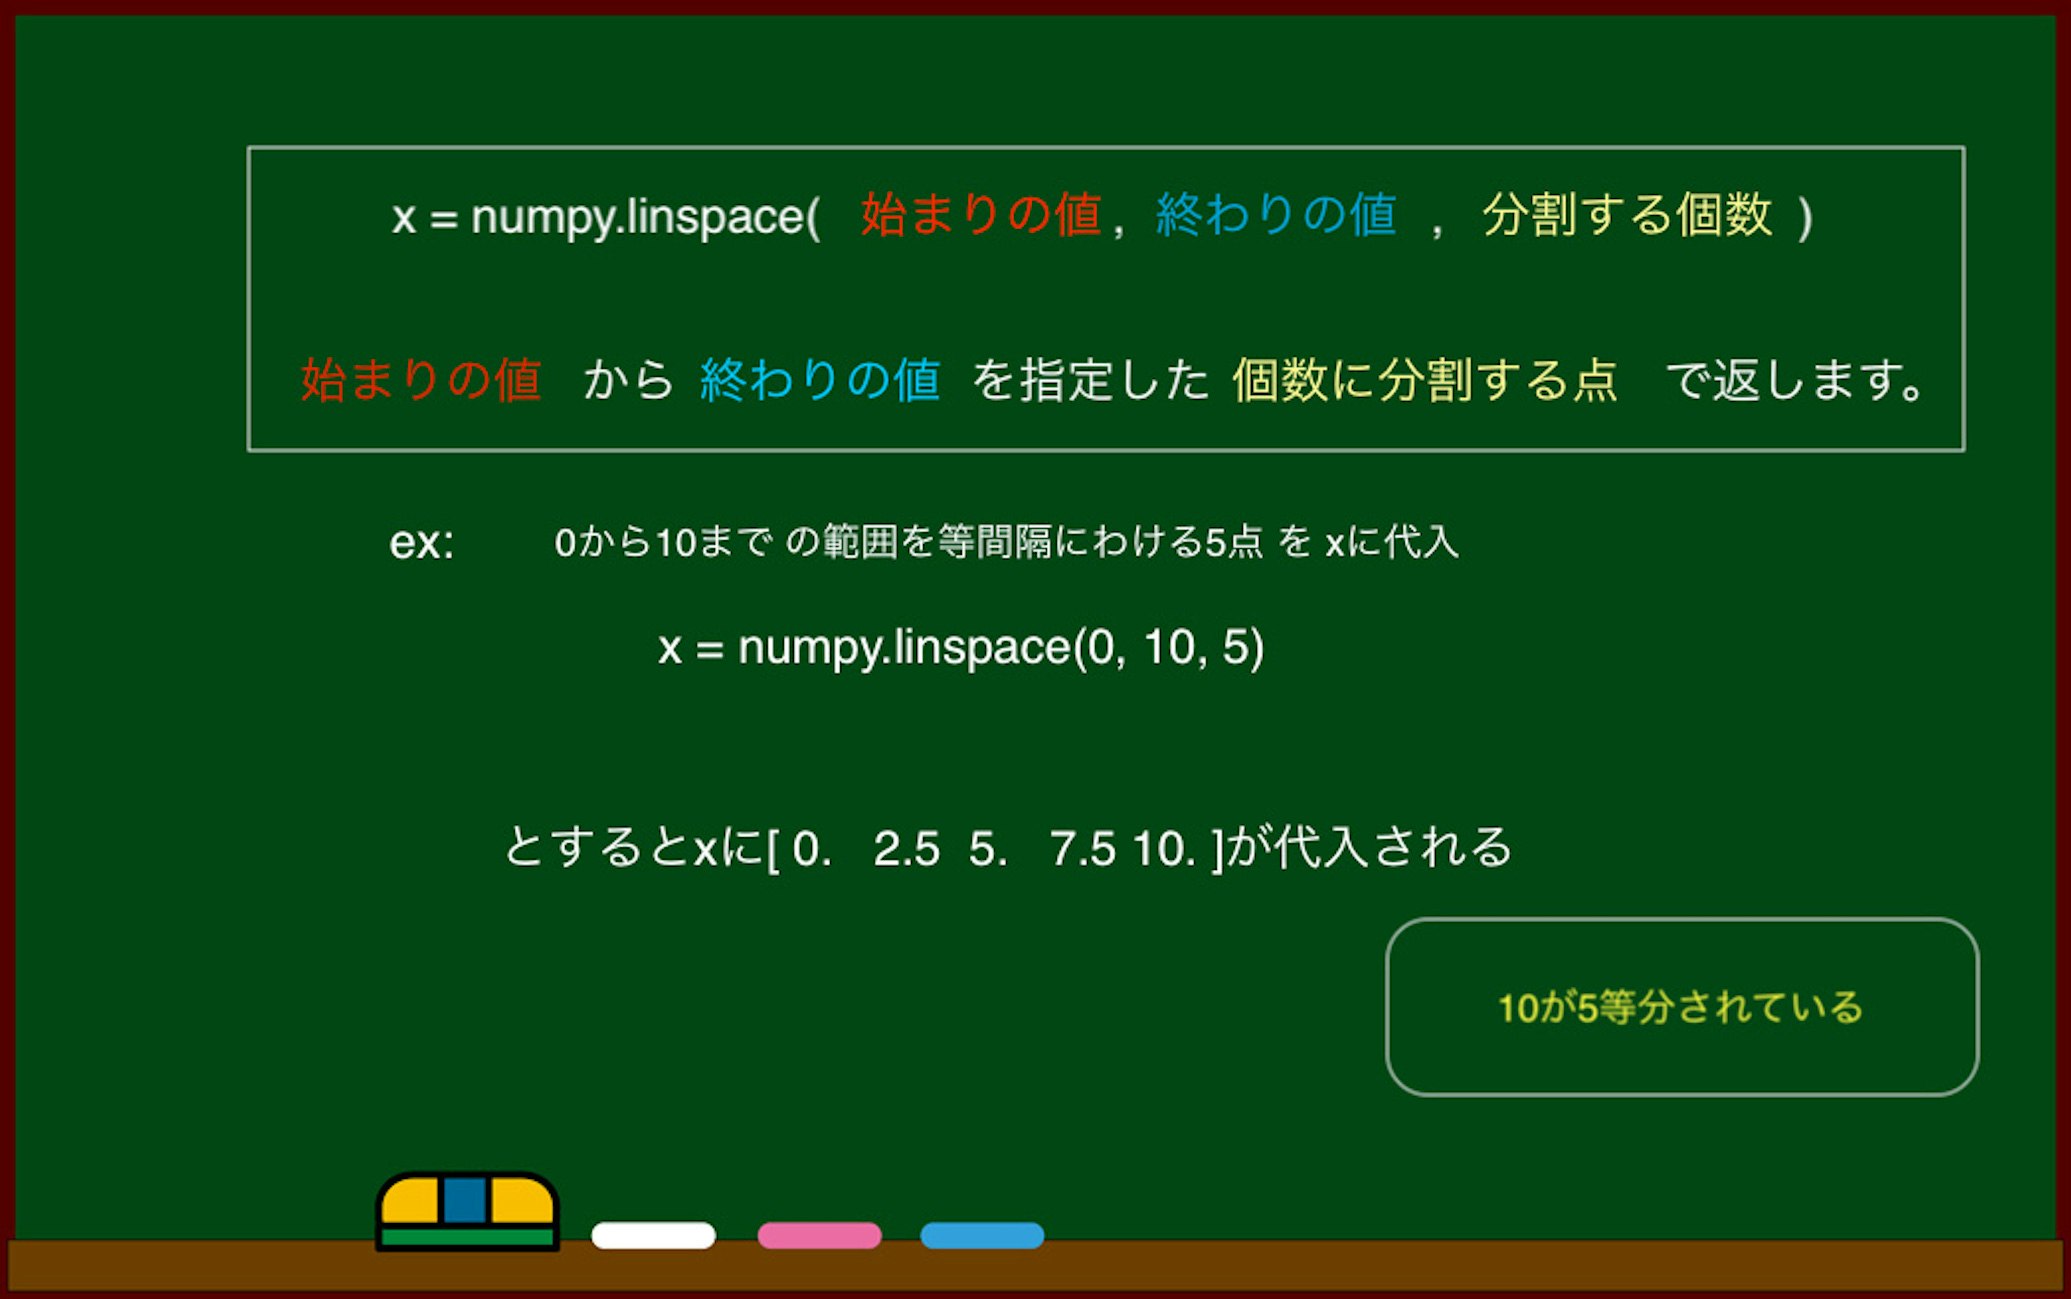
  2. numpy.linspace()
    に初め、終わり、分割したい個数の数値を渡すと、指定した個数に分割する点を返します。

#1. numpy.arange()
numpy.arange().jpg

各自print(x)でお好きな数字を表示させてみてください.

#2. numpy.linspace()

numpy.linspace.jpg

各自print(x)でお好きな数字を表示させてみてください.

#まとめ

  • numpy.arange()を使用する際は第2引数の直前の値までしか含まれないことを注意する.
  • numpy.linspace()は、第3引数を使用した際に等間隔に値を取れるので折れ線グラフを使用したいときなどに使える.
1
1
0

Register as a new user and use Qiita more conveniently

  1. You get articles that match your needs
  2. You can efficiently read back useful information
  3. You can use dark theme
What you can do with signing up
1
1

Delete article

Deleted articles cannot be recovered.

Draft of this article would be also deleted.

Are you sure you want to delete this article?