はじめに
Agent Development Kit (ADK) は、AIエージェントの開発と導入のためのフレームワークです。
さらに Built-in tools として、Google 検索や、エージェントに一般的な機能を提供するコードエグゼキューターなど、すぐに使える機能を提供しています。
その中に BigQuery との統合を提供することを目的としたツールが存在します。
今回は、その中にある ask_data_insights と forecast を試してみました!
ツール
ask_data_insights
自然言語を使用して、BigQuery テーブル内のデータに関する質問に回答することができるツールです。
このツールは Conversational Analytics API が基盤となっています。
Conversational Analytics API では、データ、グラフ、テキストの形式の回答を行うことができますが、ADK の ask_data_insights では、テキストの形式の回答のみサポートされています。
from google.adk.tools.bigquery.config import BigQueryToolConfig

bigquery_toolset = BigQueryToolset(
    tool_filter=["ask_data_insights"],
)
forecast
BigQuery ML時系列予測を実行することができるツールです。
AI.FORECAST 関数 が実行されます。
時系列予測モデルには、TimeFM モデル が使用されています。
from google.adk.tools.bigquery.config import BigQueryToolConfig

bigquery_toolset = BigQueryToolset(
    tool_filter=["forecast"],
)
TimeFM モデル
多くの実データセットから数十億のタイムポイントで事前にトレーニングされた時系列予測用の基盤モデルとなっています。
多くのドメインにわたる新しい予測データセットに適用することが可能になっています。
そのため、独自のモデルを作成してトレーニングすることなく予測を実行できるメリットがあります。
試してみた
ディレクトリ構成
.
├─ bq_agent/
|  ├─ .env
|  └─ agent.py
└─ requirements.txt
インストール
google-adk==1.19.0
matplotlib
pandas
uv を使用して環境を構築します。
uv init
uv add -r requirements.txt
BigQuery にデータを用意
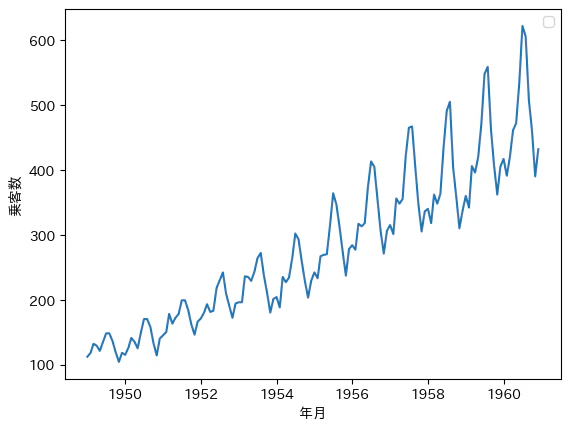
Python のライブラリ sktime に含まれているデータセットを使用します。
airline.Airline() データセットで、1949年から1960年までの国際航空旅客数の月別合計となっています。
pip install sktime
import pandas as pd
from sktime.datasets import load_airline

y = load_airline()
df = pd.DataFrame(y)
df.to_csv("bq_airline.csv")
作成された CSV ファイルを使用して、 BigQuery のテーブルを作成します。
ask_data_insights の検証
import google.auth
import google.auth.transport.requests
from google.adk.agents import Agent
from google.adk.tools.bigquery import BigQueryCredentialsConfig, BigQueryToolset
from google.adk.tools.bigquery.config import BigQueryToolConfig, WriteMode

# このサンプル エージェントの定数
AGENT_NAME = "bigquery_agent"
GEMINI_MODEL = "gemini-2.5-flash"


# 既存の認証設定
tool_config = BigQueryToolConfig(write_mode=WriteMode.BLOCKED)
application_default_credentials, _ = google.auth.default()
application_default_credentials.refresh(google.auth.transport.requests.Request())
credentials_config = BigQueryCredentialsConfig(
    credentials=application_default_credentials
)

# ask_data_insightsツールのみを含むBigQueryツールセット
bigquery_toolset = BigQueryToolset(
    credentials_config=credentials_config,
    bigquery_tool_config=tool_config,
    tool_filter=["ask_data_insights"],
)


# エージェントの定義
root_agent = Agent(
    model=GEMINI_MODEL,
    name=AGENT_NAME,
    description=(
        "BigQuery に保存された航空会社の時系列データに関する質問に答え、"
        "グラフを生成するエージェント"
    ),
    instruction="""\
        あなたは航空会社の時系列データのエージェントです。
        注意事項:
            - データ分析時は必ず生データ(テーブル形式)を返してください
            - 要約だけでなく、実際のPeriodとPassengersの値を含めてください

        分析を依頼された場合
        手順:
            1. ask_data_insights を使用して回答を得る

        利用可能なテーブルは -
		1. `{PROJECT}.{DATASET}.{TABLE}`

        カラム:
        - Period:日付
        - Passengers:乗客数
    """,
    tools=[bigquery_toolset],
)
「乗客数の平均値を教えて」と質問してみます。
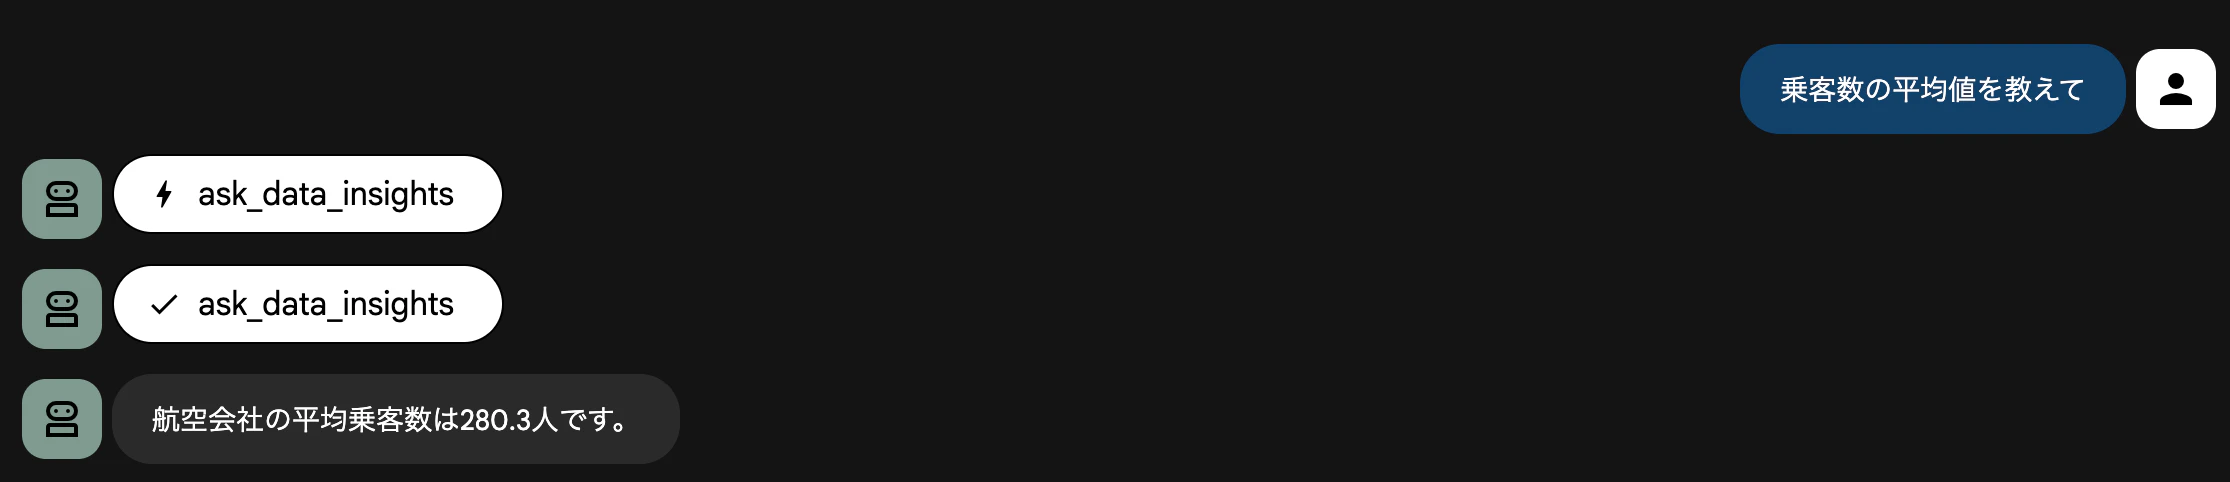
回答が「航空会社の平均乗客数は280.3人です。」と返ってきました。
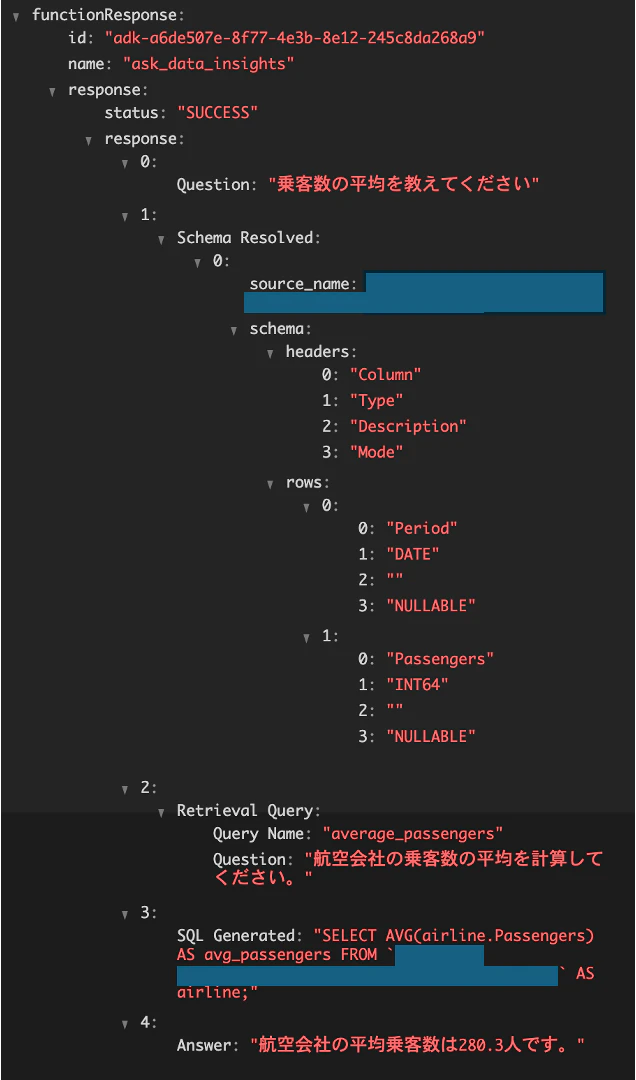
FunctionResponse の中身を確認してみます。
以下のような構成になっていて、実際に使用されたクエリを確認することもできます。
-
Question- ユーザーが入力した質問
-
Schema Resolved- データソースのスキーマ情報
-
Retrieval Query- Conversational Analytics API で使用された SQL を作成するための質問文
-
SQL Generated- 使用したクエリ
-
Answer- 回答結果
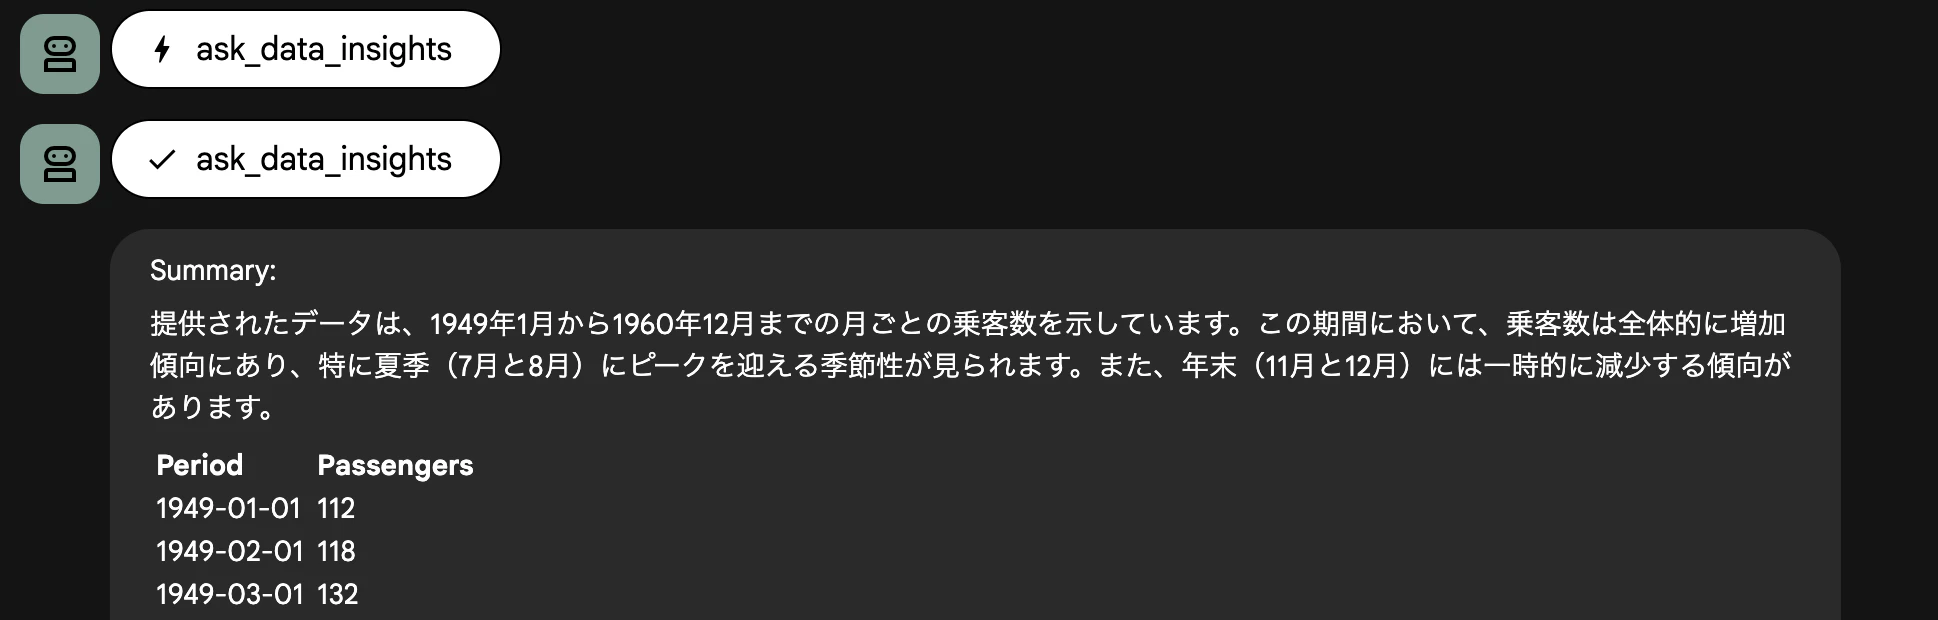
もう少し分析らしいことを依頼してます。
「乗客数の推移からわかることを教えて」と質問してみます。
分析結果として、データの傾向を教えてくれました!
forecast の検証
forecast のレスポンスには、数値データのみ返ってきます。
可視化するために graph_forecast_results の Callback を作成して、グラフを作成するようにしています。
import io
from typing import Dict, Any, Optional

import google.auth
import google.auth.transport.requests
import matplotlib.pyplot as plt
import pandas as pd
from google.adk.agents import Agent
from google.adk.tools.base_tool import BaseTool
from google.adk.tools.bigquery import BigQueryCredentialsConfig, BigQueryToolset
from google.adk.tools.bigquery.config import BigQueryToolConfig, WriteMode
from google.adk.tools.bigquery.query_tool import execute_sql
from google.adk.tools.tool_context import ToolContext
from google.genai import types


# エージェントの定数
AGENT_NAME = "bigquery_agent"
GEMINI_MODEL = "gemini-2.5-flash"


# 既存の認証設定
tool_config = BigQueryToolConfig(write_mode=WriteMode.BLOCKED)
application_default_credentials, _ = google.auth.default()
application_default_credentials.refresh(google.auth.transport.requests.Request())
credentials_config = BigQueryCredentialsConfig(
    credentials=application_default_credentials
)

# execute_sqlツールを含むBigQueryツールセット
bigquery_toolset = BigQueryToolset(
    credentials_config=credentials_config,
    bigquery_tool_config=tool_config,
    tool_filter=["forecast"],
)


def graph_forecast_results(
    tool: BaseTool,
    args: Dict[str, Any],
    tool_context: ToolContext,
    tool_response: Dict,
) -> Optional[Dict]:
    """forecastの結果をグラフ化するafter_tool_callback"""

    # forecastツール以外は処理しない
    if tool.name != "forecast":
        return None

    # クエリ結果が成功で、行データがある場合のみ処理
    if tool_response.get("status") != "SUCCESS" or not tool_response.get("rows"):
        return None

    try:
        # forecastツールの引数を取得
        history_data = args.get("history_data")
        timestamp_col = args.get("timestamp_col")
        data_col = args.get("data_col")

        if not all([history_data, timestamp_col, data_col]):
            print("グラフ生成エラー: forecastの引数が不足しています。")
            return None

        # SQLクエリの場合はグラフ生成をスキップ
        if history_data.strip().upper().startswith(("SELECT", "WITH")):
            print(
                "グラフ生成エラー: SQLクエリからのグラフ生成はサポートされていません。"
            )
            return None

        # forecast結果からデータ抽出
        rows = tool_response["rows"]
        timestamps = [row["forecast_timestamp"] for row in rows]
        forecast_values = [row["forecast_value"] for row in rows]

        # 信頼区間があれば取得
        lower_bounds = [row.get("prediction_interval_lower_bound") for row in rows]
        upper_bounds = [row.get("prediction_interval_upper_bound") for row in rows]

        # タイムスタンプのフォーマットに応じてSQLを調整
        forecast_start_timestamp = timestamps[0]

        try:
            pd.to_datetime(forecast_start_timestamp)
            timestamp_condition = f"TIMESTAMP('{forecast_start_timestamp}')"
        except (ValueError, TypeError):
            timestamp_condition = f"'{forecast_start_timestamp}'"

        # 列をTIMESTAMP型にキャストして比較
        query = f"""
            SELECT * FROM (
                SELECT {timestamp_col}, {data_col}
                FROM `{history_data}`
                WHERE CAST({timestamp_col} AS TIMESTAMP) < {timestamp_condition}
                ORDER BY {timestamp_col} DESC
                LIMIT 50
            )
            ORDER BY {timestamp_col} ASC
        """

        # execute_sqlを実行
        actual_result = execute_sql(
            project_id=args.get("project_id"),
            query=query,
            credentials=args.get("credentials"),
            settings=args.get("settings", BigQueryToolConfig()),
            tool_context=tool_context,
        )

        print(actual_result)

        # 結果をDataFrameに変換
        if actual_result.get("status") == "SUCCESS" and actual_result.get("rows"):
            actual_data = pd.DataFrame(actual_result["rows"])
        else:
            actual_data = pd.DataFrame()

        # グラフ作成
        plt.figure(figsize=(12, 6))
        # 実測値をプロット
        if not actual_data.empty:
            plt.plot(
                actual_data[timestamp_col],
                actual_data[data_col],
                marker=".",
                label="Actual",
                color="blue",
            )

        # 予測値をプロット
        plt.plot(
            timestamps,
            forecast_values,
            marker="o",
            label="Forecast",
            color="orange",
            linewidth=2,
        )

        # 信頼区間をプロット
        if all(lower_bounds) and all(upper_bounds):
            plt.fill_between(
                timestamps,
                lower_bounds,
                upper_bounds,
                color="orange",
                alpha=0.2,
                label="95% Confidence Interval",
            )

        plt.xlabel("Time")
        plt.ylabel("Forecast Value")
        plt.title("Time Series Forecast Results")
        plt.legend()
        plt.grid(True)
        plt.xticks(rotation=45)
        plt.tight_layout()

        # グラフをインメモリの画像として保存
        img_buffer = io.BytesIO()
        plt.savefig(img_buffer, format="png", dpi=150, bbox_inches="tight")
        img_buffer.seek(0)
        plt.close()

        # アーティファクトとして保存
        graph_part = types.Part(
            inline_data=types.Blob(mime_type="image/png", data=img_buffer.getvalue())
        )

        # 非同期でアーティファクトを保存
        import asyncio

        loop = asyncio.get_event_loop()
        loop.create_task(tool_context.save_artifact("forecast_graph.png", graph_part))

        # 結果にグラフ情報を追加
        modified_result = tool_response.copy()
        modified_result["graph_generated"] = True
        modified_result["graph_filename"] = "forecast_graph.png"

        return modified_result

    except Exception as e:
        print(f"グラフ生成エラー: {e}")
        return None


# エージェントの定義(カスタムツールを追加)
root_agent = Agent(
    model=GEMINI_MODEL,
    name=AGENT_NAME,
    description=(
        "BigQuery に保存された航空会社の時系列データに関する質問に答え、"
        "グラフを生成するエージェント"
    ),
    instruction="""\
        あなたは航空会社の時系列データのエージェントです。
        注意事項:
            - データ分析時は必ず生データ(テーブル形式)を返してください
            - 要約だけでなく、実際のPeriodとPassengersの値を含めてください

        予測を依頼された場合
        手順:
            1. forecast を使用して回答を得る

        利用可能なテーブルは -
		1. `{PROJECT}.{DATASET}.{TABLE}`

        カラム:
        - Period:日付
        - Passengers:乗客数
    """,
    tools=[bigquery_toolset],
    after_tool_callback=[graph_forecast_results],
)
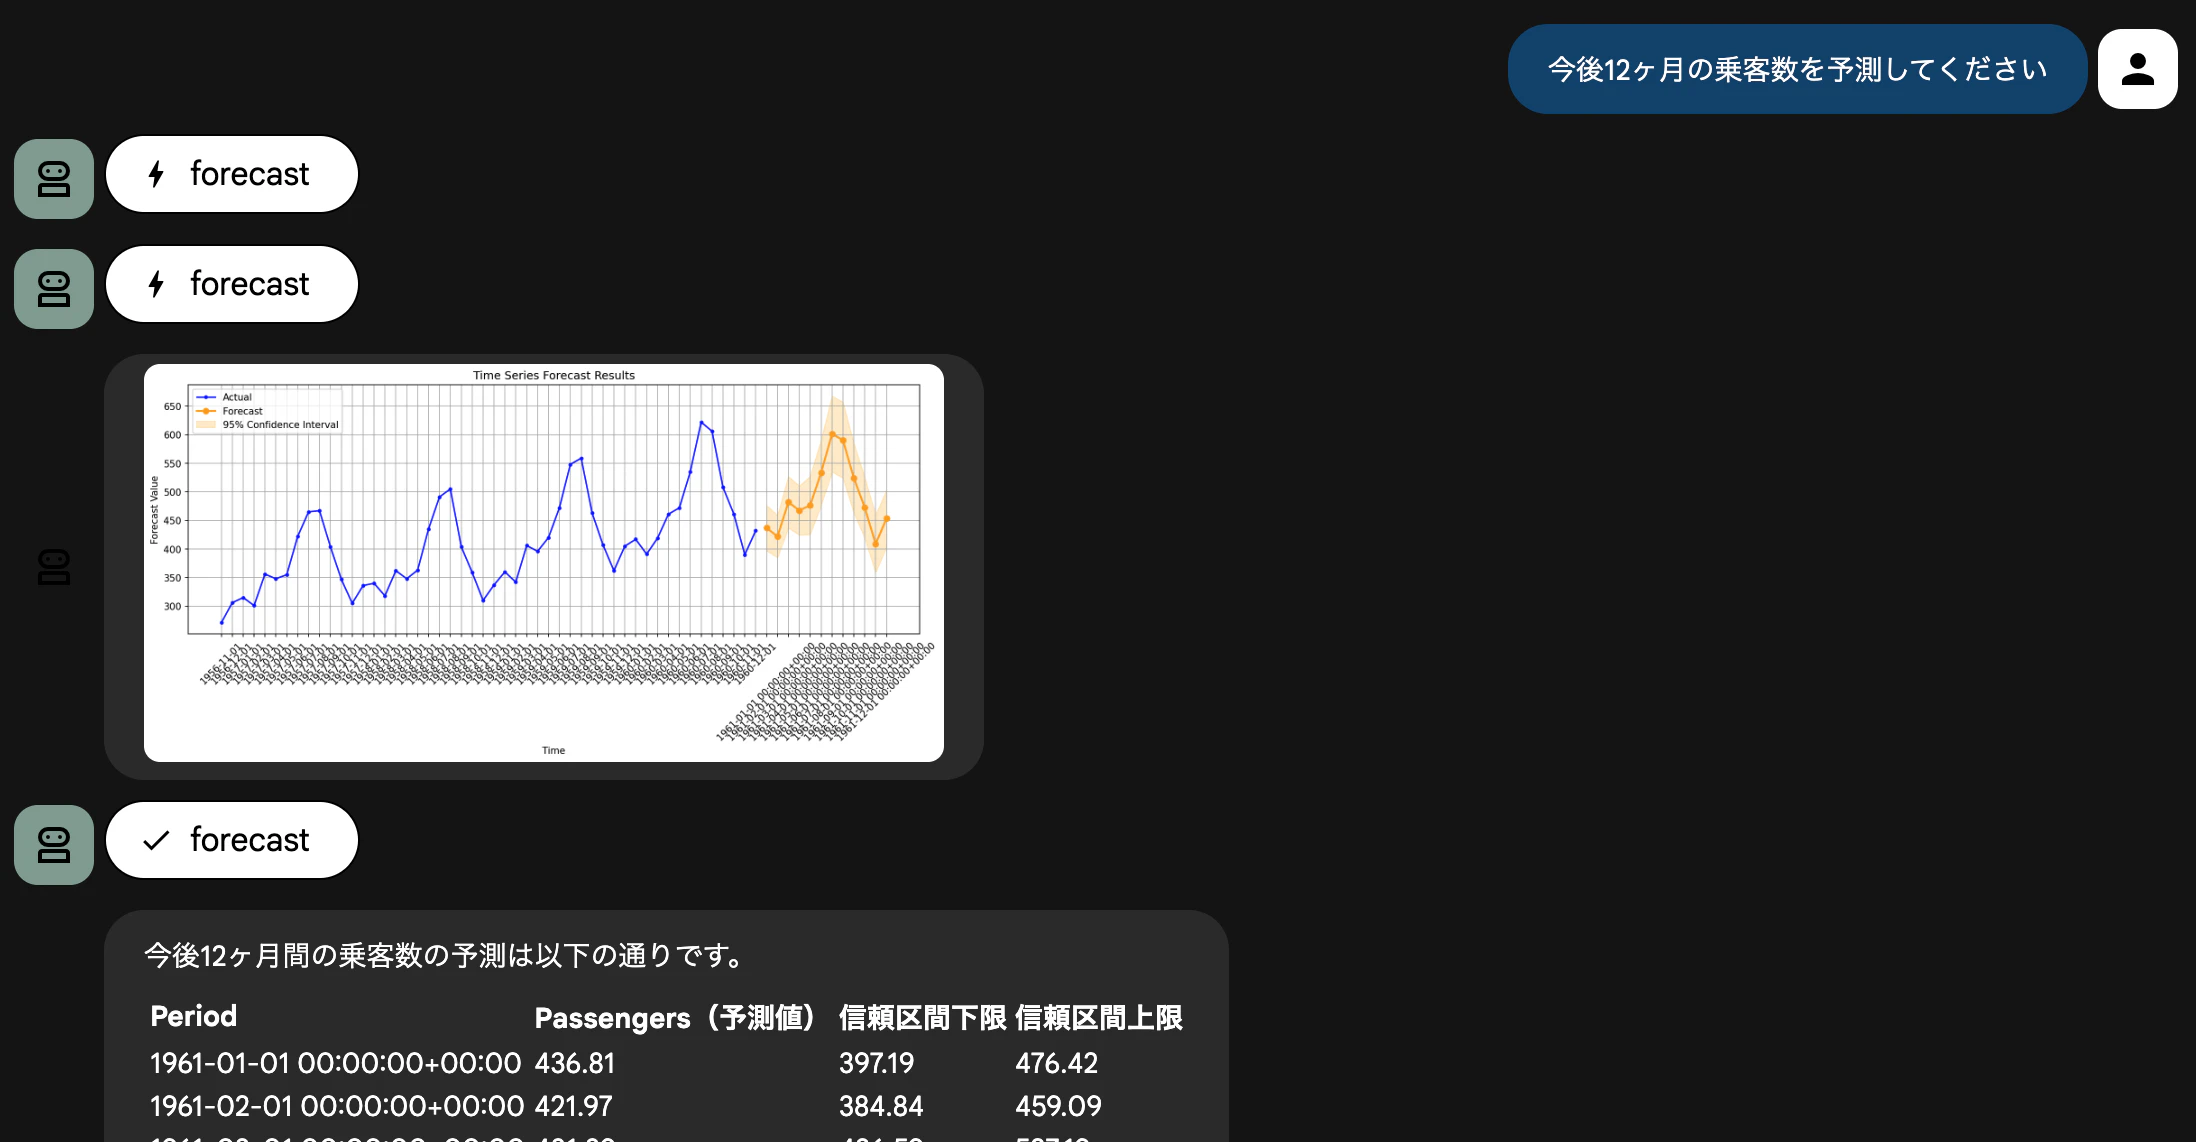
「今後12ヶ月の乗客数を予測してください」と質問してみます。
forecast が実行され、その予測結果を元にグラフが作成されていることが分かります。
信頼区間も含まれていて、95% の信頼度で設定されています。
まとめ
今回は、Agent Development Kit (ADK) の Built-in tools を活用して、BigQuery のデータに対する自然言語での分析と時系列予測を試してみました。
ask_data_insightsでは、スキーマ情報を意識せずとも、「平均を教えて」「推移から何がわかる?」といった自然言語だけでクエリ生成と分析が行えることを確認できました。
forecast では、自然言語を使用して自前でモデルを学習・チューニングすることなく、Google の基盤モデルを用いた高精度な予測がすぐに利用できました。
予測結果自体は数値データですが、ADK の Callback 機能を利用することで、可視化して返すといったカスタマイズも容易に実装可能です。
これまで「SQLを書く」「予測モデルを作る」という専門的なタスクが必要だった部分が、ADK を介することでエージェントと対話するだけで完結するようになりました。
今後は、複数のテーブルを結合して分析なども行えるか検証してみたいと思いました!