Webシステムを作る際、必需品となるグラフライブラリ。chart.js、jqplot、highchartsなどなど様々なものがありますが、この記事では百度(Baidu)のEChartsを紹介します。
ECharts
EChartsは、Baiduが提供しているHTML5/JavaScript製のオープンソース・ソフトウェア(MIT License)です。使ってて個人的に感じた特徴は、インタラクティブ性が非常に高いこと、ビッグデータ分析で利用できるチャートが豊富であること、ラベルのカスタマイズがしやすいことです。

使い方
GitHubにデモを上げてますので、見ながら進めたい人は参照して下さい。
まず、ライブラリの読み込みです。EChartsのDownloadページからダウンロードしてbuild/dist/echarts.jsを読み込むか、以下のコードで読み込んで下さい。
<script src="http://echarts.baidu.com/build/dist/echarts.js"></script>
本家ページに非常にたくさんのサンプルもあります(何に使うねんってやつもたくさんあります)。ここでは使用頻度の高そうなグラフをいくつか紹介します。
円グラフ
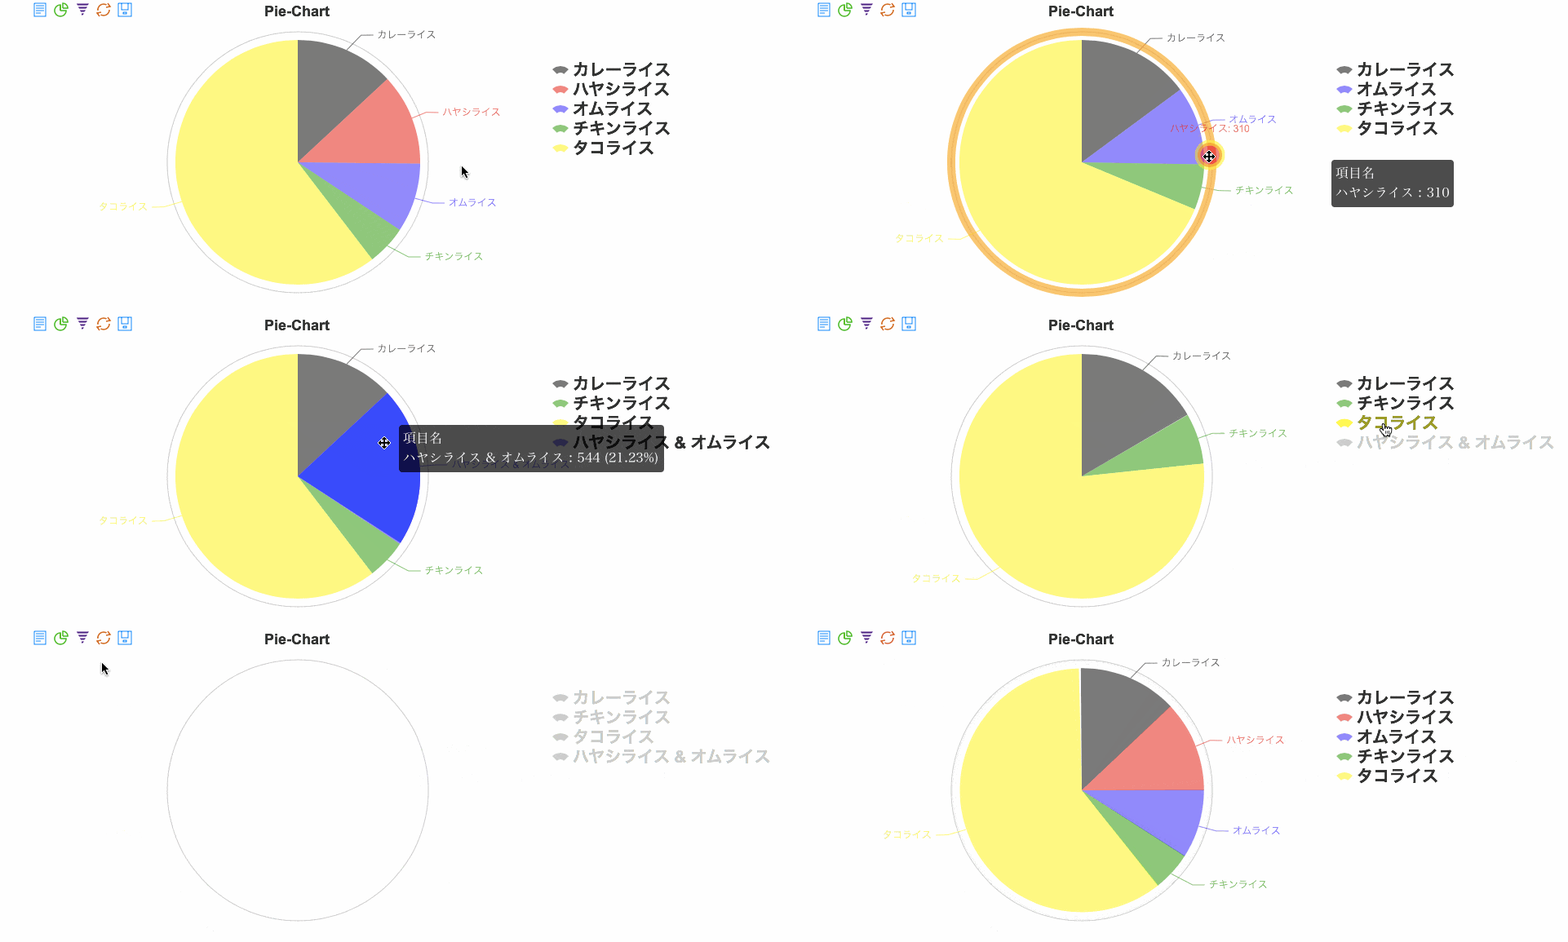
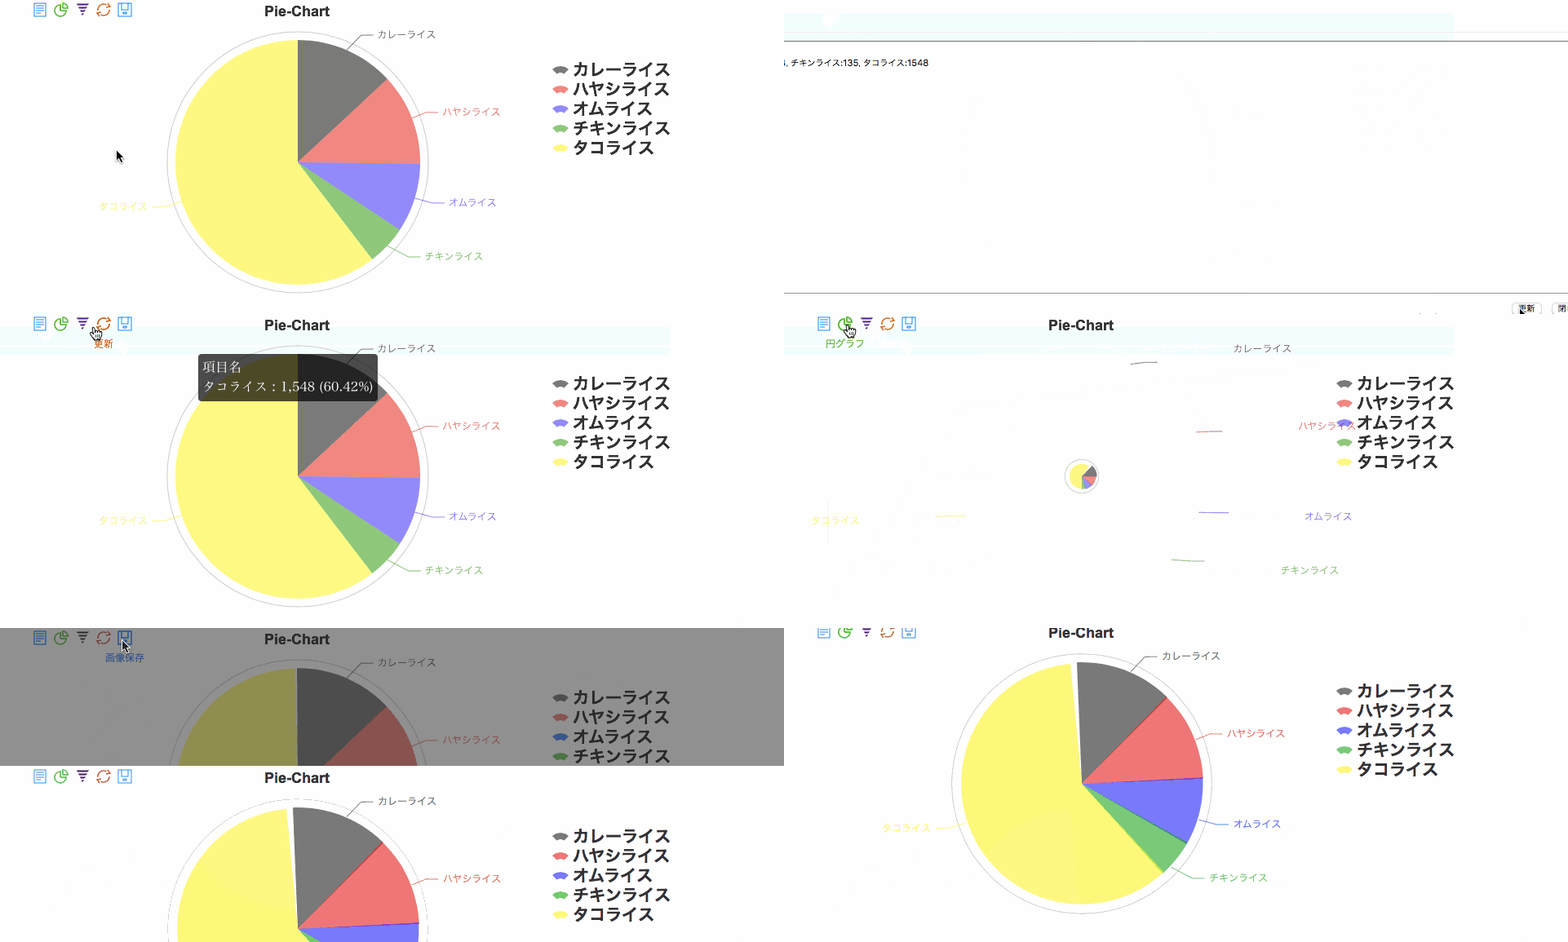
まず、どのようなグラフができるのかをお見せします。

こんなのことや・・・

こんなことまで・・・
しゅごい。
以下ソースコードです。
// モジュールローダの設定
require.config({
    paths: {
        echarts: 'http://echarts.baidu.com/build/dist'
    }
});

// 円グラフの描画
require(
  [
    'echarts',
    'echarts/chart/pie', // 円グラフの読み込み
    'echarts/chart/funnel' // toolbox内で切り替えるため読み込みます
  ],
  function (ec) {

    var pieChart = ec.init(document.getElementById('pie-chart')); // 表示する場所のID

    // オプションの設定
    var pieOption = {

      // グラフ要素の色(指定しなくても大丈夫です)
      color : ['rgba(0,0,0,0.52)','rgba(255,0,0,0.52)','rgba(0,0,255,0.52)','rgba(0,153,0,0.52)','rgba(255,255,0,0.52)'],

      // グラフタイトル
      title : {
        text: 'Pie-Chart',
        x:'center'
      },

      // カーソルを重ねた際の情報
      tooltip : {
        trigger: 'item',
        formatter: "{a} <br/>{b} : {c} ({d}%)"
      },

      // 凡例
      legend: {
        textStyle: {
          fontWeight: 'bolder',
          fontSize: 20,
        },
        orient : 'vertical',
        x : '75%',  // 位置を変更できます
        y : '20%',
        data: ['カレーライス','ハヤシライス','オムライス','チキンライス','タコライス']
      },

      // ツールボックス(他にも色々な機能がありますのでドキュメントを参照して下さい)
      toolbox: {
        show : true,
        x : 300,
        feature : {
          dataView : {
            show: true,
            title: 'データの表示',
            readOnly: false,
            lang: ['データの表示','閉じる','更新']
          },
          magicType : {
            show: true,
            title: {  // デフォルトだと中国語なので日本語を設定
              pie : '円グラフ',
              funnel: 'ファネルチャート'
            },
            type: ['pie', 'funnel'],
            option: {
              funnel: {
                  x: '25%',
                  width: '50%',
                  funnelAlign: 'left',
                  max: 1548
              }
            }
          },
          restore : {show: true, title: '更新'},
          saveAsImage : {show: true, title: '画像保存'}
        }
      },

      // インタラクティブな操作を有効にする
      calculable : true,

      // データ
      series : [
        {
          name:'項目名',
          type:'pie', //グラフ指定
          data:[
            {value:335, name:'カレーライス'},
            {value:310, name:'ハヤシライス'},
            {value:234, name:'オムライス'},
            {value:135, name:'チキンライス'},
            {value:1548, name:'タコライス'}
          ]
        }
      ]
    };
    // オプションをインスタンスに適用
    pieChart.setOption(pieOption);
  }
);
公式のドキュメントが分かりやすいので、参考にして下さい。
棒グラフ
棒グラフと折れ線グラフも色々動きますのでデモを触って見て下さい。

// 棒グラフの描画
require(
  [
    'echarts',
    'echarts/chart/bar', // 棒グラフの読み込み
    'echarts/chart/line' // toolbox内で切り替えるため読み込みます
  ],
  function (ec) {

    var barChart = ec.init(document.getElementById('bar-chart')); // 表示する場所のID

    // オプションの設定
    var barOption = {

      // グラフタイトル
      title : {
        text: 'Bar-Chart',
        x:'center'
      },

      // カーソルを重ねた際の情報
      tooltip : {
        trigger: 'axis',
      },

      // 凡例
      legend: {
        textStyle: {
          fontWeight: 'bolder',
          fontSize: 20,
        },
        orient : 'vertical',
        x : '75%',  // 位置を変更できます
        y : '20%',
        data:['降水量','湿度']
      },

      // ツールボックス(他にも色々な機能がありますのでドキュメントを参照して下さい)
      toolbox: {
        show : true,
        x : 300,
        feature : {
          dataView : {
            show: true,
            title: 'データの表示',
            readOnly: false,
            lang: ['データの表示','閉じる','更新']
          },
          magicType : {
            show: true,
            title: {  // デフォルトだと中国語なので日本語を設定
              bar : '棒グラフ',
              line : '折れ線グラフ'
            },
            type: ['bar', 'line'],
          },
          restore : {show: true, title: '更新'},
          saveAsImage : {show: true, title: '画像保存'}
        }
      },

      // インタラクティブな操作を有効にする
      calculable : true,

      // データ
      xAxis : [ // x軸
        {
          type : 'category',
          data : ['1月','2月','3月','4月','5月','6月','7月','8月','9月','10月','11月','12月']
        }
      ],
      yAxis : [ //y軸
        {
          type : 'value'
        }
      ],
      series : [
        {
          name:'湿度',
          type:'bar',
          data:[2.0, 4.9, 7.0, 23.2, 25.6, 76.7, 135.6, 162.2, 32.6, 20.0, 6.4, 3.3],
          markPoint : {
            data : [
              {type : 'max', name: '最大值'},
              {type : 'min', name: '最小值'}
            ]
          },
          markLine : {
            data : [
                {type : 'average', name: '平均值'}
            ]
          }
        },
        {
          name:'降水量',
          type:'bar',
          data:[2.6, 5.9, 9.0, 26.4, 28.7, 70.7, 175.6, 182.2, 48.7, 18.8, 6.0, 2.3],
          markPoint : {
            data : [
              {name : '年最高', value : 182.2, xAxis: 7, yAxis: 183, symbolSize:18},
              {name : '年最低', value : 2.3, xAxis: 11, yAxis: 3}
            ]
          },
          markLine : {
            data : [
              {type : 'average', name : '平均值'}
            ]
          }
        }
      ]
    };
    // オプションをインスタンスに適用
    barChart.setOption(barOption);
  }
);
折れ線グラフ
// 折れ線グラフの描画
require(
  [
    'echarts',
    'echarts/chart/line', // 折れ線グラフの読み込み
    'echarts/chart/bar' // toolbox内で切り替えるため読み込みます
  ],
  function (ec) {

    var lineChart = ec.init(document.getElementById('line-chart')); // 表示する場所のID

    // オプションの設定
    var lineOption = {

      // グラフタイトル
      title : {
        text: 'Line-Chart',
        x:'center'
      },

      // カーソルを重ねた際の情報
      tooltip : {
        trigger: 'axis',
      },

      // 凡例
      legend: {
        textStyle: {
          fontWeight: 'bolder',
          fontSize: 20,
        },
        orient : 'vertical',
        x : '75%',  // 位置を変更できます
        y : '20%',
        data:['最低気温','最高気温']
      },

      // ツールボックス(他にも色々な機能がありますのでドキュメントを参照して下さい)
      toolbox: {
        show : true,
        x : 300,
        feature : {
          dataView : {
            show: true,
            title: 'データの表示',
            readOnly: false,
            lang: ['データの表示','閉じる','更新']
          },
          magicType : {
            show: true,
            title: {  // デフォルトだと中国語なので日本語を設定
              line : '折れ線グラフ',
              bar : '棒グラフ'
            },
            type: ['bar', 'line'],
          },
          restore : {show: true, title: '更新'},
          saveAsImage : {show: true, title: '画像保存'}
        }
      },

      // インタラクティブな操作を有効にする
      calculable : true,

      // データ
      xAxis : [ // x軸
        {
          type : 'category',
          data : ['月','火','水','木','金','土','日']
        }
      ],
      yAxis : [ //y軸
        {
          type : 'value',
          axisLabel : {
            formatter: '{value} ℃'
          }
        }
      ],
      series : [
        {
          name:'最高気温',
          type:'line',
          data:[11, 11, 15, 13, 12, 13, 10],
          markPoint : {
            data : [
              {type : 'max', name: '最大值'},
              {type : 'min', name: '最小值'}
            ]
          },
          markLine : {
            data : [
                {type : 'average', name: '平均值'}
            ]
          }
        },
        {
          name:'最低気温',
          type:'line',
          data:[1, -2, 2, 5, 3, 2, 0],
          markPoint : {
            data : [
              {name : '周最低', value : -2, xAxis: 1, yAxis: -1.5}
            ]
          },
          markLine : {
            data : [
              {type : 'average', name : '平均值'}
            ]
          }
        }
      ]
    };
    // オプションをインスタンスに適用
    lineChart.setOption(lineOption);
  }
);
License
Copyright (c) 2013, Baidu Inc. All rights reserved.
Redistribution and use in source and binary forms, with or without modification, are permitted provided that the following conditions are met:
-
Redistributions of source code must retain the above copyright notice, this list of conditions and the following disclaimer.
-
Redistributions in binary form must reproduce the above copyright notice, this list of conditions and the following disclaimer in the documentation and/or other materials provided with the distribution.
THIS SOFTWARE IS PROVIDED BY THE COPYRIGHT HOLDERS AND CONTRIBUTORS "AS IS" AND ANY EXPRESS OR IMPLIED WARRANTIES, INCLUDING, BUT NOT LIMITED TO, THE IMPLIED WARRANTIES OF MERCHANTABILITY AND FITNESS FOR A PARTICULAR PURPOSE ARE DISCLAIMED. IN NO EVENT SHALL THE COPYRIGHT OWNER OR CONTRIBUTORS BE LIABLE FOR ANY DIRECT, INDIRECT, INCIDENTAL, SPECIAL, EXEMPLARY, OR CONSEQUENTIAL DAMAGES (INCLUDING, BUT NOT LIMITED TO, PROCUREMENT OF SUBSTITUTE GOODS OR SERVICES; LOSS OF USE, DATA, OR PROFITS; OR BUSINESS INTERRUPTION) HOWEVER CAUSED AND ON ANY THEORY OF LIABILITY, WHETHER IN CONTRACT, STRICT LIABILITY, OR TORT (INCLUDING NEGLIGENCE OR OTHERWISE) ARISING IN ANY WAY OUT OF THE USE OF THIS SOFTWARE, EVEN IF ADVISED OF THE POSSIBILITY OF SUCH DAMAGE.
