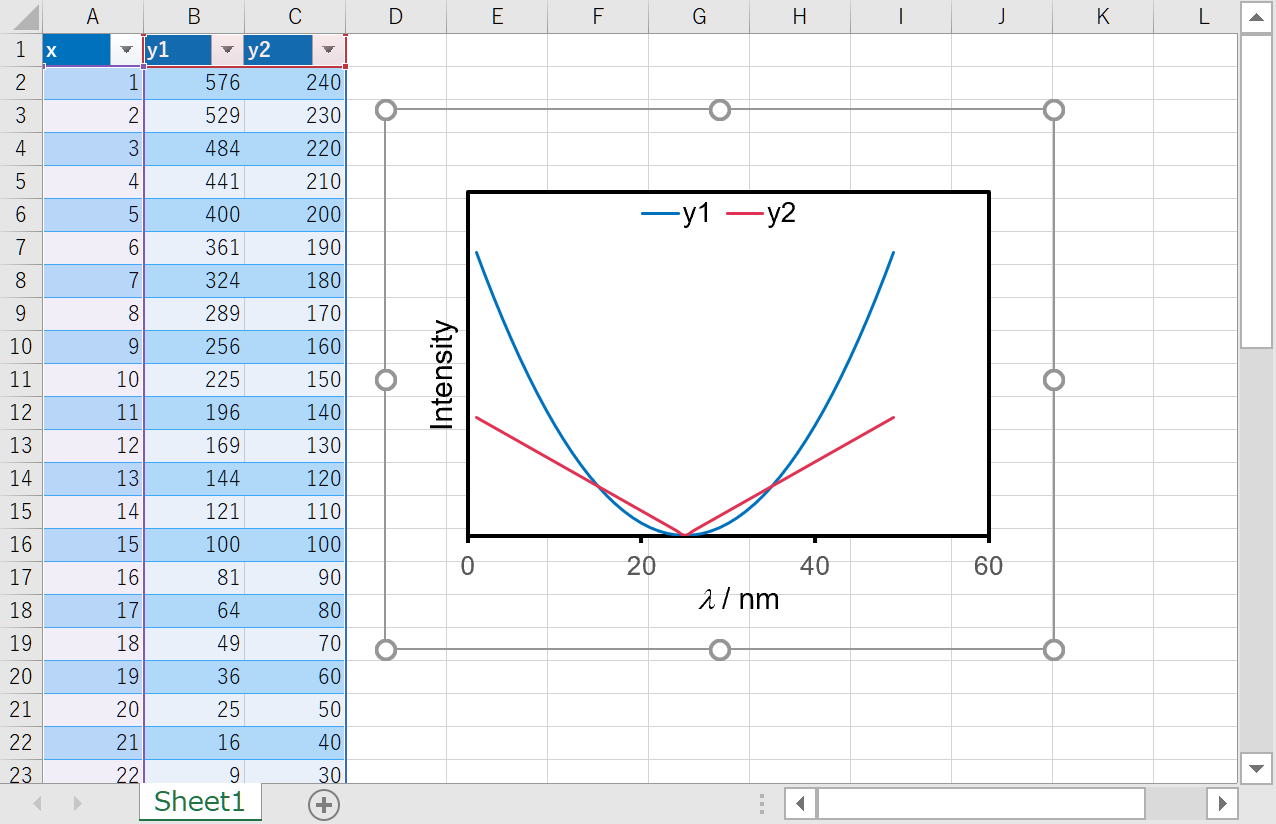
エクセルVBAを活用して誰でも簡単に思い通りのグラフを自動作成できるようになる記事です。
エクセルVBAの使い方は検索してください。
また、本記事の詳細はこちらの記事を参考にしてください。
VBAコード
時間がない人やとりあえず動けばいいという人は,以下のコードを貼り付けてグラフ化したい範囲を選択した状態で実行すればきれいなグラフが自動作成されます.横軸は波長(nm)、縦軸は強度がデフォルトになっています。
Option Explicit

Sub SimpleGraph_FL()
'--参考--'
    'https://qiita.com/mori_toma/items/8281596a2537fdc8cd56
    'https://www.muscle-hypertrophy.com/?p=7624#ChartFormat_TextFrame2

' ----- 図の作成 種類は右参照(デフォは平滑) https://docs.microsoft.com/ja-jp/office/vba/api/excel.xlcharttype -----'

    ActiveSheet.Shapes.AddChart2(240, xlXYScatterSmoothNoMarkers).Select


With ActiveChart

    ' 外枠と内枠の位置です
    ' 1pt = 0.35mm 100pt = 3.5cm
    ' 1 mm = 2.83pt 1cm =28.3pt
    .ChartArea.Height = 283
    .ChartArea.Width = 352
    .PlotArea.Height = 209
    .PlotArea.Width = 302
    .PlotArea.Top = 40
    .PlotArea.Left = 30

    ' 背景色です
        '透明にするならFalse
     .ChartArea.Format.Fill.Visible = False
'    .ChartArea.Format.Fill.ForeColor.RGB = RGB(255, 255, 255)
    .PlotArea.Format.Fill.ForeColor.RGB = RGB(255, 255, 255)

    ' 枠線
    .PlotArea.Format.Line.Style = msoLineSingle
    .PlotArea.Format.Line.Visible = True ' Falseで線なしになります
    .ChartArea.Format.Line.Visible = False ' Falseで線なしになります
    .PlotArea.Format.Line.Weight = 2
    .PlotArea.Format.Line.ForeColor.RGB = RGB(0, 0, 0)

    ' 目盛線(グリッド)
    .Axes(xlCategory).HasMajorGridlines = False
    .Axes(xlValue).HasMajorGridlines = False

    ' 目盛り xlTickMark*** : 末尾はInside, Outside, Cross, None
    .Axes(xlCategory).MajorTickMark = xlTickMarkOutside ' 横軸
    .Axes(xlValue).MajorTickMark = xlTickMarkNone ' 縦軸

    ' 横軸 線の太さと色
    .Axes(xlCategory).Format.Line.Weight = 2
    .Axes(xlCategory).Format.Line.ForeColor.RGB = RGB(0, 0, 0)

    ' 縦軸 線の太さと色
    .Axes(xlValue).Format.Line.Weight = 2
    .Axes(xlValue).Format.Line.ForeColor.RGB = RGB(0, 0, 0)

' ----- 横軸のスケール -----'
    ' 種類 xlTickLabelPosition*** : 末尾はNextToAxis, High, Low, None
    .Axes(xlCategory).TickLabelPosition = xlTickLabelPositionLow

    .Axes(xlCategory).TickLabels.Offset = 100 ' 軸からの距離 0~1000 [%]
    .Axes(xlCategory).TickLabels.Orientation = 0 ' スケールの向き -90~90 [degree]

'    .Axes(xlCategory).MinimumScale = 300 ' 最小値
'    .Axes(xlCategory).MaximumScale = 400 ' 最大値
'    .Axes(xlCategory).MajorUnit = 100  ' 刻み
    .Axes(xlCategory).TickLabels.NumberFormat = "0" ' 数値の表示形式  少数点以下の桁数を指定できます。

' ----- 縦軸のスケール -----'
    ' 種類 xlTickLabelPosition*** : 末尾はNextToAxis, High, Low, None
    .Axes(xlValue).TickLabelPosition = xlTickLabelPositionNone

    .Axes(xlValue).TickLabels.Offset = 100 ' 軸からの距離 0~1000 [%]
    .Axes(xlValue).TickLabels.Orientation = 0 ' スケールの向き -90~90 [degree]

    .Axes(xlValue).MinimumScale = 0 ' 最小値
'    .Axes(xlValue).MaximumScale = 1.7 * 100000 ' 最大値
'    .Axes(xlValue).MajorUnit = 0.2  ' 刻み
    .Axes(xlValue).TickLabels.NumberFormat = "0" ' 数値の表示形式 少数点以下の桁数を指定できます。

' ----- 軸の交点 ----- '
    .Axes(xlCategory).CrossesAt = 0 ' 横軸の交点
    .Axes(xlValue).CrossesAt = 0 ' 縦軸の交点

' ----- 軸の反転 ----- '
    .Axes(xlCategory).ReversePlotOrder = False ' 横軸
    .Axes(xlValue).ReversePlotOrder = False ' 縦軸

' ----- 対数軸 ----- '
' 対数にするときは以下4行を使ってください
'    .Axes(xlCategory).ScaleType = xlScaleLogarithmic ' 横軸
'    .Axes(xlValue).ScaleType = xlScaleLogarithmic ' 縦軸
'    .Axes(xlCategory).LogBase = 10 ' 対数の底 横軸
'    .Axes(xlValue).LogBase = 10 ' 対数の底 縦軸
' 線形に戻したいときは以下2行を使ってください
'    .Axes(xlCategory).ScaleType = xlScaleLinear ' 横軸
'    .Axes(xlValue).ScaleType = xlScaleLinear ' 縦軸
' ----- ----- ----- ----- '


' ----- タイトル ----- '
    .HasTitle = True
    .ChartTitle.Text = "Title"
    .ChartTitle.Top = 450
    .ChartTitle.Left = 270

' ----- 横軸の名前 -----'
    .Axes(xlCategory).HasTitle = True
    .Axes(xlCategory).AxisTitle.Text = "l / nm"
    .Axes(xlCategory).AxisTitle.Top = 245
    .Axes(xlCategory).AxisTitle.Left = 160

' ----- 縦軸の名前 -----'
    .Axes(xlValue).HasTitle = True
    .Axes(xlValue).AxisTitle.Text = "Intensity"
    .Axes(xlValue).AxisTitle.Top = 105
    .Axes(xlValue).AxisTitle.Left = 15

' ----- 凡例 ----- '
'デフォルトではマーカーのとこでオフにしています
    .HasLegend = True
'    .SeriesCollection(1).Name = "Sub.1"  ' 系列が複数あるときはコピペして(2), (3), (4)...を作ってください
    .Legend.Top = 40
    .Legend.Left = 125

' ----- フォントカラー----- '
    ActiveChart.Axes(xlValue).AxisTitle.Select
    With Selection.Format.TextFrame2.TextRange.Font.Fill
        .Visible = msoTrue
        .ForeColor.RGB = RGB(0, 0, 0)
        .Transparency = 0
        .Solid
    End With
    ActiveChart.Axes(xlCategory).AxisTitle.Select
    With Selection.Format.TextFrame2.TextRange.Font.Fill
        .Visible = msoTrue
        .ForeColor.RGB = RGB(0, 0, 0)
        .Transparency = 0
        .Solid
    End With
    '凡例のフォントカラー
    ActiveChart.Legend.Select
    With Selection.Format.TextFrame2.TextRange.Font.Fill
        .Visible = msoTrue
        .ForeColor.RGB = RGB(0, 0, 0)
        '.ForeColor.ObjectThemeColor = msoThemeColorAccent1
        .ForeColor.TintAndShade = 0
        .ForeColor.Brightness = 0
        .Transparency = 0
        .Solid
    End With
    '横軸目盛りフォントカラー  ←うまくいかないから 灰色のまま
'    ActiveChart.Axes(xlCategory).Select
'    With Selection.Format.TextFrame2.TextRange.Font.Fill
'        .Visible = msoTrue
'        .ForeColor.RGB = RGB(0, 0, 0)
'        .Transparency = 0
'        .Solid
'    End With


' ----- フォントとフォントサイズ ----- '
    .ChartTitle.Font.Name = "Arial" ' タイトルのフォント
    .ChartTitle.Font.Size = 15 ' タイトルのフォントサイズ
    .Axes(xlCategory).AxisTitle.Font.Name = "Arial" ' 横軸名のフォント
    .Axes(xlCategory).AxisTitle.Font.Size = 16 ' 横軸名のフォントサイズ
    .Axes(xlValue).AxisTitle.Font.Name = "Arial" ' 縦軸名のフォント
    .Axes(xlValue).AxisTitle.Font.Size = 16 ' 縦軸名のフォントサイズ
    .Axes(xlCategory).TickLabels.Font.Name = "Arial" ' 横軸スケールのフォント
    .Axes(xlCategory).TickLabels.Font.Size = 14 ' 横軸スケールのフォントサイズ
    .Axes(xlValue).TickLabels.Font.Name = "Arial" ' 縦軸スケールのフォント
    .Axes(xlValue).TickLabels.Font.Size = 14 ' 縦軸スケールのフォントサイズ|
    .Legend.Font.Name = "Arial" ' 凡例のフォント
    .Legend.Font.Size = 15 ' 凡例のフォントサイズ

    ' 太字が気になる場合はFalseにしてください。
    .Axes(xlCategory).AxisTitle.Font.Bold = False
    .Axes(xlValue).AxisTitle.Font.Bold = False


' ----- マーカー ----- '
'    .SeriesCollection(1).MarkerSize = 5 ' サイズ 2~72
'    .SeriesCollection(1).MarkerStyle = xlMarkerStyleCircle ' 形状
'    ' --------------------------------------------------------------- '
'    ' ----- .SeriesCollection(1).MarkerStyle = xlMarkerStyle*** ----------------- '
'    ' ----- 末尾の***はCircle, Dash, Diamond, Dot, Plus, Square, Star, Triangle, X --- '
'    ' ----- ただし、Dotはサイズを大きくできないかもしれません。---------------- '
'    ' --------------------------------------------------------------- '
'    .SeriesCollection(1).MarkerForegroundColor = RGB(0, 0, 0) ' マーカーの色
'    .SeriesCollection(1).MarkerBackgroundColor = RGB(0, 0, 0) ' マーカーの内側の色
'    .SeriesCollection(1).Format.Shadow.Style = msoShadowStyleInnerShadow '影を隠す
'    .SeriesCollection(1).Format.Shadow.Visible = False '影を消す

    .HasTitle = False ' タイトルなしにできます。
'    .Axes(xlCategory).HasTitle = False ' 横軸名なしにできます。
'    .Axes(xlValue).HasTitle = False ' 縦軸名なしにできます。

'    .HasLegend = False ' 凡例無しにできます。


End With

' ----- 横軸を一部イタリックにする ----- '
    ActiveChart.Axes(xlCategory).AxisTitle.Select
    With Selection.Format.TextFrame2.TextRange.Characters(1, 2).Font
        .NameComplexScript = "Symbol"
        .NameFarEast = "Symbol"
        .Name = "Symbol"
    End With
    Selection.Format.TextFrame2.TextRange.Characters(1, 2).Font.Italic = msoTrue

' ----- グラフオブジェクトをセルに合わせて移動やサイズ変更をしないように ----- '

  Dim cho As ChartObject
  For Each cho In ActiveSheet.ChartObjects
    cho.Placement = xlFreeFloating
  Next cho

End Sub
コード各部の説明についてはこちらの記事を参照してください.
使用してみた。
斜体する作業など面倒なので自動化できてよかったです。
是非参考にしてみてください。
しかし、どうしても横軸目盛りの文字色が変更できませんでした。すみません。

終わりに
今回は「エクセルで思い通りのグラフを自動作成」という記事を書きました.研究室でのグラフ作成作業は地道で大変だと思います。エクセルマクロを使うことで簡単にそして形式的にグラフを作成できる点は大きな利点だと思います.
私のブログではもっと詳細な情報や、化学系のグラフ作成方法など幅広く紹介しているので是非参考にしてみてください。
次回は論文用のグラフ作成に向けたマクロを紹介する予定です。
参考
https://qiita.com/mori_toma/items/8281596a2537fdc8cd56 理系が使ってもそれほど怒られないグラフをExcelで その3