Introduction
In my previous post, I integrated n8n as an MCP server into OpenClaw, building the foundation for workflow automation. At the end of that article, I wrote this under "Future Plans":
Security alert auto-triage: Sysdig alert → information gathering → severity assessment → notification
That's exactly what I tackled next. Having an AI running on a home Mac Mini handle 24/7 security monitoring.
Sysdig Secure was already detecting threats on my K8s cluster and posting alerts to Slack. But the problem was that even when alerts arrived, I still had to manually open the dashboard, review the details, assess severity, and figure out the response — all by hand. There's no way I could respond immediately to alerts that come in during work or at 3 AM.
The bottom line: By turning OpenClaw into an AI SOC analyst, I achieved a world where AI autonomously handles auto-triage, deep-dive investigation, Telegram notifications, and daily summary generation.
However, the journey was far from "just write a prompt." Eight rounds of requirements review, 61 issues found and fixed, and wrestling with the fundamental question of "how to design the division of labor between detection and analysis" — it was one unexpected drama after another.
Building an Enterprise SOC at Home
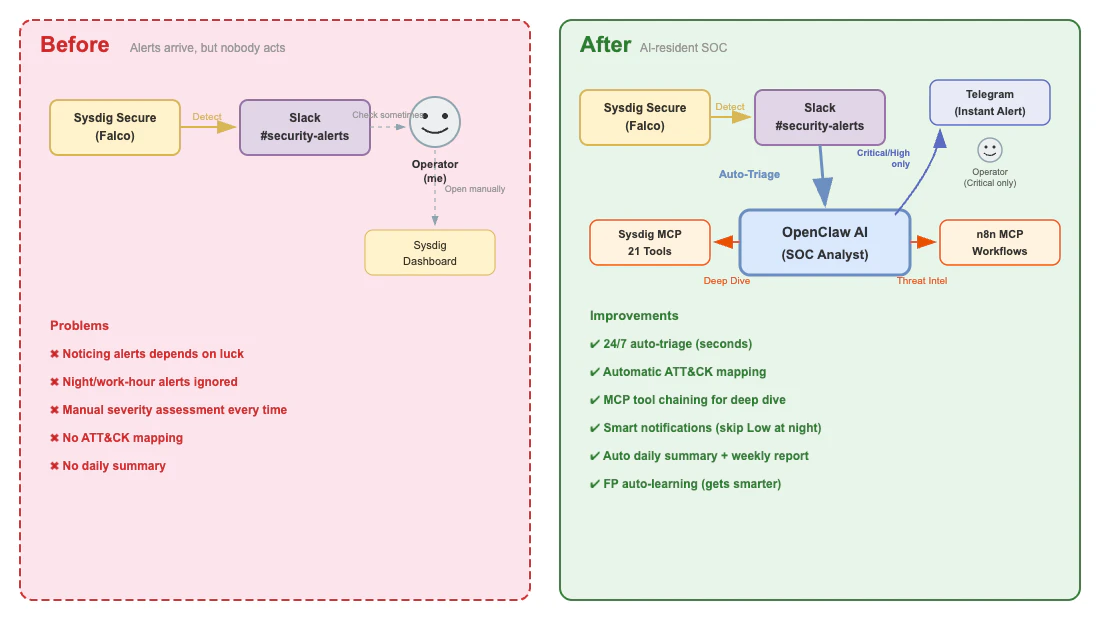
▲ Before and after SOC deployment: from manual response to AI-resident SOC
Before: A World Where Alerts Just Sit There
Here's how things used to work:
- Sysdig Secure detects an alert → posts to Slack
#security-alerts - I happen to notice "oh, there's an alert" whenever I check Slack
- Open the Sysdig dashboard to review the details
- Judge severity myself
- Alerts during late night or work hours? Left until the next day
Even in a home lab, running a 4-node K8s cluster generates a fair number of alerts. Falco-based detection rules catch things like /etc/shadow reads and suspicious process executions. But detection alone is meaningless. Without the "analyze → decide → respond" cycle after detection, you can't call it a SOC.
After: A World with AI-Resident SOC
Here's what it looks like now:
24/7 Auto-Triage: The moment an alert arrives, AI posts triage results in the thread — severity, MITRE ATT&CK technique IDs, impact scope, and recommended initial response in a structured report.
Automated Deep-Dive Investigation: Critical/High alerts automatically proceed to 2-phase investigation using Sysdig MCP (information gathering → Diamond Model hypothesis verification).
Smart Notifications: No more being woken up by Low alerts at midnight. Only Critical/High alerts trigger immediate Telegram notifications.
Daily Summary: Every morning at 8 AM, I receive the previous day's alert statistics, K8s health status, and trend analysis via Telegram.
Mapping to Enterprise SOC
What's interesting is how the enterprise SOC tool stack maps directly to a home lab.
| Enterprise SOC | Home Lab SOC | Role |
|---|---|---|
| SIEM | Slack logs | Log aggregation & search |
| CNAPP/CWPP | Sysdig Secure | Runtime detection & cloud workload protection |
| SOAR | n8n workflows | Automated response & orchestration |
| AI Analyst | OpenClaw (Claude Opus) | AI-powered triage & analysis |
| Ticket Management | Slack threads + GitHub Issues | Incident tracking |
| Notification | Telegram + Slack | Alert notification |
| TIP | n8n + Web search | Threat intelligence |
Enterprise SOCs typically use a 3-tier model (Tier 1 Triage → Tier 2 Analysis → Tier 3 Hunting), but for the home lab, I compressed it to 2 tiers:
- AI Tier (OpenClaw): Automated Tier 1 triage + Tier 2 deep-dive investigation
- Human Tier (me): Tier 3 threat hunting + final decisions
Six handoff points (HP-1 through HP-6) clearly define the boundary between AI and human, with a safety design where destructive operations (Pod deletion, credential rotation, node restart) always require human approval.
Design Process: Reviewing the Requirements Spec 10 Times
Why Start with Requirements?
From the previous n8n integration (27 tasks, completed in one day), I learned that "defining requirements thoroughly upfront makes implementation go smoothly." SOC operations are far more complex than n8n. 12 playbooks, 18 ATT&CK techniques, 9 metrics, 14 E2E tests — implementing these ad hoc would be reckless.
So I started by thoroughly improving the quality of the requirements specification without touching implementation at all.
61 Issues Found in 10 Reviews
The requirements spec evolved from v1.0 to v1.9, with 8 rounds of review that found and fixed a total of 61 issues.
| Review | Target Version | Issues Found | Critical | High | Medium |
|---|---|---|---|---|---|
| REV1 | v1.0 | 18 | 1 | 5 | 6 |
| REV2 | v1.2 | 15 | 1 | 3 | 5 |
| REV3 | v1.3 + Task Def v1.0 | 18 | 1 | 5 | 6 |
| REV4 | v1.4 + Task Def v1.1 | 12 | 0 | 2 | 5 |
| REV5-8 | v1.5-v1.8 | — | — | — | — |
Quality visibly improved with each review:
| Metric | v1.0 (Initial) | v1.9 (Final) |
|---|---|---|
| Glossary | 20 terms | 43 terms |
| Playbooks | 4 (overview only) | 12 (all with detailed steps) |
| ATT&CK Coverage | 15 techniques | 18 techniques |
| NIST CSF Coverage | Detect/Respond only | All 6 functions |
| F3EAD Coverage | None | All 6 phases |
| IOC/IOA Classification | None | 4 categories + Pyramid of Pain |
| Correlation Analysis | None | 4 types (with time window parameters) |
The most memorable finding was REV1's Critical issue: MITRE ATT&CK sub-technique IDs T1543.005 and T1552.007 don't exist in the official matrix. We had force-mapped container-specific detection patterns to ATT&CK using non-existent IDs. Resolved by marking them as custom mappings (*), but without review, incorrect ATT&CK IDs would have gone into production.
Adopted Frameworks
The following frameworks were adopted for SOC operations design:
| Framework | Purpose | Application |
|---|---|---|
| NIST CSF 2.0 | Overall SOC governance frame | Architecture design (6-function mapping) |
| MITRE ATT&CK for Containers | Threat classification & detection rule design | Triage ATT&CK mapping |
| F3EAD | Intelligence operations cycle | Detect→Triage→Respond→Improve cycle |
| Diamond Model | Deep-dive hypothesis verification | 4-hypothesis analysis for Critical/High alerts |
| Cyber Kill Chain | Attack stage analysis | Kill chain-based correlation analysis |
| PEAK | Threat hunting | Human-driven proactive investigation |
Architecture
Component Overview
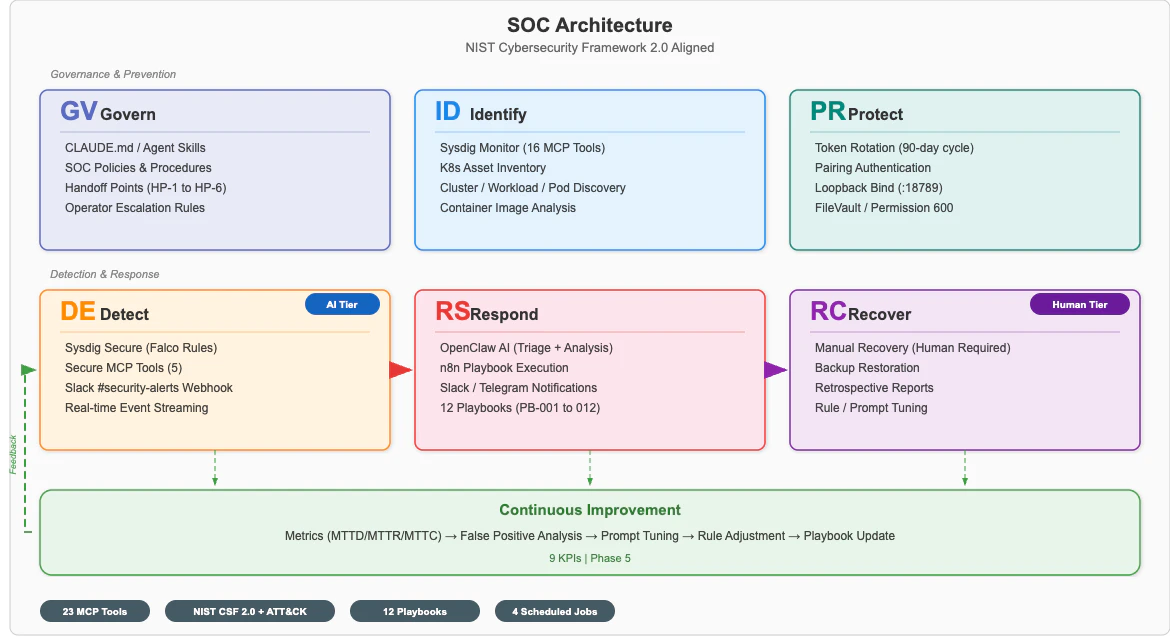
▲ Home Lab SOC Architecture — mapped to NIST CSF 2.0's 6 functions
The system consists of 3 main components:
- Sysdig Secure (SaaS): Falco-based runtime detection on K8s cluster. 21 MCP tools for OpenClaw integration
- OpenClaw Gateway (Mac Mini): AI SOC analyst. Uses Sysdig MCP + n8n MCP for triage and investigation
- n8n (Docker): Workflow automation. Provides web page fetching (for threat intelligence) as MCP tools
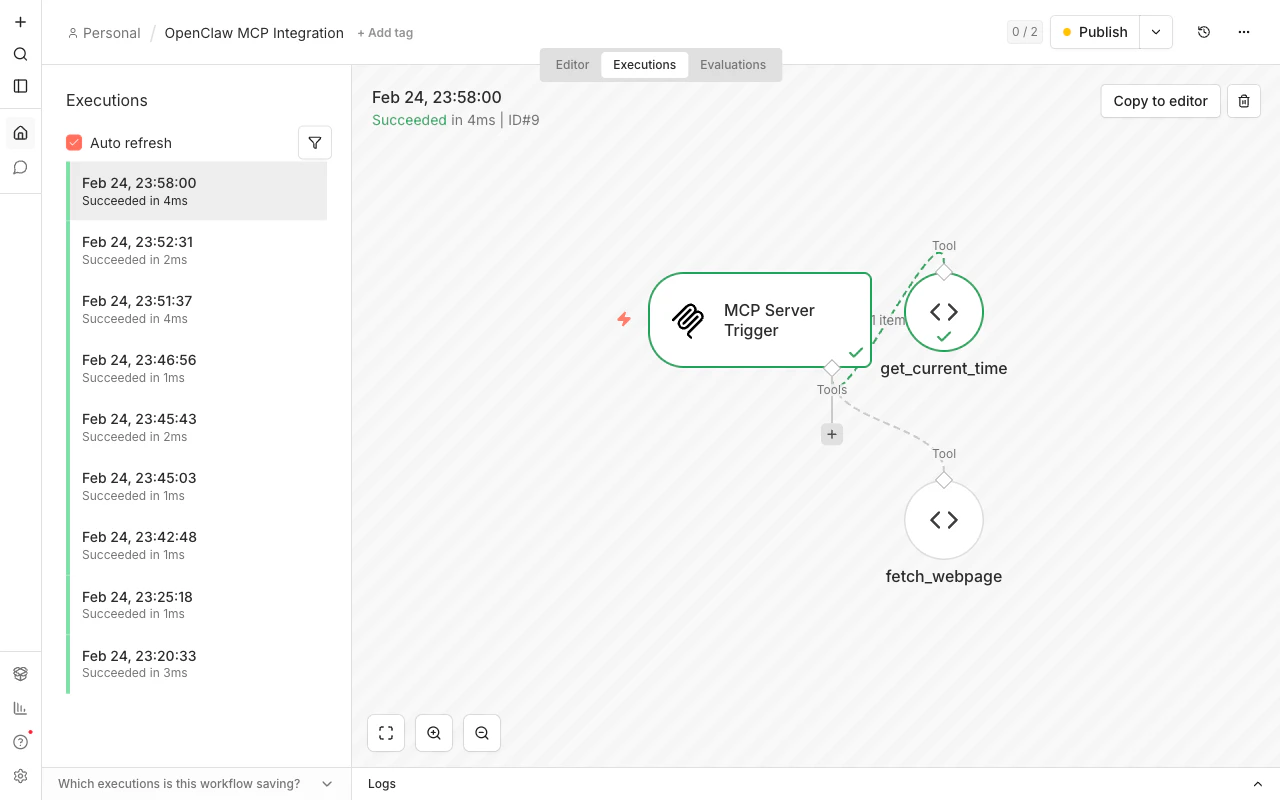
▲ n8n execution history: MCP Server Trigger → get_current_time / fetch_webpage. All executions succeed in milliseconds
Alert Lifecycle
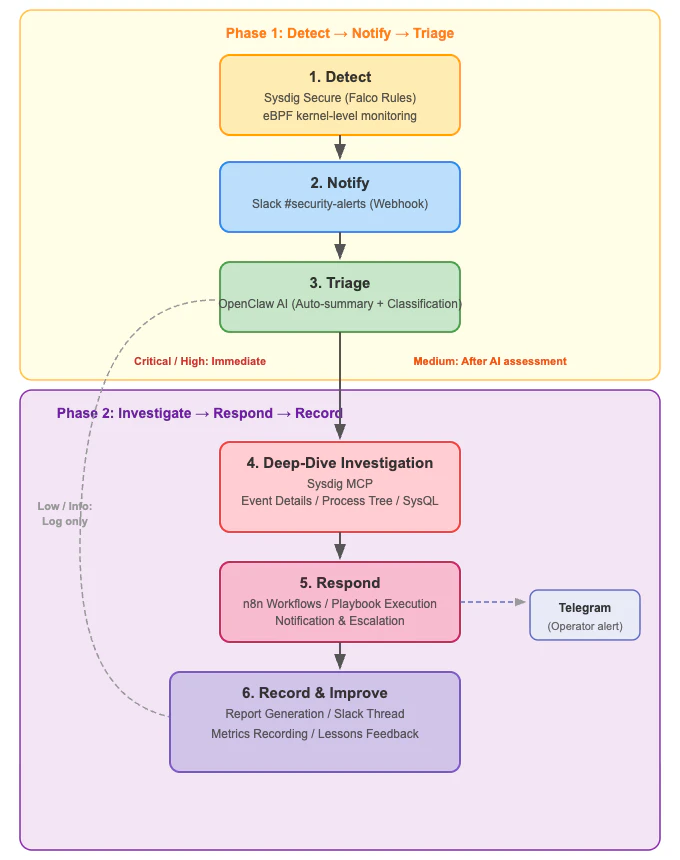
▲ Alert's 6-stage lifecycle: Detect→Notify→Triage→Investigate→Respond→Record
Alerts are processed in 2 phases:
Phase 1 (Detection→Triage):
- Sysdig Secure detects runtime events via Falco rules
- Posts to Slack
#security-alertsvia webhook - OpenClaw AI automatically posts triage results in the thread
Phase 2 (Investigation→Record):
4. Critical/High alerts get automated deep-dive investigation via Sysdig MCP
5. Diamond Model 4-hypothesis verification (normal operation / privilege escalation / external intrusion / automation anomaly)
6. Incident report generation → recorded in Slack thread + GitHub Issue
MCP Tool Landscape
The most distinctive aspect of this project is fully mapping 52 MCP tools to SOC functions.
| MCP Server | Tool Count | Primary Use |
|---|---|---|
| Sysdig | 21 | Event search, process trees, SysQL queries, K8s state monitoring |
| Serena | 27 | Codebase analysis, symbol search (dev support outside SOC) |
| drawio | 3 | Diagram generation |
| n8n | 1 | Web page fetching (for threat intelligence) |
Sysdig's 21 tools map to SOC functions as follows:
Detection:  sysdig_list_runtime_events, sysdig_get_event_info
Investigation:  sysdig_get_event_process_tree, sysdig_run_sysql, sysdig_generate_sysql
K8s Monitoring: sysdig_k8s_list_nodes, sysdig_k8s_list_workloads, sysdig_k8s_list_pod_containers
Resources: sysdig_k8s_list_top_cpu_consumed_*, sysdig_k8s_list_top_memory_consumed_*
Fault Detection: sysdig_k8s_list_top_restarted_pods, sysdig_k8s_list_top_unavailable_pods
"The Prompt Is the Product" — Designing AGENTS.md
The Deliverable Is a Prompt, Not Code
The most important realization from this project: the deliverable is a prompt, not code.
| Aspect | Previous (n8n MCP Integration) | This Project (SOC Operations) |
|---|---|---|
| Primary deliverable | Docker container, config files | AGENTS.md (prompt) |
| Testing method | Tool call success/failure | AI output quality evaluation |
| Completion criteria | Technically functional | Operational quality meets targets |
| Iteration | Build once, done | Continuous improvement required |
AGENTS.md defines OpenClaw's "personality." It specifies all SOC analyst behaviors — severity judgment criteria, ATT&CK mapping rules, triage output format, escalation conditions.
AGENTS.md Structure
Here are the key sections of the compressed AGENTS.md (336 lines, 11,052 characters):
Severity Table: Rules for converting Sysdig alert severity to 4 SOC levels.
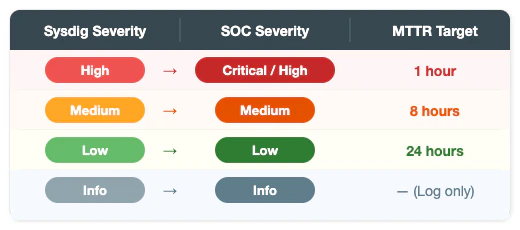
▲ Mapping Sysdig alert severity to 4 SOC levels, with MTTR targets for response speed management
Since Sysdig's highest severity is High, alerts without explicit severity (like Runtime Event or Notable Events) are treated as High = Critical/High, making them the top priority.
Triage Output Format: Template for AI-generated triage results posted in threads.
1. Header (Severity / ATT&CK Txxxx / Impact Scope)
2. Summary (1-2 sentence summary)
3. Detection Rule (Sysdig rule name + conditions)
4. Impact Assessment (Business impact + urgency)
5. Recommended Initial Response (3-item checklist)
6. Additional Investigation (Sysdig MCP deep-dive suggestions)
7. Attack Indicators (IOC/IOA classification + Pyramid of Pain level)
ATT&CK Mapping Guide: A correspondence table of 18 techniques and detection patterns. AI references this table to assign appropriate technique IDs to each alert.
T1059  Command Interpreter          ← sh/bash execution
T1609  Container Administration Command  ← kubectl exec
T1611  Escape to Host               ← /proc/1/root, nsenter
T1496  Resource Hijacking           ← CPU anomaly + Stratum protocol
T1552  Unsecured Credentials        ← /etc/shadow, ServiceAccount Token
...(18 techniques total)
Deep-Dive Investigation Workflow: 2-phase investigation automatically executed for Critical/High alerts.
Phase 1: Information Gathering (6 MCP tool chain)
  sysdig_get_event_info → sysdig_get_event_process_tree
  → sysdig_run_sysql (same Pod 1h) → sysdig_k8s_list_workloads
  → sysdig_k8s_list_pod_containers → CPU/Memory analysis

Phase 2: Diamond Model Hypothesis Verification
  H1: Normal operation  H2: Privilege escalation  H3: External intrusion  H4: Automation anomaly
  Each hypothesis analyzed on Adversary/Infrastructure/Capability/Victim axes
Self-Evolving Prompt: Notably, AGENTS.md has a "false positive pattern list" directly embedded. When an operator replies "FP" to an alert thread, the AI extracts the pattern and automatically adds it to the list. A system that gets smarter with use.

Why "Sysdig for Detection, AI for Analysis"?
"If AI is so smart, why not have it do detection too?" — a fair question. But detection and analysis require fundamentally different capabilities.
What detection requires: Sysdig Secure monitors kernel-level system calls (process execution, file access, network communication) in real-time via eBPF. The moment a Falco rule matches, an alert fires — millisecond responsiveness with deterministic reproducibility where the same input always produces the same result.
What analysis requires: "Is this alert really dangerous?" "Are multiple alerts related?" "Looking at the entire command chain, what combination of attack techniques is this?" — contextual judgment like this is exactly where AI excels.
| Capability | Sysdig (Falco/eBPF) | AI (OpenClaw) |
|---|---|---|
| Real-time Detection | ◎ Kernel-level, milliseconds | ✕ API polling causes delay |
| Deterministic Judgment | ◎ Same input → always same result | △ Slightly different each generation |
| Context Analysis | ✕ Rule matching only | ◎ Considers entire environment |
| ATT&CK Mapping | △ Static tags pre-defined per rule | ◎ Dynamically identified from execution context |
| Attack Chain Inference | ✕ | ◎ Temporal and spatial correlation analysis |
| Natural Language Reports | ✕ | ◎ Structured triage reports |
In other words, Sysdig captures "what happened" in real-time, and AI determines "what it means" — this division of labor is the design principle of AI SOC.
This separation also has operational benefits:
- Fault tolerance: Detection doesn't stop even if AI goes down. Alerts keep arriving in Slack
- Cost efficiency: Feeding all system calls to AI is unrealistic. Filter with detection, then pass to AI
- Auditability: Detection rules are deterministic and reproducible. "Why did this alert fire?" can be verified later
💡 Implementation Tip:
AGENTS.mdhas a 20,000-character limit, so we separated it into the operational rules core (11,052 chars) and a detailed procedures referenceSOC-REFERENCE.md(25,717 chars). The same "module separation" thinking from code applies to prompt design.
Real-World Operations: What Is the AI Actually Doing?
From here, let's look at concrete outputs from the running SOC. Design talk alone leaves the question "does it really work?" unanswered, so let me show you real triage results.
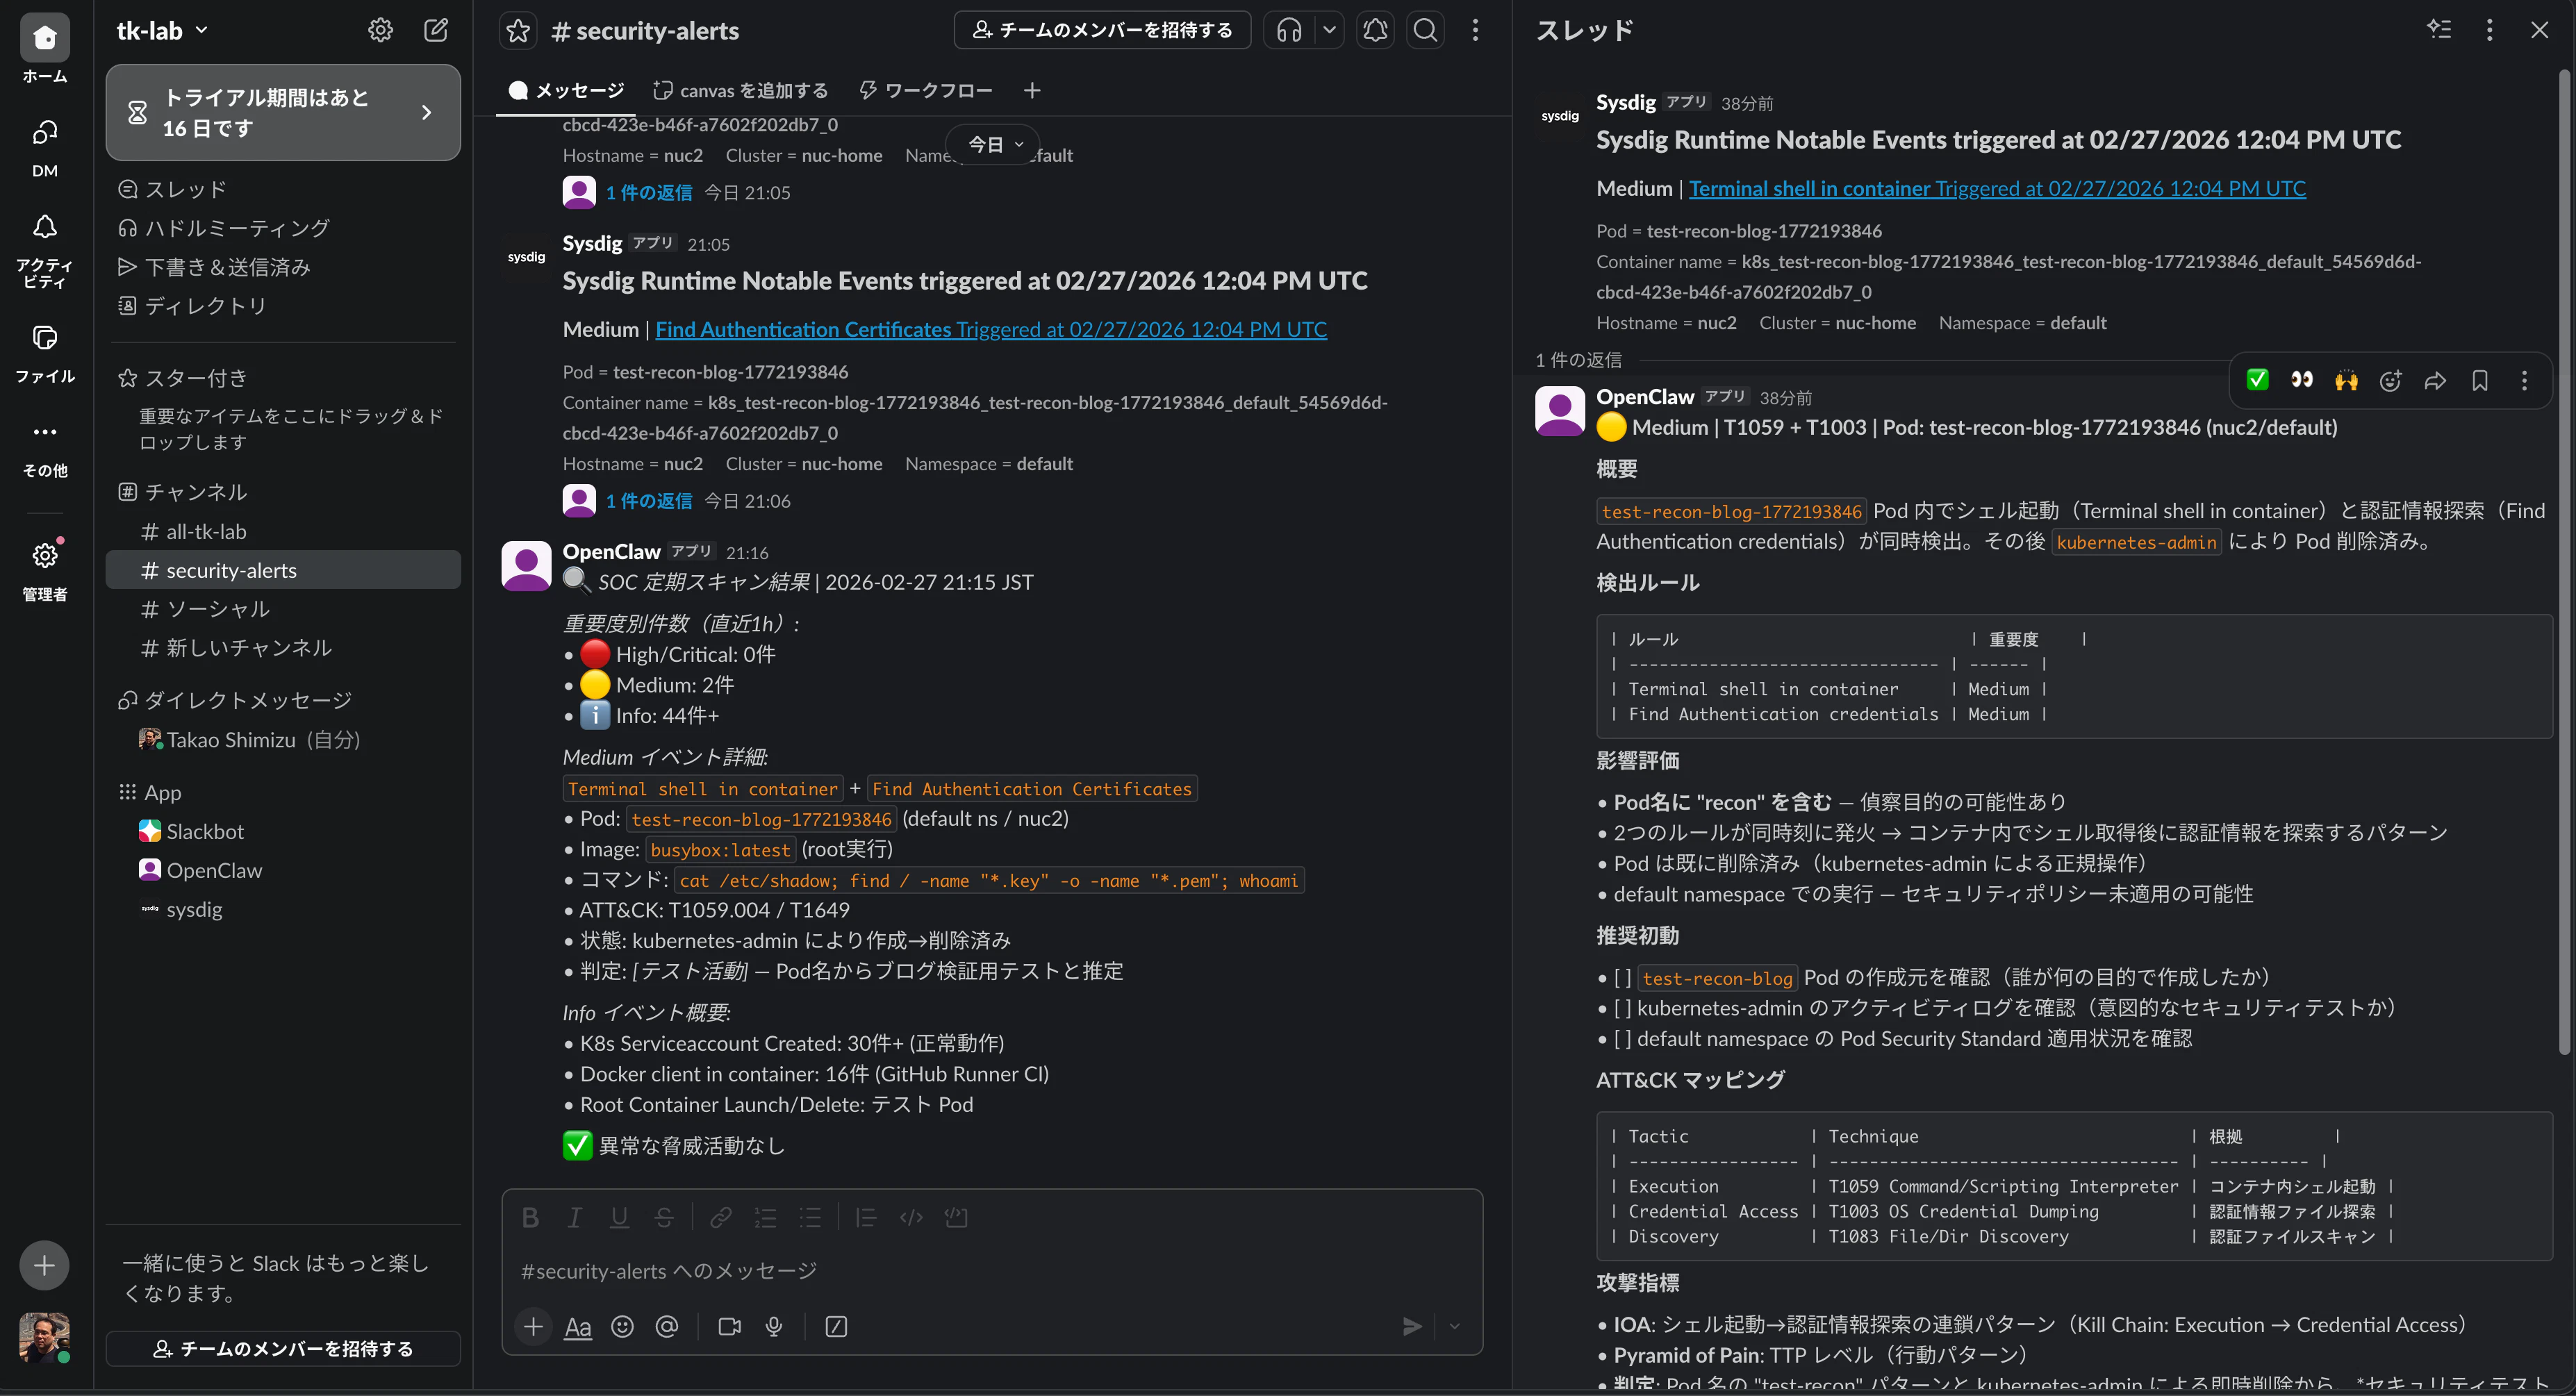
▲ Actual Slack #security-alerts screen: alert list on left, AI triage results in thread on right
Real Example: Authentication Credential Discovery Alert Triage
When I ran /etc/shadow reads and certificate file searches from a test busybox container, Sysdig detected a Find Authentication Certificates alert. Within seconds of posting to Slack #security-alerts, OpenClaw automatically posted the following triage results in the thread:
## 🟠 Medium | T1649 + T1003 + T1083 | Pod: test-recon-blog (nuc2/default)

### Summary
A compound reconnaissance command targeting credential discovery/theft
was executed with root privileges inside a busybox:latest container.

### Executed Command Chain (⚠️ Important)
sh -c cat /etc/shadow; find / -name "*.key" -o -name "*.pem" 2>/dev/null; whoami; exit 0

3-stage reconnaissance executed in a single shell:
  1. cat /etc/shadow → Password hash theft (T1003)
  2. find / -name *.key -o -name *.pem → Certificate/private key discovery (T1649)
  3. whoami → Privilege verification (T1083)

### ATT&CK Mapping
| Tactic            | Technique | Evidence                    |
|-------------------|-----------|----------------------------|
| Credential Access | T1649     | Key/certificate file search |
| Credential Access | T1003     | /etc/shadow read            |
| Discovery         | T1083     | Full filesystem scan        |
| Execution         | T1059     | Compound command via sh     |

### Attack Indicators
- IOA: busybox + /etc/shadow + cert search combination (Pyramid of Pain: TTP level)
- IOC: proc.hash.sha256=786295... (find binary)
- IOC: Pod test-recon-blog / Image busybox:latest in default ns

### Recommended Initial Response
- [ ] Immediate Pod deletion: kubectl delete pod test-recon-blog -n default
- [ ] Investigate Pod creator (kubectl get events / audit log)
- [ ] Check related events on same node (nuc2)
Key points to note:
-
Automatic command chain decomposition: AI automatically separates the 3-stage reconnaissance contained in a single
sh -cand assigns ATT&CK technique IDs to each - Pyramid of Pain application: Instead of mere hash values (easy to change), classified at TTP level (behavioral patterns) — prioritizing indicators that are hard for attackers to change
-
Actionable recommended response: Provides specific commands like
kubectl delete pod
Chained MCP Tool Calls
For the triage above, the AI automatically called these Sysdig MCP tools behind the scenes:
1. sysdig_get_event_info        → Retrieve alert details
2. sysdig_list_runtime_events   → Search related events for same Pod
3. sysdig_get_event_process_tree → Visualize process tree
For a single alert, 3 MCP tools are called in sequence, building context before generating the triage result. The work a human would do opening Sysdig's dashboard to gather the same information — AI completes in seconds.
Multi-Alert Correlation Analysis
When 2 alerts fire from the same Pod simultaneously (Terminal shell in container + Find Authentication credentials), AI automatically runs correlation analysis:
### Detection Rules
| Rule                            | Severity |
|---------------------------------|----------|
| Terminal shell in container     | Medium   |
| Find Authentication credentials | Medium   |

2 rules firing simultaneously → Pattern of shell acquisition in container
followed by credential search (Kill Chain: Execution → Credential Access)

Assessment: The "test-recon" pattern in Pod name and immediate deletion
by kubernetes-admin suggest this is likely a security test.
However, confirmation of the creator's intent is needed.
Even Medium alerts individually, when analyzed through temporal and spatial correlation of multiple alerts, present the full picture as an attack chain.
Automated False Positive Learning
During ongoing operations, node-exporter periodically triggers alerts for scanning SUID/SGID binaries. Just by replying "FP" in the thread:
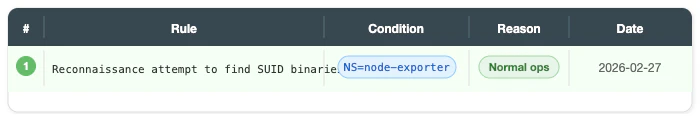
From then on, alerts matching the same pattern automatically get a [FP Candidate] tag, reducing noise. A SOC that gets smarter with use.
Implementation: 5 Phases × 43 Tasks
Based on the task definition document, we executed 43 tasks across 5 phases.
| Phase | Name | Tasks | Must | Should | Could | Content |
|---|---|---|---|---|---|---|
| 1 | SOC Foundation | 13 | 12 | 1 | 0 | Alert reception, triage, escalation, daily summary |
| 2 | AI Triage Enhancement | 7 | 2 | 5 | 0 | FP detection, IOC/IOA classification, correlation, QA |
| 3 | SOAR Workflows | 9 | 1 | 7 | 1 | PB-004-010 playbooks, report templates, evidence preservation |
| 4 | Periodic Monitoring & Threat Hunting | 8 | 1 | 3 | 4 | Periodic scans, PEAK framework, threat intelligence |
| 5 | Continuous Improvement | 6 | 1 | 2 | 3 | Metrics measurement, weekly reports, operational checklists |
| Total | 43 | 17 | 18 | 8 |
Phase 1 Highlight: The First Triage
The most exciting moment in Phase 1 was when AI returned triage results for a test alert for the first time.
Ran a test with kubectl run reading /etc/shadow from a busybox container. Sysdig detected it, posted to Slack. Seconds later, OpenClaw posted structured triage results in the thread:
- Severity: High
- ATT&CK: T1003 (OS Credential Dumping) / T1609 (Container Admin Command)
- Impact scope: busybox Pod in default namespace
- Recommended response: Stop Pod, investigate image, verify access paths
All fully automated, executed within seconds of the alert posting.
Phase 2 Highlight: Deepening AI Triage
Phase 2 evolved from simple alert response to "intelligent analysis." Added automatic false positive detection (3 criteria), IOC/IOA classification system (Pyramid of Pain compatible), and alert correlation analysis (4 types). The ATT&CK mapping and Pyramid of Pain level assignments seen in the operational examples above are driven by rules designed in this phase.
Phase 4 Highlight: Automated Periodic Monitoring
Set up 4 periodic jobs using OpenClaw's native cron functionality:
| Job Name | Schedule | Destination | Content |
|---|---|---|---|
soc-daily-summary |
Daily 08:00 JST | Telegram | Daily SOC summary |
soc-security-scan-hourly |
Hourly | Slack | Runtime event scan |
soc-k8s-health-15m |
Every 15 min | Slack | K8s health check |
soc-weekly-report |
Monday 09:00 JST | Telegram | Weekly trend report |
The daily summary generates in about 80 seconds — a comprehensive report with previous day's alert statistics, K8s cluster status, and trend analysis delivered to Telegram every morning.
Results and Impact
Quantitative Results
| Category | Numbers |
|---|---|
| Requirements Spec | v1.9 (25 FRs / 10 NFRs / 12 PBs / 14 E2E tests) |
| Tasks | 43/43 completed (5 Phases) |
| Review Rounds | 8 rounds, 61 issues fixed |
| MCP Tools | 52 (Sysdig 21 + Serena 27 + drawio 3 + n8n 1) |
| ATT&CK Techniques | 18 (11 tactics) |
| Playbooks | 12 (PB-001 through PB-012) |
| SOC Metrics | 9 (MTTD / MTTN / MTTT / MTTC / MTTR / FPR / AI accuracy / Processing rate / Escalation accuracy) |
| Periodic Monitoring Jobs | 4 (15m / 1h / daily / weekly) |
| Risks | 11 (with identified mitigations) |
| Architecture Diagrams | 6 types (draw.io + Mermaid + PNG) |
AGENTS.md |
336 lines / 11,052 characters (within 20,000 char limit) |
SOC-REFERENCE.md |
609 lines / 25,717 characters |
Operational Posture
Degraded Operation Design: SOC monitoring doesn't stop even if MCP servers go down. Four degradation levels defined:
| Failure | Impact | Response |
|---|---|---|
| Sysdig MCP only down | No deep-dive investigation, triage from Slack messages only | Request manual verification |
| n8n MCP only down | Automated playbook execution stops | Other functions continue |
| All MCP down | Slack monitoring only | Full system down notification via Telegram |
| Recovery | Batch triage of unprocessed alerts | Automatic return to normal operations |
Backup: ~/openclaw-backups/backup.sh backs up OpenClaw config, AGENTS.md (including FP patterns), SOC-REFERENCE.md, n8n database, and cron job settings. Backups older than 30 days are automatically deleted.
Operational Checklist: 12 items defined across 5 tiers — daily/weekly/monthly/quarterly/ad-hoc. Monthly includes "prompt quality assurance" (threshold evaluation of triage accuracy > 85%, FP rate < 30%, etc.).
Conclusion and Future Outlook
"Prompt Engineering = Software Engineering"
The biggest takeaway: prompt engineering requires the same discipline as software engineering.
- Requirements Definition: Vague instructions produce vague output. Clear output formats, judgment criteria, and exception handling must be defined
- Testing: Prompt changes directly impact "AI output quality." Regression testing (verifying quality hasn't degraded with past alerts) is essential
- Size Management: Like code module separation, prompts should be split into "core" and "reference documents"
-
Version Control: Being able to track
AGENTS.mdchange history is essential for identifying the source of quality issues - Review: Just like human code review, prompt review directly improves quality
The process of reviewing the requirements spec 10 times and fixing 61 issues was exactly this discipline in practice.
Future Outlook
SOC production operations have just begun. While accumulating real operational data, I plan to work on:
- Metrics Improvement: Measure current baselines and gradually approach target values (FP rate < 25%, AI accuracy > 90%)
- ATT&CK Coverage Expansion: Expand from current 18 techniques to cover uncovered areas relevant to container environments
- FP Pattern Accumulation: Enrich false positive pattern list through operations to reduce noise
- Threat Hunting Practice: Conduct proactive investigations monthly based on the PEAK framework
- Quantitative Prompt Quality Evaluation: Track accuracy metrics in monthly reviews for continuous prompt improvement
An AI SOC analyst isn't "deploy and done" — it's something you nurture through operations. False positive pattern learning, adapting to new attack techniques, metrics-driven improvement — by continuously running this cycle, I believe a home lab SOC can approach maturity levels rivaling enterprise SOCs.