はじめに
第2回目でSpark ClusterにAccess Logを喰わせてKPIの算出(DAUやDaily Unique User)を行いましたが、今回は同じAccess LogをSpark MLLib(Sparkの機械学習のLibrary)で、Clustering(K-Means)とPCA(主成分分析)をする方法をチラシの裏しておきます。
-
(第1回)Amazon EMR上でのSpark Clusterの起動/設定方法
- Spark, IPythonの設定方法
- Spot instanceについて
-
(第2回)Sparkを使って簡単なAccess Log解析
- Access LogをS3から読み込んで、ETLする
- Access Logを使って定番のMAU, DAU, UUをSparkで計算してみる
- 各種Monitoring toolの見方
- (第3回)Sparkを使って簡単な機械学習 (★今回はココ)
- matplotlib/seabornを使ってGraphを書いてみる
- MLLibを使ってAccess Logを機械学習(K-Means, PCA)にかけてみる
なお、Numpy, Pandas Dataframe, Spark Dataframeを駆使しないとCodeが冗長になるため、これらを使っていますが、必要に応じて個別にググってください。
また、本記事のIPython Notebookをこちらに置いておくので、随時実行してみて下さい。
処理の流れ
この記事の処理の流れの超概要は以下の通りです。
- Access Logを前処理する
-
User毎のAccess数のバラツキを確認する
- User毎のAccess数からHistogram/Pie-Chartを作成し、殆どがLight Userである事を確認する
-
Cluster処理をかけ"Heavy User"を抽出する
- User毎のAccess数に対してCluster処理をかけ"Heavy User"を抽出する
- "Heavy User Log"にもPie-Chartを作成し、Access数の分布を再確認する
-
"Heavy User Log"のCampaign毎のAccess数に対して、PCAをかける
- User別Campaign別のAccess数を行列化し、変数を標準化した上でPCA(主成分分析)をかける
- PCAの結果、寄与度が低い固有ベクトルの成分を削除し、縮約をする
-
PCAの結果を基にClustering処理をかける
- PCA後の新しい座標系上でClusteringを行う
-
Clustering別Campaign別のAccess傾向をChart化し、各Clusterの特徴を確認する
- 各Cluster毎に、そのClusterに属するUserの各CampaignへのAccess数を行列化/標準化する
- Cluster別Campaign別のAccess数をChart化する
K-MeansでのClusteringの注意
- K-MeansでのClusteringの問題の一つとして、初期値依存性があります。実際にIPythonで動かして見ると解ると思いますが、実行するたびに出力結果が異なります。なので、この記事と同一の結果にならなくても気にしないで下さい
- Clusterを何個にするべきかの指標として、この記事では簡易的にWSSSE(Clusterの中心からの2乗誤差の和)を使っていますが、ここは色々Know Howがある領域です、あくまでご参考程度に。
Access Logについて
第2回目と同様のAccess Logを題材として使います。技術評論社さんの本で使われていたAccess Log(csv)で、csv fileへの直リンはこちらです。
csvの中身ですが、以下の通りです。
- 各Recordは日付、User_ID, Campaign_IDの3つの情報を持つ
- Totalの行数は
327431、最初の1行がcsv headerなので、実Record数は327430 - 2015/4/27-5/3の7日分のDataを持つ
- file sizeは13MB
click.at	user.id	campaign.id
2015/4/27 20:40	144012	Campaign077
2015/4/27 0:27	24485	Campaign063
2015/4/27 0:28	24485	Campaign063
2015/4/27 0:33	24485	Campaign038
Step#0 Logの前処理
今回はS3からではなく、wgetでcsv fileをLocalにDownload → HDFSにCopy → HDFSからcsv fileをLoadという手順にしています。LoadしたRDDに、第2回目で解説した前処理を行って居ます。
import json, os, datetime, collections, commands
import numpy as np
import pandas as pd
import matplotlib.pyplot as plt
import seaborn as sns

if not os.path.exists("./click_data_sample.csv"):
    print "csv file not found at master node, will download and copy to HDFS"
    commands.getoutput("wget -q http://image.gihyo.co.jp/assets/files/book/2015/978-4-7741-7631-4/download/click_data_sample.csv")
    commands.getoutput("hadoop fs -copyFromLocal -f ./click_data_sample.csv /user/hadoop/")

whole_raw_log = sc.textFile("/user/hadoop/click_data_sample.csv")
header = whole_raw_log.first()

whole_log = whole_raw_log.filter(lambda x:x !=header).map(lambda line: line.split(","))\
            .map(lambda line: [datetime.datetime.strptime(line[0].replace('"', ''), '%Y-%m-%d %H:%M:%S'), line[1], line[2].replace('"', '')])
whole_log.repartition(4).cache()
whole_log.take(2)

# [[datetime.datetime(2015, 4, 27, 20, 40, 40), u'144012', u'Campaign077'],
# [datetime.datetime(2015, 4, 27, 0, 27, 55), u'24485', u'Campaign063']]
Step#1 User毎のAccess数のバラツキを確認する
Histogram作成
まずは、User毎のAccess数のHistogramを作成して、Access数がバラついている事を確認します。
処理のイメージとしては、[4/27, user1, Campaign1], [4/27, user2, Campaign2], [4/28, user1, Campaign3], [4/27, user3, Campaign2]から、User毎のAccess数のListである[2, 1, 1]を作成する感じです。作成したListをSeabornに突っ込むと、Histogramが作成されます。
access_by_user = whole_log.map(lambda record:record[1]).countByValue().items()
num_of_access = sorted (map(lambda line: line[1], access_by_user), reverse=True)

sns.set(color_codes=True)
sns.distplot(num_of_access, kde=False, norm_hist=False, bins=1000)
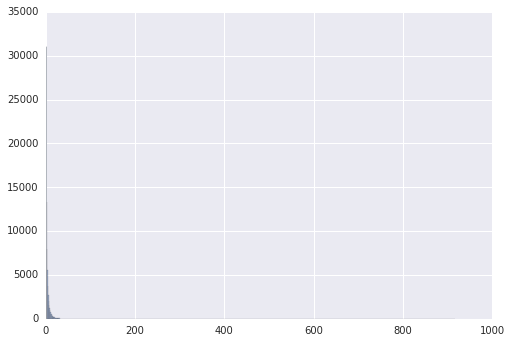
以下の様なHistogramが表示されます。x軸がAccess数、Y軸がそのAccess数のUser数です。左下に集中して何が何だかです。
Pie-Chart作成
続いて、Access数のPie-Chartを作成して、バラツキ具合を確認します。
処理のイメージとしては、[4/27, user1, Campaign1], [4/27, user2, Campaign2], [4/28, user1, Campaign3], [4/27, user3, Campaign2]から、User毎のAccess数のListである[2, 1, 1]とAccess数のLabelである[1,2,3]を作成する感じです。2つのListからPie-Chartを作成します。
num_usage_count_list = collections.Counter(num_of_access).items()
print num_usage_count_list[:10]
# [(1, 31022), (2, 13273), (3, 7974), (4, 5510), (5, 3745), (6, 2736), (7, 2070), (8, 1618), (38, 21), (10, 1003)]
# User access 1 time : 31022, User access 2 times : 13273...

num_usage_label = map(lambda item: item[0], num_usage_count_list)
num_usage_num  = map(lambda item: item[1], num_usage_count_list)

# Use pyplot as Seaborn not supporting pie-chart https://github.com/mwaskom/seaborn/issues/766
plt.pie(num_usage_num, labels=num_usage_label, startangle=90, autopct="%1.1f%%")
plt.axis("equal")
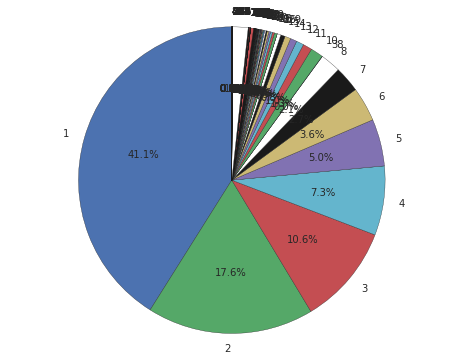
以下の様なPie-Chartが表示されるはずです。75%以上がAccess数4回以下で占められている事が解ります。"Light User"を除外しないと、"Heavy User"のAccess傾向が良く掴めません。
Step#2 Cluster処理をかけ"Heavy User"を抽出する
Clusterの初期化
K-MeansによるClusterのClassを作っておきます。initializationModeはk-means||を指定しています。詳細はここら辺を参照して下さい。
from pyspark.mllib.clustering import KMeans, KMeansModel
from pyspark.mllib.linalg import DenseVector
from pyspark.mllib.linalg import SparseVector
from numpy import array
from math import sqrt

class CreateCluster:
    def __init__(self, input_rdd, num_of_cluster):
        self.cluster = KMeans.train(input_rdd, num_of_cluster, maxIterations=100, runs=100, initializationMode="k-means||")
        self.cluster_deviation = input_rdd.map(lambda point: self.__calculate_deviation(point)).reduce(lambda x, y: x + y)
        self.each_cluster_users = input_rdd.map(lambda point: self.__which_cluster(point)).countByValue().items()
        self.which_cluster = input_rdd.map(lambda point: self.__which_cluster(point)).collect()
        self.cluster_center = self.cluster.centers

    def __calculate_deviation(self, point):
        center = self.cluster.centers[self.cluster.predict(point)]
        return sqrt(sum([x**2 for x in (point - center)]))

    def __which_cluster(self, point):
        return self.cluster.predict(point)
Clusterの適応とWSSSEの推移の確認
Access数の塊を確認するために、Access数のListにClusteringを適応します。Histogramのところで、[4/27, user1, Campaign1], [4/27, user2, Campaign2], [4/28, user1, Campaign3], [4/27, user3, Campaign2]から、User毎のAccess数のList[2, 1, 1]を作成しましたが、この[2, 1, 1]という1次ベクトルにK-Meansをかけます。
が、1次元ベクトルにはK-Meansが掛からないので、[[2,2], [1,1], [1,1]...]という2次元に無理矢理変更して、K-Meansをかけます。
以下、Cluster数を1から10まで変更させて、WSSSEの値、Clusterの中心値、そのClusterに属するUser数を吐き出し、WSSSEの推移をChart化します。
# Ugly hack, to perform cluster for list (one dimension), create 2 dimension RDD
num_of_access_rdd = sc.parallelize(map(lambda item: [item,item], num_of_access))
WSSSE_list = []
max_cluster = 10

print "Cluster#, WSSSE value, [Center centers], [(ClusterID, Number of user)]"
for count in range (1, max_cluster):
    full_user_cluster = CreateCluster(num_of_access_rdd, count)
    center_value_list = []
    for center_value in full_user_cluster.cluster_center:
        center_value_list.append(round(center_value[0],1))
    print count, int(full_user_cluster.cluster_deviation), center_value_list, full_user_cluster.each_cluster_users
    WSSSE_list.append([count, full_user_cluster.cluster_deviation])

deviation_nparray = np.array(WSSSE_list, dtype=int)
plt.plot(deviation_nparray[:,0], deviation_nparray[:,1], "ro")
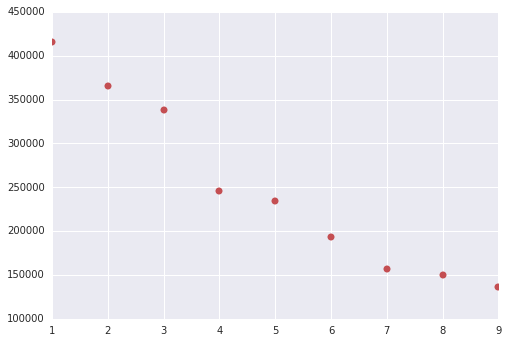
以下の様な結果が出ると思います(K-Meansは実行毎に結果が異なるため、これと100%は一致しないと思います)。
Cluster数が4以降でWSSSEの減り方が下がっているので、Cluster数は4とします。つまり、Cluster#4の最初のCluster((0, 70930), Cluster中心値2.8)をLight Userと見なし、Access数が多い4615(=75545-70930) UserのLogを解析対象とする事とします。
Cluster#, WSSSE value, [Center centers], [(ClusterID, Number of user)]
1 415490 [4.3] [(0, 75545)]
2 364957 [3.9, 262.8] [(0, 75420), (1, 125)]
3 337732 [3.7, 379.1, 103.2] [(0, 75201), (1, 54), (2, 290)]
4 245752 [2.8, 398.3, 20.3, 136.9] [(0, 70930), (1, 47), (2, 4393), (3, 175)]
5 234219 [2.7, 115.7, 304.2, 18.6, 634.4] [(0, 70203), (1, 195), (2, 54), (3, 5083), (4, 10)]
6 193272 [12.7, 2.3, 137.4, 305.9, 45.6, 634.4] [(0, 8413), (1, 66330), (2, 126), (3, 53), (4, 613), (5, 10)]
...
"Heavy User"のAccess数をPie-Chartで再確認
# extract top 4615 uses
num_extract = 4615
access_by_heavy_user = sorted (access_by_user, key=lambda item: item[1], reverse=True)[:num_extract]
num_of_access_heavy_user = sorted (map(lambda line: line[1], access_by_heavy_user), reverse=True)

print len(access_by_heavy_user)
print access_by_heavy_user[:5]
print num_of_access_heavy_user[:5]

# 4615
# [(u'22975', 916), (u'30292', 767), (u'107624', 761), (u'41760', 636), (u'121150', 596)]
# [916, 767, 761, 636, 596]

# Create pie-chart to check the num-of-user vs num-of-access
num_heavy_usage_count_list = collections.Counter(num_of_access_heavy_user).items()
num_heavy_usage_label = map(lambda item: item[0], num_heavy_usage_count_list)
num_heavy_usage_num  = map(lambda item: item[1], num_heavy_usage_count_list)

plt.pie(num_heavy_usage_num, labels=num_heavy_usage_label, startangle=90, autopct="%1.1f%%")
plt.axis("equal")
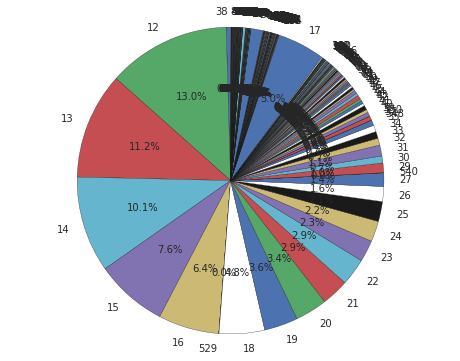
以下の様なPie-Chartが表示され、Access数が12回以上のLogのみ残っている事が確認できます。
Step#3 "Heavy User Log"のCampaign毎のAccess数に対して、PCAをかける
"Heavy User"のLogの抽出
まず、元の32万行のLogから、"Heavy User"のUserIDに該当するLogのみを抽出します。
heavy_user_nparray = np.array(access_by_heavy_user, dtype=int)

# list of userID  of heavy user
heavy_userID_rdd = sc.broadcast(list(heavy_user_nparray[:,0]))

# First, filter out the original log only for the heavy_userID
heavy_user_whole_log = whole_log.filter(lambda item: int(item[1]) in heavy_userID_rdd.value).map(lambda item: [int(item[1]), item[2]])
heavy_user_whole_log.repartition(3).cache()
print heavy_user_whole_log.take(5), heavy_user_whole_log.count()
# [[24485, u'Campaign063'], [24485, u'Campaign063'], [24485, u'Campaign038'], [24485, u'Campaign063'], [167405, u'Campaign027']] 132030
User別Campaign別のAccess数を行列化
次に、"Heavy User"のLogを、User別Campaign別の行列にETLします。一番ややこしい部分ですが、以下の様に、User別のAccess LogからUser別Campaign別の行列に変換して標準化します。
-
[[user1, campaign1], [user1, campaign3], [user2, campaign2], [user1, campaign1]]から -
[[user1, 0.66, 0.0, 0.33], [user2, 0.0, 1.0, 0.0]]と言う形に変換する
User IDを持つAccess Logを、EventTypeなりCampaignIDなりでの行列/標準化は、EventやCampaignのClusteringをする用途で良くあるCaseだと思います。このETLの手順は、過去の試行錯誤の結果、今の所、Spark Dataframeを経由して、RDD化してreduceByKeyして、最終的にPandas Dataframeに格納する、という方法に落ち着いています(もっと簡単なCodeが有ったら、教えて頂けると幸いです)。
まず、SparkのDataframeに格納し、groupBy→aggでUserID x CampaignID x Countという形にします。
# use Spark DataFrame to perform "groupBy -> agg"
from pyspark.sql import SQLContext, Row
from pyspark.sql.types import *

fields = [StructField("userID", IntegerType(), True), StructField("campainID", StringType(), True)]
heavy_user_df = sqlContext.createDataFrame(heavy_user_whole_log, StructType(fields))
heavy_user_agged_df = heavy_user_df.groupBy("userID", "campainID").agg({"campainID": "count"})
heavy_user_agged_df.show(10)

# +------+-----------+----------------+
# |userID|  campainID|count(campainID)|
# +------+-----------+----------------+
# |169114|Campaign112|               1|
# | 34998|Campaign097|              11|
# | 82209|Campaign090|               1|
# | 14823|Campaign100|              10|
# | 11715|Campaign052|               4|
# | 13340|Campaign129|               1|
# | 85422|Campaign116|              26|
# | 55885|Campaign025|               3|
# | 34966|Campaign028|               1|
# | 95704|Campaign103|               9|
# +------+-----------+----------------+
# only showing top 10 rows
続いて、RDD化してreduceByKeyする箇所です。
def merge_dict_addValue(d1, d2):
  totals = collections.Counter()
  totals.update(d1)
  totals.update(d2)
  return dict(totals)

heavy_user_agged_rdd    = heavy_user_agged_df.map(lambda item: [ int(item[0]), {item[1]: int(item[2]) }] )
heavy_user_reduced_rdd = heavy_user_agged_rdd.reduceByKey(lambda x,y: merge_dict_addValue(x,y) )
heavy_user_reduced_rdd.take(5)

# [(86016,
#   {u'Campaign027': 6,
#    u'Campaign090': 2,
#    u'Campaign123': 2,
#    u'Campaign131': 2}),
#  (47106,
#   {u'Campaign014': 7,
#    u'Campaign025': 5,
#    u'Campaign040': 2,
#    u'Campaign072': 1}),
#  (67590, {u'Campaign027': 24, u'Campaign090': 4, u'Campaign131': 11}),
#  (117420, {u'Campaign010': 5, u'Campaign055': 5, u'Campaign103': 7}),
#  (74538, {u'Campaign083': 11, u'Campaign119': 2})]
最後に、User別Access数を行列化/標準化してPandas Dataframeに格納する箇所です。列がCampainID, 行がUserIDというindexを持ち、行列の中身が(各User毎でAccess数の和が1になる形で)標準化されたAccess数が格納されているPandas Dataframe行列を作成します。
# create list of userID and campainID
raw_campain_list = heavy_user_reduced_rdd.map(lambda item:item[1].keys()).reduce(lambda x,y:x+y)
sorted_campain_list = sorted(list(set(raw_campain_list)))

raw_userID_list = heavy_user_reduced_rdd.map(lambda item:item[0]).collect()
sorted_userID_list =sorted(raw_userID_list)

# create pandas of userID x campainID, and fill nuber of access
pd_df_raw = pd.DataFrame(0, index=sorted_userID_list, columns=sorted_campain_list)
for item in heavy_user_reduced_rdd.collect():
    for keys in item[1].items():
        pd_df_raw.ix[item[0], keys[0]] = keys[1]

# normalize each rows, to make each row's sum to be 1
normalized_pd_df = pd_df_raw.div(pd_df_raw.sum(axis=1), axis=0).astype(float)
標準化された行列をDense Vectorに変換
PCA前の最後のETLです。PCAの入力はSpark Dataframeで要素がDense Vectorである必要が有るための変換です(SparkのMLLibはInput, Outputの一貫性が微妙に無い気がします)。
from pyspark.ml.feature import *
from pyspark.mllib.linalg import Vectors

densevector_list = []
for normalized_pd_df_one_line in map(list, normalized_pd_df.values):
    densevector_one_list = []
    for pd_df_item in normalized_pd_df_one_line:
        densevector_one_list.append(np.float64(pd_df_item).item())
    densevector_list.append((Vectors.dense(densevector_one_list),))

# Finally, we get Spark Dataframe with "Dense Vector"
spark_normalized_df = sqlContext.createDataFrame(densevector_list, ["features"])
PCA(主成分分析)を適応
ETLがやっと終わったので、PCAを適応します。が、現在のSpark MLLibのPCAは、座標変換後のScore(=eigenvalues、新しい座標系における座標)は返してくれるのですが、固有ベクトル(=eigenvectors、第一主成分ベクトル、第二主成分ベクトル...)と寄与率(=explained variance)は返してくれません。
この記事を参考にしつつ、固有ベクトル、寄与率も出力する処理を追加して、Dense VectorにPCAをかけます。
from numpy.linalg import eigh
from pyspark.mllib.linalg import *

def estimateCovariance(df):
    m = df.select(df["features"]).map(lambda x: x[0]).mean()
    dfZeroMean = df.select(df["features"]).map(lambda x: x[0]).map(lambda x: x-m)
    return dfZeroMean.map(lambda x: np.outer(x,x)).sum()/df.count()

def pca(df, k=2):
    cov = estimateCovariance(df)
    col = cov.shape[1]
    eigVals, eigVecs = eigh(cov)
    inds = np.argsort(eigVals)
    eigVecs = eigVecs.T[inds[-1:-(col+1):-1]]
    components = eigVecs[0:k]
    eigVals = eigVals[inds[-1:-(col+1):-1]]  # sort eigenvalues
    score = df.select(df["features"]).map(lambda x: x[0]).map(lambda x: np.dot(x, components.T) )
    scoreDF = sqlContext.createDataFrame(score.map(lambda x: (DenseVector(x),)), ["pca_features"])
    return components.T, scoreDF, eigVals

def varianceExplained(df, k=1):
    eigenvalues = pca(df,k)[2]
    return sum(eigenvalues[0:k])/sum(eigenvalues)


pca_extracted = PCA(k=len(sorted_campain_list), inputCol="features", outputCol="pca_features")
model = pca_extracted.fit(spark_normalized_df)

# comp is numpy array object, and PCA'ed vectors (eigenvectors)
# score is RDD object, and coordinates of each sample at PCA'ed vectors
# eigVals is numpy array object, percentage of variance explained for PCA'ed vectors

comp, score, eigVals = pca(spark_normalized_df, k=len(sorted_campain_list))
Sum_contribution = 0
for each_eigVal in eigVals:
    Sum_contribution += each_eigVal
    print Sum_contribution/sum(eigVals)
すると、以下の様な累積寄与率がprintされます。Campaignの数は133個なので、固有Vectorは133個、寄与率も133個存在し、累積の寄与率は最後1になります。
0.111139239317
0.19765807487
0.270689655737
0.337422058185
- snip
0.787763756056
0.794578184947
0.801278733892
0.807638204518
0.813936829873
...
PCA後のScoreを算出
PCAにより、133個の固有Vector上に射影されましたが、寄与率80%までの情報のみを使う事とします。寄与率の累計を見ていくと、第36主成分で80%を超えるので、第37主成分以降は削除し(縮約し)、新しい36次元上での、User別のAccess数の座標を計算します。
以下のCodeでPCA後の36次元の座標を算出します (あるUserのAccess数(pca_converted_score[0])が、36次元で表現されています)。
num_new_dimension = 36

# score.collect() retunrs list of "Pyspark DenseVector", thus need "tolist()"
pca_converted_score = []
for each_score in score.collect():
    pca_converted_score.append(each_score[0].tolist()[:num_new_dimension])

print len(pca_converted_score), len(pca_converted_score[0])
print pca_converted_score[0]

# 4615 36
# [0.012991190136479754, -0.006671423647828865, 0.0015734684158475898, -0.006962110319470609, 0.08442495463203536, 0.04764228552579725, -0.04273739944688369, 0.249639955298965, 0.8162015105477881, -0.4631590626992834, 0.06000345092343135, -0.10501081368416164, 0.011354406776460435, 0.0102347299596541, -0.04595585876610297, 0.0169049970242838, -0.06341979465882117, 0.0010774499747916602, 0.07346137494869247, 0.044397281830941736, -0.021447730071713564, -0.004471163038078976, -0.007699762728653565, 0.02483635656900492, -0.001436257512657762, 0.023749138493781484, -0.0037942635547112444, 0.010283519032304142, -0.014768782541750203, -0.0021076179257598325, 0.0013082656773329253, -0.002945674601731209, 0.013830728926499471, -0.02644451137004236, 0.011865570441636742, -0.0005234305417112446]
Step#4 PCAの結果を基にClustering処理をかける
36次元に変換された座標に対して、K-MeansでClusteringをかけます。
Clusterの適応とWSSSEの推移の確認
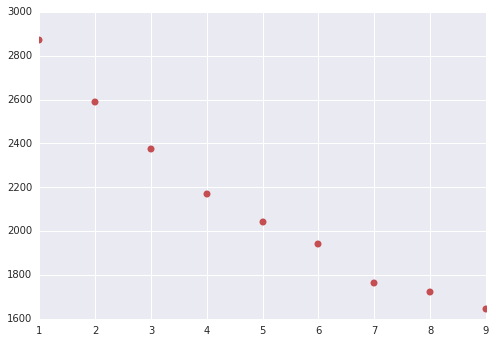
前回同様、WSSSEの推移をみて、何個のClusterに分割すれば良いか調べます。Cluster数を1から10まで変更させて、WSSSEの値、Clusterに属するUser数を吐き出し、WSSSEの推移をChart化します。
max_cluster = 10
WSSSE_list = []
pca_converted_rdd = sc.parallelize(pca_converted_score)

print "cluster#, WSSSE value, [(ClusterID, Number of user)]"
for count in range (1, max_cluster):
    pca_converted_cluster = CreateCluster(pca_converted_rdd, count)
    print count, int(pca_converted_cluster.cluster_deviation), pca_converted_cluster.each_cluster_users
    WSSSE_list.append([count, pca_converted_cluster.cluster_deviation])

deviation_nparray = np.array(WSSSE_list, dtype=int)
plt.plot(deviation_nparray[:,0], deviation_nparray[:,1], "ro")
以下の様な結果が出ると思います(K-Meansは実行毎に結果が異なるため (略)。Cluster数が6以降でWSSSEの減り方が下がっているので、Cluster数は6とします。
cluster#, WSSSE value, [(ClusterID, Number of user)]
1 2870 [(0, 4615)]
2 2588 [(0, 861), (1, 3754)]
3 2374 [(0, 3515), (1, 241), (2, 859)]
4 2168 [(0, 856), (1, 574), (2, 2944), (3, 241)]
5 2041 [(0, 610), (1, 195), (2, 241), (3, 855), (4, 2714)]
6 1939 [(0, 129), (1, 856), (2, 241), (3, 195), (4, 2620), (5, 574)]
...
Step#5 Clustering別Campaign別のAccess傾向をChart化し、各Clusterの特徴を確認する
最後、Userを6 Clusterに分類できるようになったので、
- Heavy Userを6個に分割する
- 各Cluster毎に、各Campaign毎のAccess数の平均を取る
- Cluster別、Campaign別のAccess分布のChartを作成し、傾向を確認する
という処理をしておしまいです。
Clustering別Campaign別のAccess平均のChart作成
cluster_size = 6
pca_converted_cluster = CreateCluster(pca_converted_rdd, cluster_size)

pca_converted_cluster_list = pca_converted_cluster.which_cluster

heavy_user_pca_clustered = []
for count in range(0, len(sorted_userID_list)):
    heavy_user_pca_clustered.append([sorted_userID_list[count], pca_converted_cluster_list[count]])

# list of [userID, cluseter_belong_to]
print heavy_user_pca_clustered[:10]
print len(heavy_user_pca_clustered)

# [[97, 3], [136, 1], [142, 3], [143, 3], [252, 3], [358, 3], [374, 3], [489, 0], [492, 3], [507, 3]]
# 4615

# Calculate average number of access, by cluster by campaign.
num_of_campains = len(sorted_campain_list)
average_use_for_clusters = []

for count in range(0, cluster_size):
    average_use_for_clusters.append(np.zeros(num_of_campains, dtype=float))

for count_cluster_type in heavy_user_pca_clustered:
    average_use_for_clusters[count_cluster_type[1]] += np.array(normalized_pd_df.loc[count_cluster_type[0]].values.tolist())

# Create chart for each cluster
plt.figure(figsize=(16,8))
plt.subplots_adjust(left=None, bottom=None, right=None, top=None, wspace=0.2, hspace=0.3)
for count in range(0, cluster_size):
    #Convert to average from just sum
    average_use_for_clusters[count] = average_use_for_clusters[count]/pca_converted_cluster.each_cluster_users[count][1]
    subplot = plt.subplot( int(len(pca_converted_cluster.each_cluster_users)/4)+1, 4, count+1)
    subplot.set_xlim([0, num_of_campains])
    subplot.set_ylim([0, 1])
    subplot.set_yticks([0, 0.2, 0.4, 0.6, 0.8, 1.0])
    subplot.set_title("Cluster for " + str(count) + " (# of user :" + str(pca_converted_cluster.each_cluster_users[count][1]) + ")")
    plt.plot(range(1, num_of_campains+1, 1), average_use_for_clusters[count])
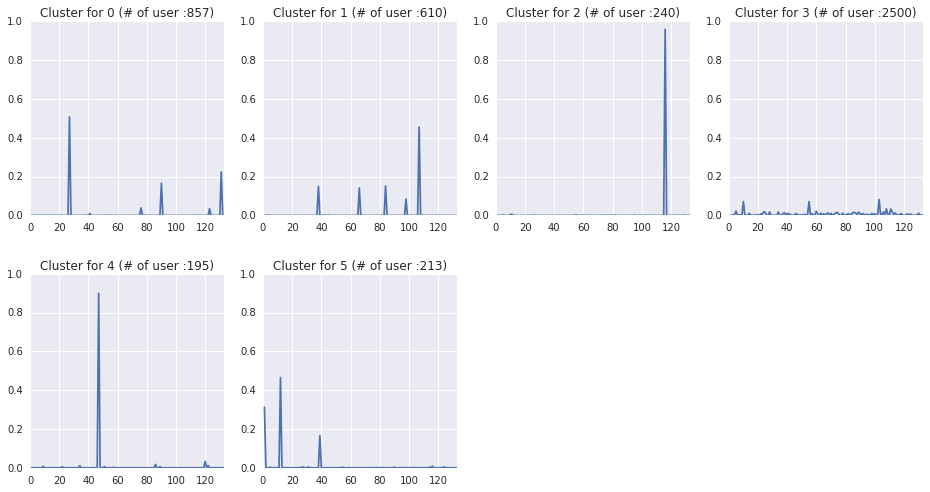
以下の様なChartが出ると思います(K-Meansは実行毎に結果が異なるため (略)。
Clustering毎の特徴の確認
今まで、Access数が多い4615 UserのLogに対して、Campaign毎のAccess数をPCA→6つのClusterに分類→Chart化と処理してきました。Chartを読むと、以下の様な事が解ると思います。
- cluster#3の2500 userが、どのCampaignにもまんべんなくAccessしている
- cluster#2, #4の240+195 userは、特定のCampaignのみに強くAccessしている
- cluster#0, #1, #5は特定のCampaignでAccecssの半分、残りは2-4 CampaignにAccessしている
などの分析ができます。
最後に
今回、Access Logを使ってのK-Means, PCAという機械学習を行ってみました。Codeを眺めると解りますが、殆どの処理がETLで、MLLibの処理そのものは極わずかです。ここら辺、今後のMLLibのversion upでよりもっと効率的に記述ができるように成ってくるんじゃないかと思います。
第2回目の、Sparkを使ってのKPI算出編と合わせて、SparkでのAccess Log解析の一助となれば幸いです。Typo、誤解、そもそも全然違う、などありましたらご連絡頂けると助かります。
本記事のIPython Notebookをこちらに置いておくので、随時実行してみて下さい。Sparkの環境構築の手順に従ってEMRを構築していれば、そのまま動くと思います(たぶん)。
