Create a static thematic map using the skills you learnt during lesson 5. The map should
contain more than one layer (from at least two different data sets). Pay attention to classification and visualisation (appropriate colour scheme choice, etc.). Write your code in this notebook, and store the resulting maps in .png format in the NOTEBOOK_DIRECTORY / "docs" folder.
レッスン5で学んだスキルを使って、静的な主題図を作ってください。この地図は、(少なくとも2つのデータセットから作成された)複数のレイヤーを含むべきです。分類と可視化のやり方に注意してください。(適切な配色の選択など)ソースコードをこのノートブックに書いてください。そして、作成した地図を.pngファイルとして、NOTEBOOK_DIRECTORY / "docs"フォルダに保存してください。
Topic of the map 地図のトピック
- Use any of the data sets we have used during the course (travel time data, population grid), or any other data set of your interest (for example, open data sets from Statistics Finland, or the open geo-data from the Helsinki Region Infoshare). If you download data sets, add, commit, and push them to the DATA_DIRECTORY. Be sure to include an attribution to each data set in your output map!
- Feel free to start from and adapt examples from the course material! You can take one step further and add additional analysis to, e.g., the shopping centre dominance or the population within vincinity of certain addresses)
- この学習コースで使ったデータセット(移動時間、人口グリッド)、または、あなたが興味ある他のデータセット(例えば、Statistics Finlandが公開しているデータセット、または、Helsinki Region Infoshareが公開している地理データセット)、いろいろなデータセットを使ってください。データセットをダウンロードしたら、
DATA_DIRECTORYに追加・コミット・プッシュしてください。(※1) 作成した地図に、それぞれのデータの帰属情報を含めることを忘れずに。 - このコースで紹介した題材から初めて、他のデータセットを適用してみてください! さらに一歩進んで、例えば、ショッピングセンターの支配地域であったり、とある場所近辺の人口など、追加の分析ができます
Criteria 評価基準
- The map has more than one data layer (for instance, the results of an analysis, and the road network to illustrate a complex spatial pattern). If (and only if) you think it adds additional value, feel free to add a base map (but a base map does not count as an own layer) (2 points)
- The map portrays the output of an analysis or a classification that adds value beyond just displaying the raw data (3 points)
- The map follows good cartographic practices (appropriate map extent and zoom level, colour scheme, legend and data sources, etc.) (5 points)
- この地図は、複数のデータレイヤーを持つ(例えば、分析結果のレイヤーと道路ネットワーク複雑な空間パターンのレイヤー)。付加価値として、ベースマップを追加する(ただし、ベースマップはレイヤーとして計上しません)(2ポイント)
- この地図は、分析または分類の結果を表示する。その結果は元としたデータ以上の価値がある(3ポイント)
- その地図は、地図作成のグッドプラクティスに沿っている(適切な地図の大きさとズームレベル、配色、凡例、データの提供元など)(5ポイント)
Output 結果
- Save the map(s) in .png format in the NOTEBOOK_DIRECTORY / "docs" folder, remember to add, commit, and push them to the GitHub repository
- Remember to also add, commit, and push input data sets and code
- 地図を
.pngファイルとして、NOTEBOOK_PATH / "docs"フォルダに保存してください。(原文はNOTEBOOK_DIRECTORYになっているが、誤字だと思われる)コミットとGitHubのレポジトリへのプッシュを忘れずに(※1) - 使用したデータセットや作成したソースコードのコミットやプッシュを忘れずに(※1)
※1 gitやGitHubを使わないので、該当のディレクトリにファイルを格納するだけです。
では実践です。概要は以下です。
-
helsinki_region_travel_times_to_railway_station.gpkgのcar_r_t(車での移動時間)をグリッドセルのレイヤーとして使います、ただし、移動時間が60分以下のもののみとします -
https://kartta.hel.fi/ws/geoserver/avoindata/wfs の
Seutukartta_liikenne_paatietの結果を道路ネットワークのレイヤーとして使います - OpenStreetMap.Mapnikをベースマップとして使います
import pathlib
NOTEBOOK_PATH = pathlib.Path().resolve()
DATA_DIRECTORY = NOTEBOOK_PATH / "data"
OUTPUT_DIRECTORY = NOTEBOOK_PATH / "docs"
helsinki_region_travel_times_to_railway_station.gpkgをaccessibility_gridに読み込みます。car_r_tが-1の場合は、非数(NaN)に置き換えします。
import geopandas as gpd
import numpy

accessibility_grid = gpd.read_file(DATA_DIRECTORY / "helsinki_region_travel_times_to_railway_station.gpkg")

accessibility_grid["car_r_t"] = accessibility_grid["car_r_t"].replace(-1, numpy.nan)

accessibility_grid.head(10)

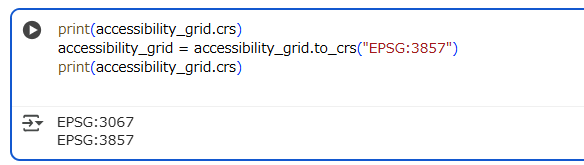
accessibility_gridのCRSを、Webメルカトルにします。
print(accessibility_grid.crs)
accessibility_grid = accessibility_grid.to_crs("EPSG:3857")
print(accessibility_grid.crs)
あとでインポートするmapclassifyとcontextilyをインストールします。
! pip install mapclassify
! pip install contextily
Web Feature Serviceから、道路ネットワークを、roadsに読み込みます。
import ssl
ssl._create_default_https_context = ssl._create_unverified_context

# Web Feature ServiceのURL
WFS_BASE_URL = (
    "https://kartta.hel.fi/ws/geoserver/avoindata/wfs"
    "?service=wfs"
    "&version=2.0.0"
    "&request=GetFeature"
    "&srsName=EPSG:3879"
    "&typeName={layer:s}"
)

# road
roads = (
    gpd.read_file(
        WFS_BASE_URL.format(layer="avoindata:Seutukartta_liikenne_paatiet")
    )
    .set_crs("EPSG:3879")
)

roads.head()

roadsのCRSを、Webメルカトルにします。
print(roads.crs)
roads = roads.to_crs("EPSG:3857")
print(roads.crs)

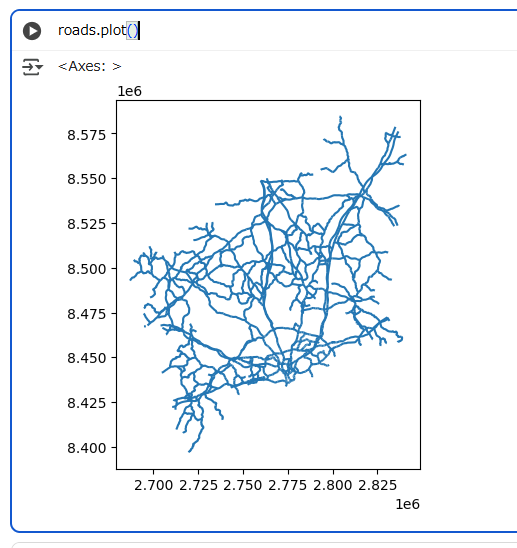
ちょっとだけ脱線して、roadsをプロットしてみます。これだけだとよくわかりませんね。
各レイヤーをまとめてプロットします。
import contextily
import matplotlib.pyplot as plt

# figはpngファイルを保存するときに使用する
fig, ax = plt.subplots(figsize=(15, 15))

# グリッドセルは60分以内のみ
accessibility_grid_within_60 = accessibility_grid[
   accessibility_grid.car_r_t <= 60
]

# グリッドセルを自然分類で4つに分類、凡例ありで重畳、ベースマップが見えるように透過させる
accessibility_grid_within_60.plot(
    ax=ax,
    column="car_r_t",
    scheme="NaturalBreaks",
    k=4,
    cmap="Spectral",
    linewidth=0,
    alpha=0.7,

    legend=True,
    legend_kwds={"title": "Travel time (min)"}
)

# 道路ネットワークを重畳
roads.plot(ax=ax, color="black", linewidth=2)

# ベースマップを重畳、帰属情報も入れる
contextily.add_basemap(
    ax=ax,
    source=contextily.providers.OpenStreetMap.Mapnik,
    attribution=(
        "Travel time data (c) Digital Geography Lab, "
        "map data (c) OpenStreetMap contributors"
    )
)

# グリッドセルのサイズでトリミング
minx, miny, maxx, maxy =accessibility_grid_within_60.total_bounds
ax.set_xlim(minx, maxx)
ax.set_ylim(miny, maxy)
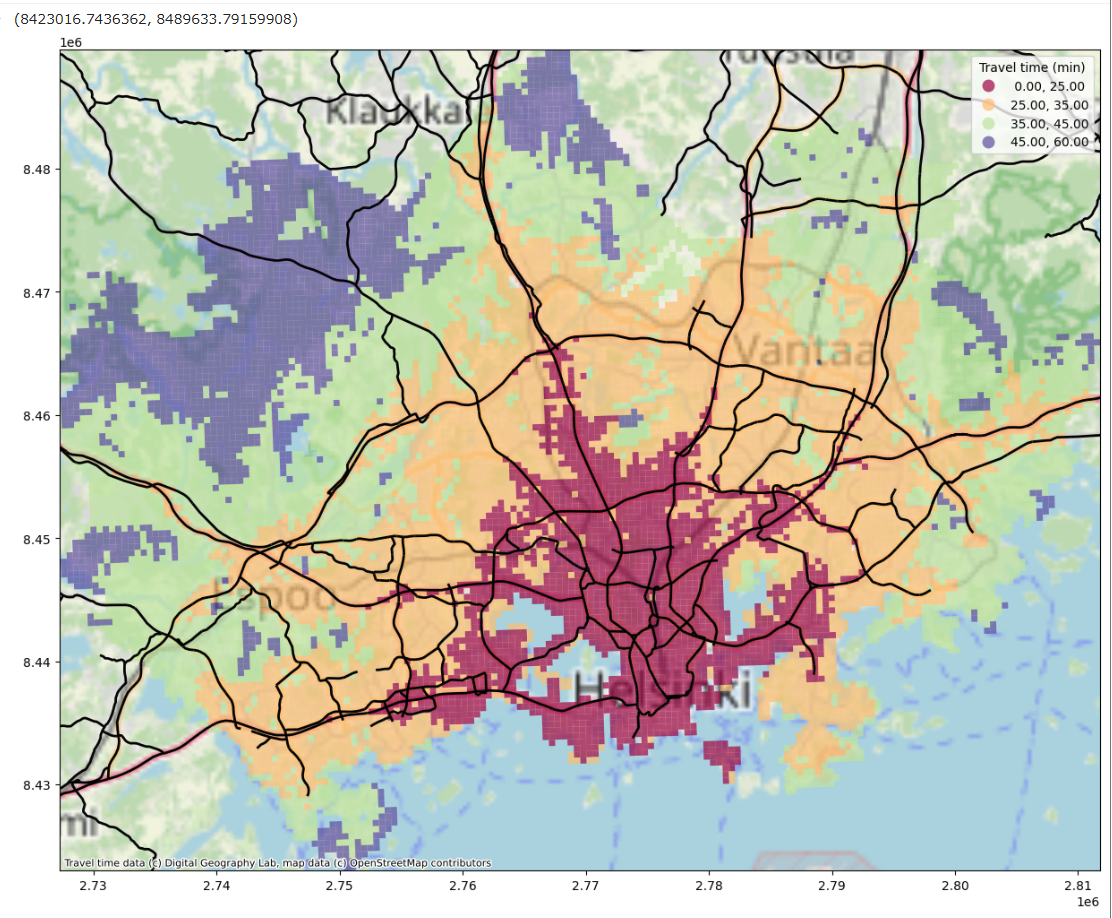
道路ネットワークが密な場所は移動時間が少なく、過疎な場所は移動時間が多い、という妥当な結果になっています。
最後に、accessibility_map.png"ファイルとして保存します。
fig.savefig(OUTPUT_DIRECTORY/"accessibility_map.png", dpi=300)

以上です。