本稿は TeX & LaTeX Advent Calendar 2019 の17日目の記事です.
16日目は muscle_keisuke さんによる「日本列島をLaTeXで表示させたかったのでSVGをTikZに変換するプログラムを作った」でした.
17日目は @Xs_TeX さんによる「LaTeXで目次のカスタマイズをしてみた」です.
2日連続でTikZネタです.
TeX & LaTeX Advent Calendar は今年が初参加ですが, 初参加のくせに2回投稿させていただきました.
1個目は「xfakebold.styの紹介」でした (宣伝).
はじめに
「インスタ映え」という言葉が定着して久しいですが, いまや様々なコンテンツで「映え (ばえ)」を意識する時代となりました.
これからの時代, 映えないコンテンツは衰退していくと言っても過言ではないでしょう.
では, LaTeXというコンテンツはどうでしょうか.
真っ黒な論文, 淡々と書かれたスライド, ゆきだるまを崇拝する謎の文化, などなど, LaTeXは映えとは程遠い存在です.
そこで本稿では, LaTeXの数式をインスタスライド映えさせることを考えます.
使うツールは, おなじみの TikZ (CTAN) と tcolorbox (CTAN) です.
特に, tcolorbox の theorems ライブラリに含まれる \tcboxmath というコマンドを使います.1
tcolorobx については必要な部分を説明しますが, TikZについてはいちいち説明しません. すなわち, TikZの知識は仮定します.
適宜, 以下のページなどを参照してください. 実際のところ, 本稿だけでも雰囲気はわかるのでは, と思います.
...という記事を書くつもりでしたが, 時間がなかったので, ソースと出力結果だけ列挙します.
詳しくはTikZやtcolorboxのマニュアルを参照してください.
\tcboxmath の基本的な使い方
プリアンブルで
\usepackage{tcolorbox}
\tcbuselibrary{theorems}
とすると, コマンド \tcboxmath が使えるようになります.
このコマンドは, 次のように使います.
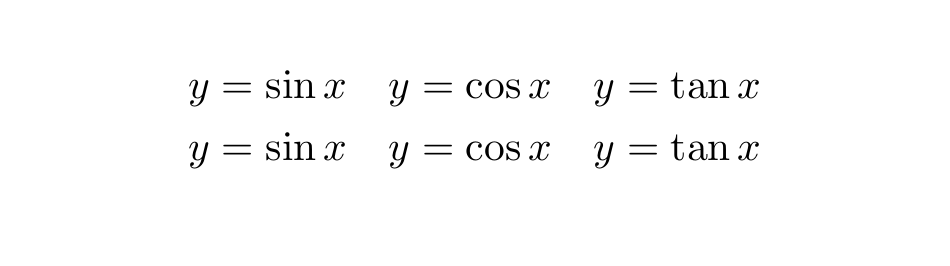
\[
    y = \sin x \quad
    \tcboxmath{y = \cos x} \quad
    y = \tan x
\]
出力:
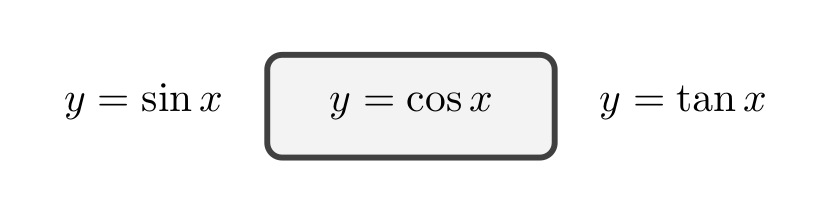
色や余白は, \tcboxmath[オプション]{数式} という形でオプションを書くことで調整します.
オプションの部分には, tcolorbox パッケージで使えるオプションが使えます.
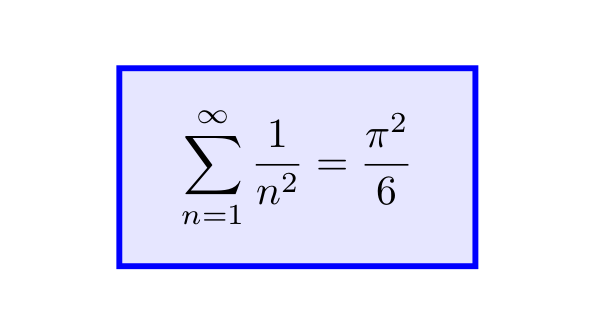
箱の色を調整する
\[
    \tcboxmath[
        colback=blue!10,   % 背景の色
        colframe=blue,     % 枠の色
        sharp corners,     % 角を直角に
    ]{
        \sum_{n=1}^\infty \frac{1}{n^2} = \frac{\pi^2}{6}
    }
\]
出力:
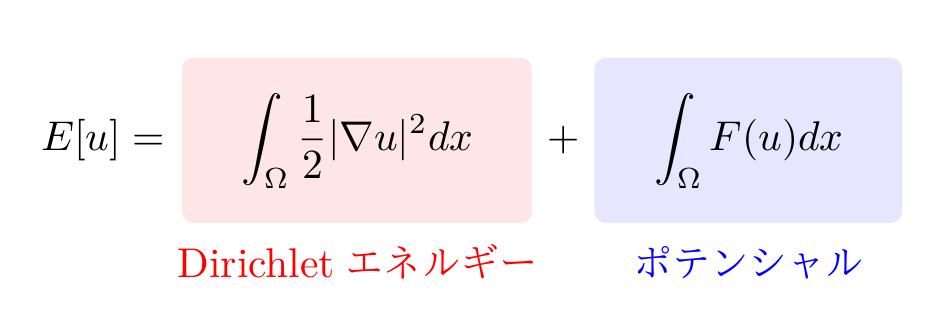
文字を後付けする
skins という tcolorbox のライブラリを読み込み, enhanced というオプションと同時に用いると, overlay={TikZのコマンド} というオプションを使えるようになります.
overlay オプションの引数の中は, tikzpicture 環境と同じ状況になります.
また, その中では, \tcboxmath で囲んだ数式が tikzpicture 環境内のnodeとして扱われ, frame という名前で利用できます.
言葉で説明するより, 例を見た方が早いと思います:
% \tcbuselibrary{theorems,skins} をプリアンブルに

\[
    E[u] =
    \tcboxmath[
        enhanced,         % これは必須
        frame hidden,     % 枠を消す. これも enhanced 必須
        colback=red!10,
        overlay={
            \node[below,red] at (frame.south) {Dirichletエネルギー};
        }
    ]{
        \int_\Omega \frac{1}{2} |\nabla u|^2 dx
    } +
    \tcboxmath[
        enhanced,
        frame hidden,
        colback=blue!10,
        overlay={
            \node[below,blue] at (frame.south) {ポテンシャル};
        }
    ]{
        \int_\Omega F(u) dx
    }
\]
出力:
スタイルに名前をつける
上の例では, 2つの箱でほとんど同じオプションが使われています.
コマンドを \newcommand で作るように, スタイルにも名前をつけることができると, とても便利です.
\tcbset というコマンドを用いると, これを実現できます.
\tcbset{名前/.style={好きなオプション}} という使い方をします.
オプションの中には引数を1つだけ入れることができます.
また, 引数のデフォルト値を定めることもできます.
この辺は, 例を見てもらった方が早いです:
% プリアンブルに
\tcbset{
    % colorbox というスタイルを作る
    colorbox/.style={
        enhanced,
        frame hidden,
        colback=#1,         % 背景色を変数に
        rounded corners
    },
    % 背景色のデフォルト値を指定
    colorbox/.default=red!10
}

% 本文
\[
    E[u] =
    \tcboxmath[
        colorbox,
        overlay={
            \node[below,red] at (frame.south) {Dirichletエネルギー};
        }
    ]{
        \int_\Omega \frac{1}{2} |\nabla u|^2 dx
    } +
    \tcboxmath[
        colorbox=blue!10,
        overlay={
            \node[below,blue] at (frame.south) {ポテンシャル};
        }
    ]{
        \int_\Omega F(u) dx
    }
\]
(出力は上と同じ)
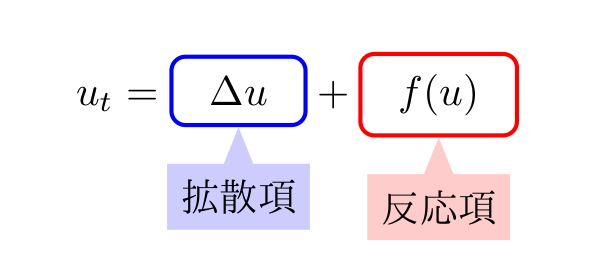
もう1つ例を見せます.
プリアンブルに
\usepackage{tikz}
\usetikzlibrary{shapes}
も書いておくと, 次のようなことができます2:
% \tcbuselibrary{theorems,skins}

\tcbset{
    framebox/.style={
        enhanced,
        boxsep=0pt,       % 箱の上下左右の余白を指定
        colback=white,
        boxrule=1pt,
        colframe=#1
    },
    framebox/.default=red
}
\newcommand{\calloutbox}[3]{
    \tcboxmath[
        framebox=#2,
        top=1ex,bottom=1ex,    % 箱の上下の余白を指定
        left=2ex,right=2ex,    % 箱の左右の余白を指定
        overlay={
            \node[
                below,
                rectangle callout,                         % nodeを吹き出しの形に
                callout absolute pointer={(frame.south)},  % 吹き出しの先端を絶対的に指定
                fill=#2!20
            ] at ([yshift=-2ex]frame.south) {#3};
        }
    ]{#1}
}

\[
    u_t =
    \calloutbox{\Delta u}{blue}{拡散項}
    +
    \calloutbox{f(u)}{red}{反応項}
\]
出力:
余白を無くす
デフォルトでは結構余白が入ってしまいますが, 以下のようにすると余白を無くすことができ, あたかもそこには何も無いような状態を作ることができます.
% \tcbuselibrary{theorems,skins}

\begin{gather*}
    y = \sin x \quad
    \tcboxmath[
        enhanced,
        frame hidden,      % 枠を消す
        interior hidden,   % 背景を消す
        size=minimal       % 余白を消す
    ]{y = \cos x} \quad
    y = \tan x \\
    y = \sin x \quad y = \cos x \quad y = \tan x
\end{gather*}
出力:
これを利用すると, 「普通の数式が何か色々と装飾された状態」を作ることができます.
以下, しばらくこのような例が続きます.
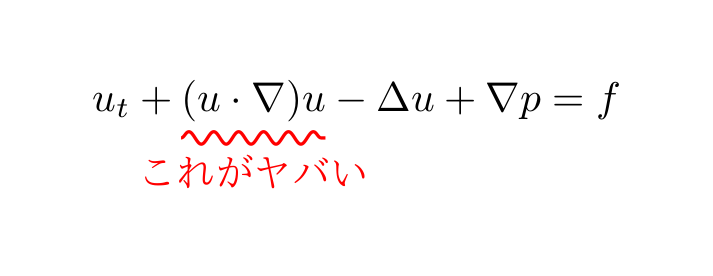
数式の下に波線を引く
プリアンブルで
\usepackage{tikz}
\usetikzlibrary{decorations,decorations.pathmorphing}
としておくと, 線を色々と変えることができます.
例えば, 以下のようにすると, 波線が引けます.
% \tcbuselibrary{theorems,skins} も書く

\[
    u_t +
    \tcboxmath[
        enhanced,
        frame hidden,
        interior hidden,
        size=minimal,
        overlay={
            \draw[
                red,
                thick,
                decorate,
                decoration={
                    snake,               % 波線を引く
                    amplitude=1.5pt,     % 波線の振幅
                    segment length=6pt   % 波線の周期
                }
            ] ([yshift=-4pt]frame.south west) -- ([yshift=-4pt]frame.south east)
            node[midway,below] {これがヤバい};
        }
    ]{(u \cdot \nabla) u}
    -\Delta u
    + \nabla p = f
\]
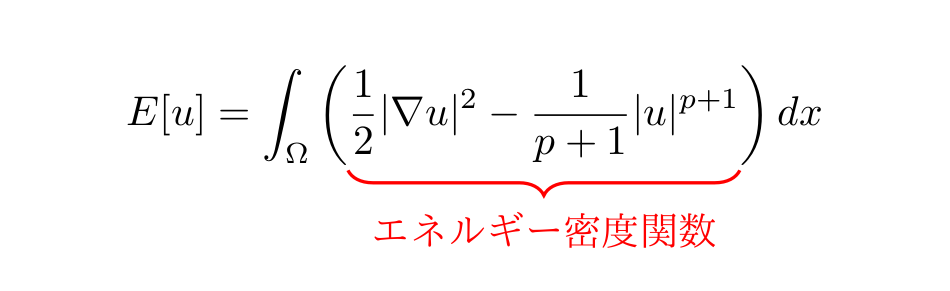
数式の下に中括弧
\underbrace というコマンドで数式の下に中括弧を書くことができますが, このコマンドの弱点は, カッコだけに色を付けるのが面倒ということと, このコマンドを \left( ... \right) 等のカッコで囲むと, カッコの長さがアホみたいに長くなってしまうことです.
中括弧をTikZで書いてしまえば, この点を解決することができます.
プリアンブルに
\usepackage{tikz}
\usetikzlibrary{decorations,decorations.pathreplacing}
と書いておくと, 以下のようなことができます.
% \tcbuselibrary{theorems,skins} も書く

\[
    E[u] = \int_\Omega \left(
        \tcboxmath[
            enhanced,
            frame hidden,
            interior hidden,
            size=minimal,
            overlay={
                \draw[
                    red,
                    thick,
                    decorate,
                    decoration={
                        brace,            % 中括弧を書く
                        amplitude=6pt,    % 中括弧がとがる幅
                        raise=2pt         % 中括弧をズラす
                    }
                ] (frame.south east) -- (frame.south west)
                    node[midway,below=8pt] {エネルギー密度関数};
            }
        ]{
            \frac{1}{2} |\nabla u|^2 - \frac{1}{p+1} |u|^{p+1}
        }
    \right) dx
\]
出力:
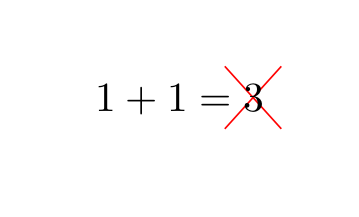
数式にバツを書く
もっと楽にやる方法があるとは思いますが...
% \tcbuselibrary{theorems,skins}

\[
    1 + 1 =
    \tcboxmath[
        enhanced,
        frame hidden,
        interior hidden,
        size=minimal,
        overlay={
            \draw[red]
                ([shift={(1ex,-1ex)}]frame.south east)
                -- ([shift={(-1ex,1ex)}]frame.north west)
                ([shift={(-1ex,-1ex)}]frame.south west)
                -- ([shift={(1ex,1ex)}]frame.north east);
        }
    ]{3}
\]
出力:
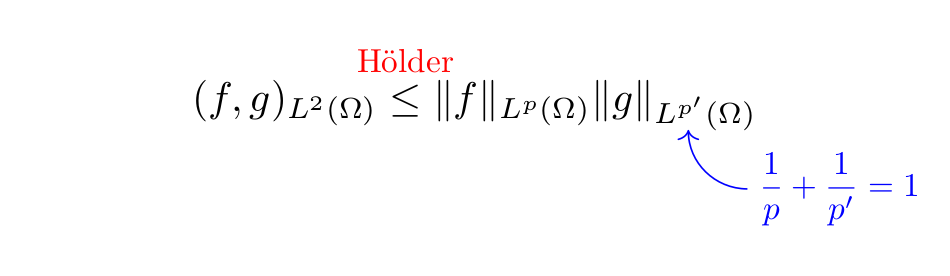
数式の上下に文字を書く
% \tcbuselibrary{theorems,skins}

\[
    (f,g)_{L^2(\Omega)}
    \mathrel{
        \tcboxmath[
            enhanced,
            frame hidden,
            interior hidden,
            size=minimal,
            overlay={
                \node[red,above,scale=0.8] at (frame.north) {H\"older};
            }
        ]{\le}
    }
    \| f \|_{L^p(\Omega)}
    \tcboxmath[
        enhanced,
        frame hidden,
        interior hidden,
        size=minimal,
        overlay={
            \draw[<-,blue] (frame.300) to[out=-90,in=180] +(5mm,-5mm)
                node[right,scale=0.8] {$\dfrac{1}{p} + \dfrac{1}{p'} = 1$};
        }
    ]{
        \| g \|_{L^{p'}(\Omega)}
    }
\]
出力:
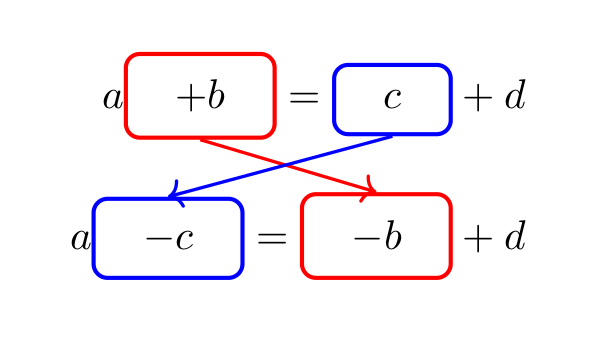
他の \tcboxmath を参照する
skins パッケージを読み込むと, remember as というオプションを使うこともできます.
remember as=名前 とすることで, 他の \tcboxmath コマンド内や, remember picture オプションを読み込ませた tikzpicture 環境内で同じnodeを用いることができます.
これも例を見た方が早いです.
% \tcbuselibrary{theorems,skins}

\tcbset{
    framebox/.style={
        enhanced,
        boxsep=0pt,
        colback=white,
        boxrule=1pt,
        colframe=#1
    },
    framebox/.default=red
}

\begin{align*}
    a
    \tcboxmath[
        framebox,
        remember as=t1
    ]{
        +b
    }
    =
    \tcboxmath[
        framebox=blue,
        remember as=t2
    ]{
        c
    }
    + d
    \\[2ex]
    a
    \tcboxmath[
        framebox=blue,
        remember as=t3
    ]{
        -c
    }
    =
    \tcboxmath[
        framebox,
        remember as=t4
    ]{
        -b
    }
    + d
\end{align*}

% 外のtikzpicture環境で再利用
\begin{tikzpicture}[remember picture,overlay]
    \draw[red,thick,->] (t1.south) -- (t4.north);
    \draw[blue,thick,->] (t2.south) -- (t3.north);
\end{tikzpicture}
出力:
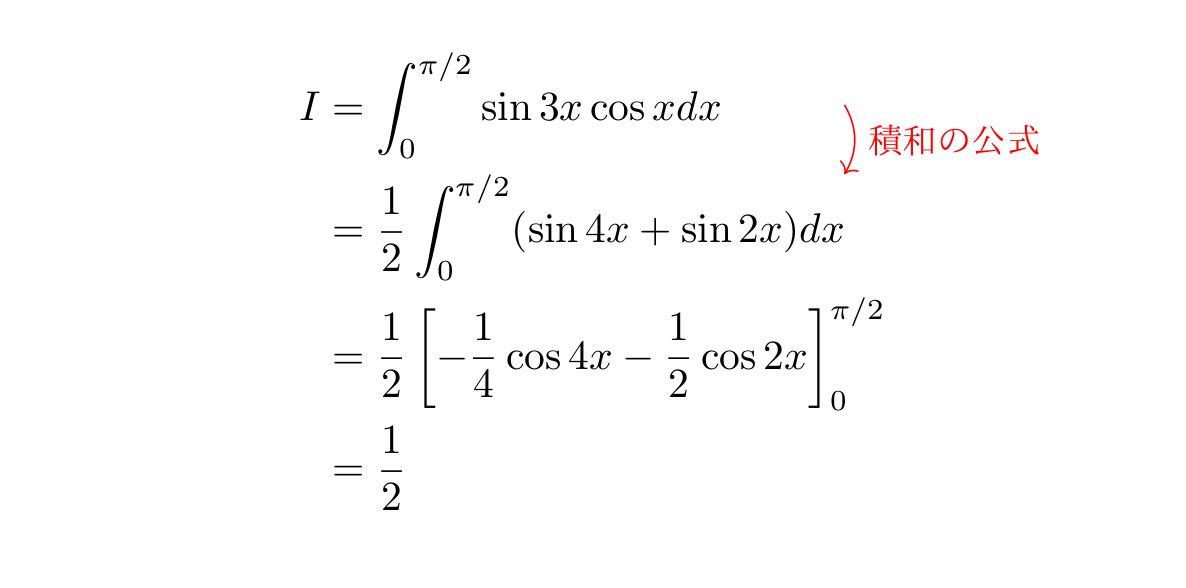
もう1つ例を見せます:
% \tcbuselibrary{theorems,skins}

\tcbset{
    ghostbox/.style={
        enhanced,
        frame hidden,
        interior hidden,
        size=minimal,
        remember as=#1
    }
}
\begin{align*}
    I &= \tcboxmath[ghostbox=t1]{\int_0^{\pi/2} \sin 3x \cos x dx} \\
      &= \tcboxmath[ghostbox=t2]{\frac{1}{2} \int_0^{\pi/2} (\sin 4x + \sin 2x) dx} \\
      &= \frac{1}{2} \left[ - \frac{1}{4} \cos 4x - \frac{1}{2} \cos 2x \right]_0^{\pi/2} \\
      &= \frac{1}{2}
\end{align*}

\begin{tikzpicture}[overlay,remember picture]
    \draw[->,red] (t1.east-|t2.east) to[bend left]
        node[midway,right,scale=0.9] {積和の公式} (t2.north east);
\end{tikzpicture}
出力:
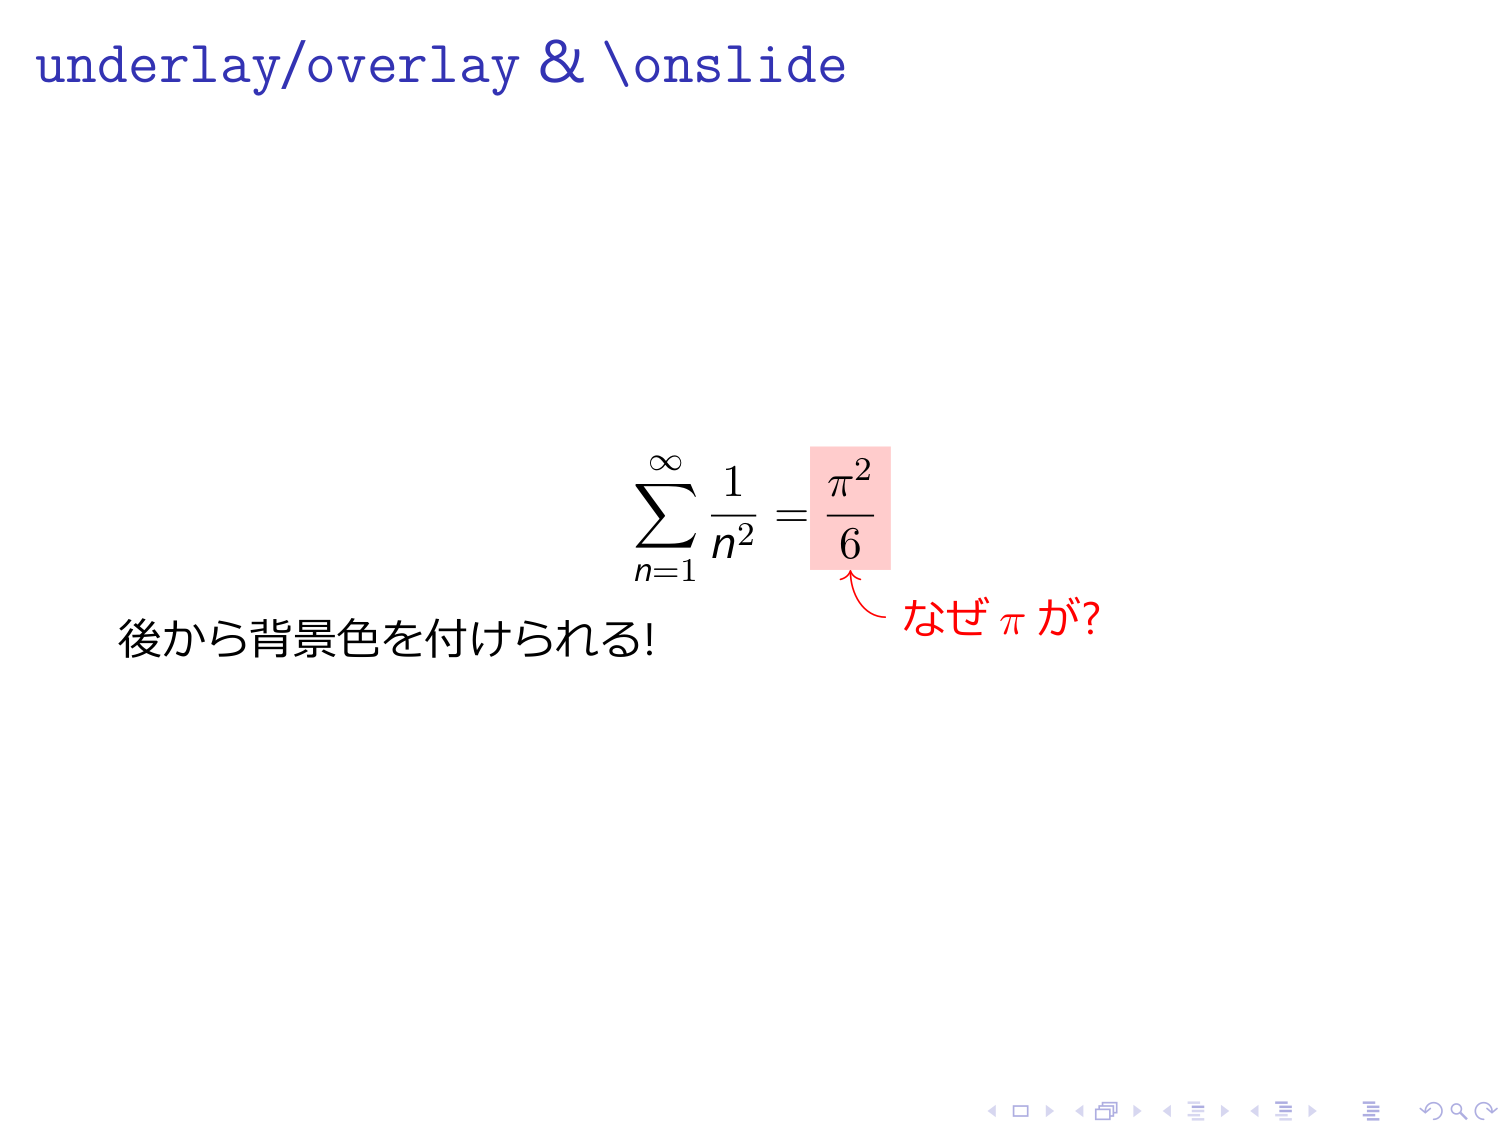
beamer の \onslide コマンドと組み合わせる
冒頭で「スライド映え」と言いました. beamer での利用を考えてみましょう.
先の overlay オプション内では, beamer の \onslide コマンドを利用することができます.
また, overlay だけでなく, underlay というオプションもあります.
これは, 書いて字の如くですが, 数式の下に TikZ の図を出力することができます.
overlay や underlay と \onslide を組み合わせると, 「数式の位置を変えずに後から枠線や背景色をつける」ということが可能になります.
% プリアンブル
\documentclass{beamer}

\usepackage{tikz}
\usepackage{tcolorbox}
\tcbuselibrary{skins,theorems}

% 本文

\begin{frame}{\texttt{underlay}/\texttt{overlay} \& \texttt{\textbackslash onslide}}

\[
    \sum_{n=1}^\infty \frac{1}{n^2} =
    \tcboxmath[
        enhanced,
        frame hidden,
        interior hidden,
        size=minimal,
        underlay={    % 数式の下に色付きの箱を出力
            \onslide<2>{
                \fill[red!20] ([shift={(-1mm,-1mm)}]frame.south west)
                    rectangle ([shift={(1mm,1mm)}]frame.north east);
            }
        },
        overlay={
            \onslide<2>{
                \draw[red,<-] ([yshift=-1mm]frame.south) to[out=-90,in=180] +(3mm,-4mm)
                    node[right] {なぜ$\pi$が?};
            }
        }
    ]{\frac{\pi^2}{6}}
\]
\onslide<2>{後から背景色を付けられる!}

\end{frame}
出力:
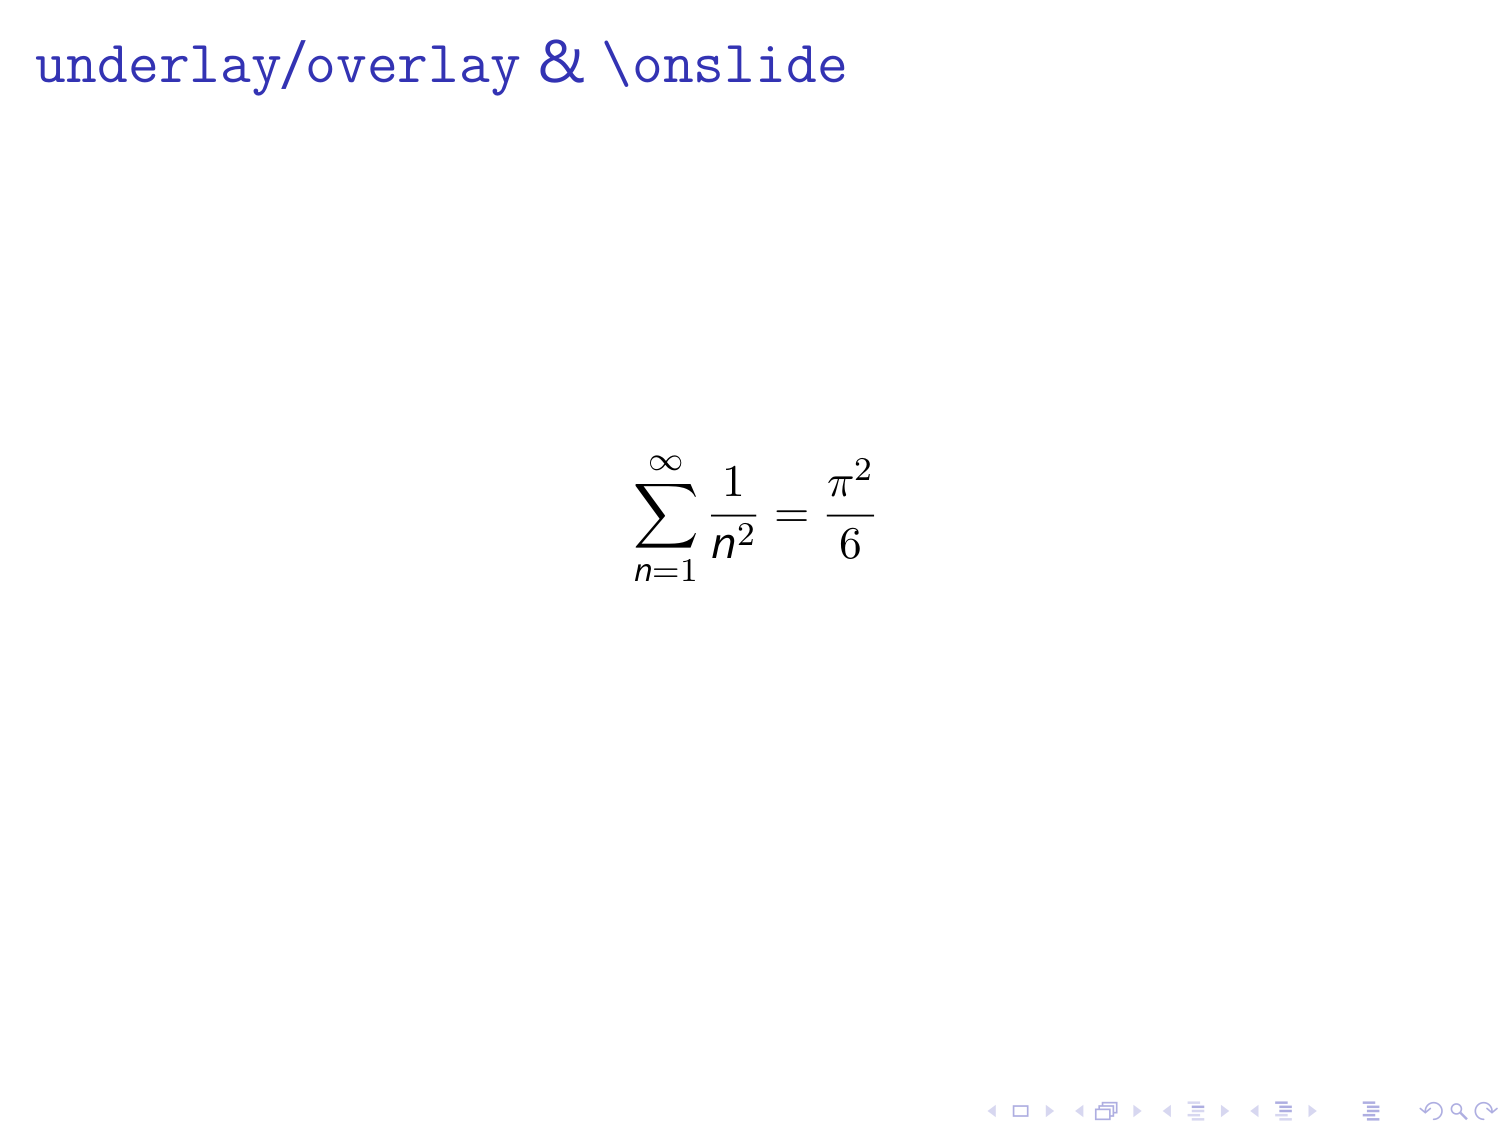
↓
tcolorboxを使うメリット
以下のような意見をいただきました:
TikZが得意な方にとってはTikZのみでやるのと比べてさほど旨味はないと思います (cf. TikZ — Tasuku Soma's webpage).
いくつかメリットを挙げるとすれば, ベースラインの設定を自動でやってくれること, 数式モード内でそのまま使えること, などが挙げられるかと思います.
終わりに
スライドの見た目の調整に時間を費やしてる暇があったら, その時間で研究してスライドの中身をブラッシュアップした方が良いと思います.