OpenTelemetry Advent Calendar 2022、13日目の記事です
OpenTelemetryはインフラ監視にも使えちゃうぜ、というお話
OpenTelemetryと言えば分散トレーシングが注目されますが、用途はそれだけではなく、アプリが乗っているインフラやミドルウェアにも難なく適用できます。
今までホストはZabbixとかで監視してたけどクラウド移行 / コンテナ化するし、なんかマイクロサービスとかの噂も聞こえ始めてるけど、このままでいいのかな、、、と悩めるインフラエンジニアにご参考になれば幸いです。
早速Otelインストール
OtelはDocker、Kubernetes、Linux、Windows、MacOSなどに対応しています。
今回は機能拡張版のOtel Collector Contrib版を使います。
Linuxの場合は各パッケージが提供されています。
※後続でデータをSplunk Observability Cloudに送信しています。本家のOtelでもいいですが、SplunkのOtel Distributionを使うともっと便利です。
とりあえずUbuntuにインストールしたいと思います。
※今回は手動でOtelをインストールしますが、もちろんAnsibleやPuppetなどで配布することもできます。
wget https://github.com/open-telemetry/opentelemetry-collector-releases/releases/download/v0.67.0/otelcol-contrib_0.67.0_linux_amd64.deb
sudo apt install ./otelcol-contrib_0.67.0_linux_amd64.deb -y
これだけ。
お次はメトリクスの送信設定です。
Contrib版は/etc/otelcol-contrib/config.yamlに書いていきます。
Otelを初めて使う方は設定方法に面食らうと思います。
詳細は他の方の記事に譲りますが、OtelはReceiver(データ収集)、Processor(データ処理)、Exporter(データ送信)の三つのコンポーネントからなります。
それらの定義をconfig.yamlに書けばOKです。
Receiver
Receiver一覧はこちら。
Hostに関してはHostmetrics Receiverというものが使えます。CPU、メモリ、ディスク、プロセスなどに関するメトリクスを収集できます。フィルタなどかけられますが、とりあえずフルコースで収集します。
receivers:
  hostmetrics:
    collection_interval: 10s
    scrapers:
      cpu:
      disk:
      load:
      filesystem:
      memory:
      network:
      paging:
      processes:
      process:
Processor
Processor一覧はこちら。
お次はProcessorです。
Processorはなくても動くには動きます。しかしデフォルトではホスト名すら取ってくれない仕様なので、いい感じにリソース情報を取ってくれるResource Detection Processorを使います。
processors:
  resourcedetection:
    detectors: [ec2]
今回はEC2上のubuntuを使っているのでec2を指定しました。これにより以下情報を自動で収集しメトリクスにDimentionとして付与してくれます。
* cloud.provider ("aws")
* cloud.platform ("aws_ec2")
* cloud.account.id
* cloud.region
* cloud.availability_zone
* host.id
* host.image.id
* host.name
* host.type
Exporter
Exporter一覧はこちら。
最後にデータの送信先です。今回はSignalFx Metrics Exporterを使い、Splunk Observability Cloudに送信します。
exporters:
  signalfx:
    access_token: "*****"
    realm: "*****"
ちなみにOtelの特長は、宛先はOtelに対応しているツールであれば何でもいい所です。
対応ベンダー一覧にある通り、GrafanaでもElasticでも良いです。
Exporterの設定さえ変えてあげればReceiver、Processorに手を加える必要はありません。
Pipeline
これまで行ってきたのは、それぞれの定義のみです。
定義を使用するにはPipelineを組み立てます。
service:
  pipelines:
    metrics:
      receivers: [otlp, opencensus, prometheus, hostmetrics]
      processors: [batch, resourcedetection]
      exporters: [signalfx]
上記の通り、これまで定義してきたReceiver、Processor、Exporterの定義名を指定しています。
デフォルトで入っているものはとりあえず残しています。
これでconfig.yamlは完成です。
設定有効化
Otelを再起動して有効化します。
sudo systemctl restart otelcol-contrib
ログは以下で見れます。
sudo journalctl | grep otelcol-contrib
見てみる
Splunk Observability CloudのInfrastructure Monitoringで確認すると、、、
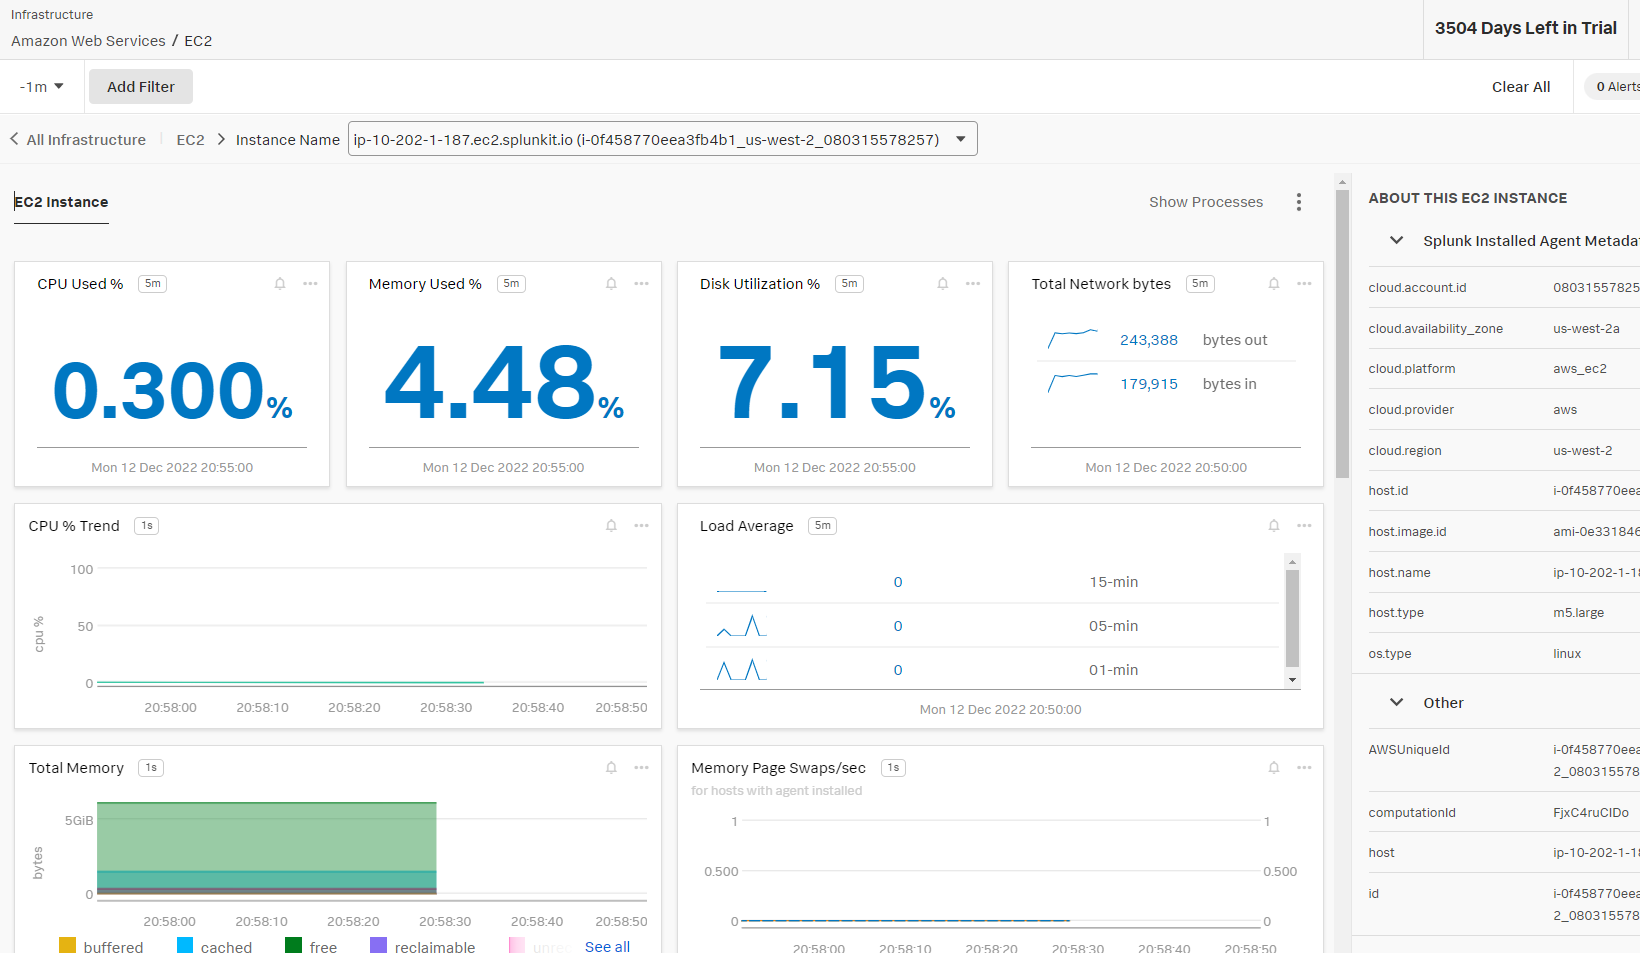
素晴らしい!
ついでにミドルウェアも
Nginxが稼働しているとして、Nginxのメトリクスも収集したいと思います。
Nginx Receiverの出番です。
Nginx用のReceiver定義を作りPipelineのreceiversに追加します。
receivers:
  nginx:
    endpoint: "http://localhost:80/status"
    collection_interval: 10s

service:
  pipelines:
    metrics:
      receivers: [otlp, opencensus, prometheus, hostmetrics, nginx]
      processors: [batch, resourcedetection]
      exporters: [signalfx]
Otel再起動すると、、、
sudo systemctl restart otelcol-contrib
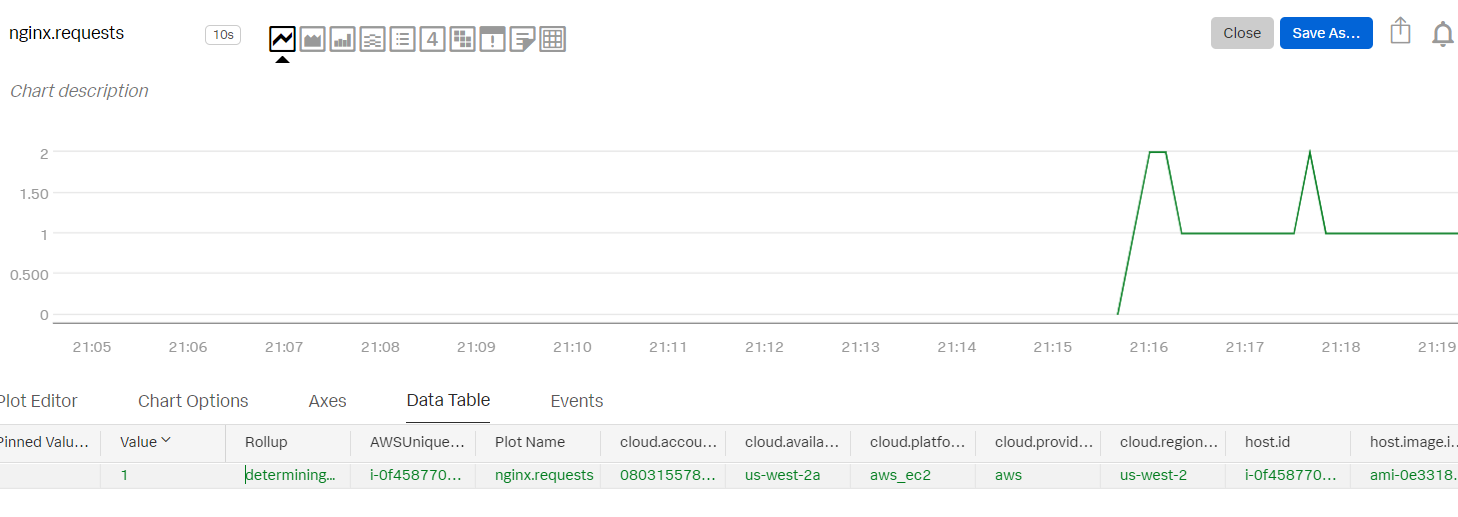
素晴らしい!!!
最後に、今回作ったconfig.yamlの全体像です。
※今回特に触れていなかったデフォルトの設定も入っています。
extensions:
  health_check:
  pprof:
    endpoint: 0.0.0.0:1777
  zpages:
    endpoint: 0.0.0.0:55679

receivers:
  otlp:
    protocols:
      grpc:
      http:

  opencensus:

  # Collect own metrics
  prometheus:
    config:
      scrape_configs:
      - job_name: 'otel-collector'
        scrape_interval: 10s
        static_configs:
        - targets: ['0.0.0.0:8888']

  jaeger:
    protocols:
      grpc:
      thrift_binary:
      thrift_compact:
      thrift_http:

  zipkin:

  hostmetrics:
    collection_interval: 10s
    scrapers:
      cpu:
      disk:
      load:
      filesystem:
      memory:
      network:
      paging:
      processes:
      process:

  nginx:
    endpoint: "http://localhost:80/status"
    collection_interval: 10s

processors:
  batch:

  resourcedetection:
    detectors: [ec2]

exporters:
  logging:
    logLevel: debug

  signalfx:
    access_token: "*****"
    realm: "*****"

service:

  pipelines:

    traces:
      receivers: [otlp, opencensus, jaeger, zipkin]
      processors: [batch]
      exporters: [logging]

    metrics:
      receivers: [otlp, opencensus, prometheus, hostmetrics, nginx]
      processors: [batch, resourcedetection]
      exporters: [signalfx]

  extensions: [health_check, pprof, zpages]
それで何?
Otelの真骨頂は、いわゆるオブザーバビリティ三本柱のMetrics、Trace、Logを一手に賄えることにあります。
アプリと同様にインフラ部分のメトリクスもOtelで取って、同じバックエンドに送ってあげれば、トラブルシューティング時にアプリ側の問題なのかインフラ側の問題なのか瞬時に切り分けることができます(もちろん、バックエンドでそのような相関分析の機能があればですが)。
※ログと言えば、Advent Calendar一日目のOpenTelemetry Collectorでログファイルの更新を取り込むも参考になります。
それでは良いOtelライフを!