はじめに
-
USGS(アメリカ地質調査所)より震源データが公開されていますので、deck.glのScatterplotLayerとHeatmapLayerを用いて、震源データのヒートマップを表示してみました。
-
USGSの震源データは、APIにて取得しています。
API Documentation - Earthquake Catalog -
背景地図にはMapboxを使用しているため、Mapboxにてアクセストークンの取得が必要になります。
アウトプットイメージ
Day 1 of #30DayMapChallenge - Points
— shi_works☀ (@syanseto) November 1, 2022
Earthquakes of magnitude 2.5 and above(1967 - 2021)
Data source: U.S. Geological Survey(https://t.co/r8XTlJu0dQ)#deckgl #Mapbox pic.twitter.com/aEaCaR19n1
震源データの取得
- USGSの震源データは、APIにて取得しています。
- Pythonのコードと対象期間リストは、以下のとおりです。
- 1回あたりのクエリは20,000に制限されているため、適宜、対象期間リストの期間を調整してください。
- リクエストの際のパラメータは、マグニチュード2.5以上としています。
python
# -*- coding: utf-8 -*-
import csv
import requests

# 対象期間リストを作成する
list = []

# csvファイルの読み込み
with open(r'D:\GIS\USGS\Start_End.csv') as f:
    header = next(csv.reader(f))
    for row in csv.reader(f):
        s = row[0]
        e = row[1]
        list.append([s, e])

print(list)

# 対象期間リストでループ
for i in range(len(list)):
    # URL作成
    # APIドキュメント:https://earthquake.usgs.gov/fdsnws/event/1/
    url = "https://earthquake.usgs.gov/fdsnws/event/1/query.csv?starttime=" + \
        list[i][0] + "%2000:00:00&endtime=" + list[i][1] + \
        "%2023:59:59&minmagnitude=2.5&orderby=time"

    # APIリクエスト
    raw_response = requests.get(url)

    # 出力CSVファイルオープン
    output_csvfile = "D:/GIS/USGS/data_5/query-" + \
        list[i][0] + "-" + list[i][1] + ".csv"
    with open(output_csvfile, 'w', encoding='utf-8') as f:
        # CSVファイルに書き込む
        text_list = []
        text_list = raw_response.text
        for text in text_list:
            f.write(text)

print(u'処理終了')
対象期間リスト
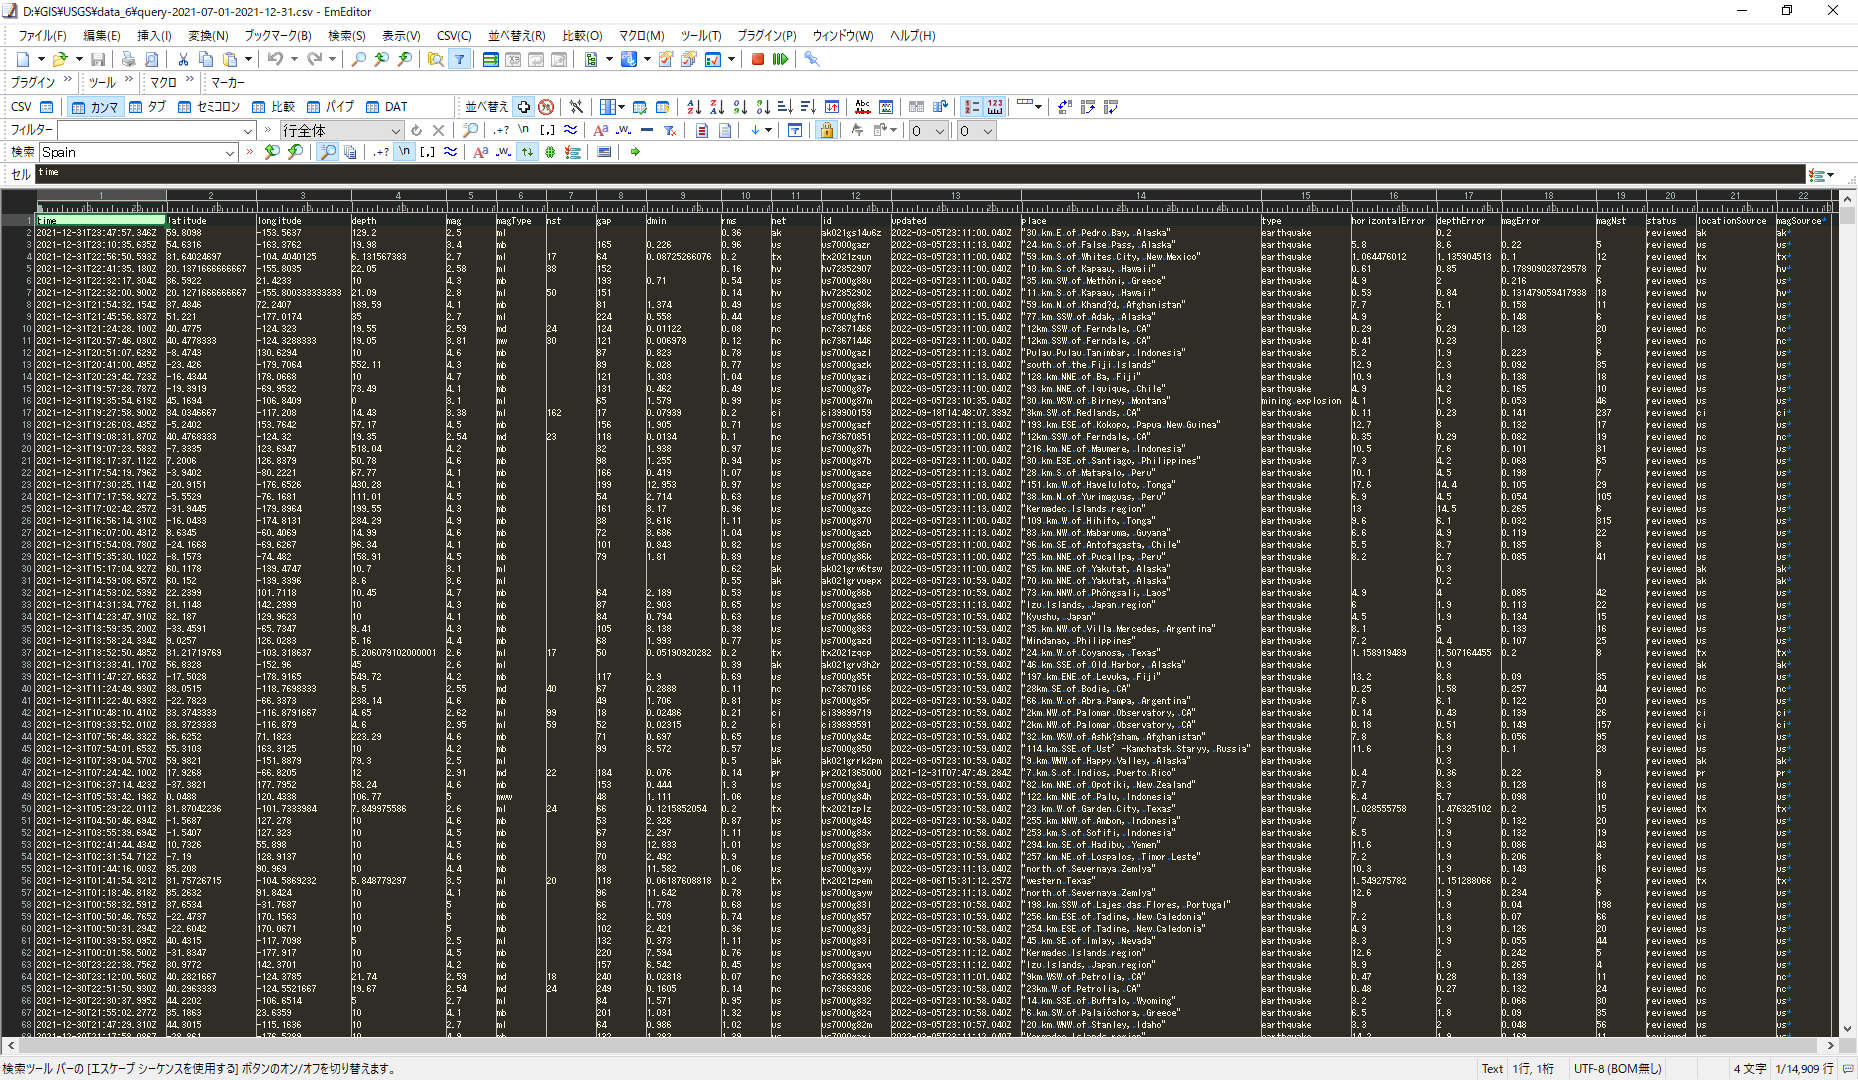
震源データの取得結果
震源データをdeck.glで表示
- deck.glのScatterplotLayerとHeatmapLayerを用いて、震源データを表示します。
- 背景地図にはMapboxを使用しているため、Mapboxにてアクセストークンの取得が必要になります。
html
<html>
<head>
  <title>USGS(アメリカ地質調査所)地震データ(1967~2021年)</title>
  <meta charset="UTF-8">
  <script src="https://unpkg.com/deck.gl@^7.0.0/dist.min.js"></script>
  <script src="https://d3js.org/d3.v5.min.js"></script>
  <script src="https://api.tiles.mapbox.com/mapbox-gl-js/v0.50.0/mapbox-gl.js"></script>
  <link rel="stylesheet" href="style.css?20221018" />
</head>

<body>
  <div id="control-panel">
    <div>
      <label>Intensity</label>
      <input id="intensity" type="range" min="0" max="5" step="0.1" value="1"></input>
      <span id="intensity-value"></span>
    </div>
    <div>
      <label>RadiusPixels</label>
      <input id="radiusPixels" type="range" min="1" max="250" step="1" value="50"></input>
      <span id="radiusPixels-value"></span>
    </div>
    <div>
      <label>Threshold</label>
      <input id="threshold" type="range" min="0" max="1" step="0.01" value="0.25"></input>
      <span id="threshold-value"></span>
    </div>
    <div>
      <label>opacity</label>
      <input id="opacity" type="range" min="0" max="1" step="0.01" value="1"></input>
      <span id="opacity-value"></span>
    </div>
  </div>
  <script src="script.js?20221018"></script>
</body>
</html>
CSS
html,body {
  font-family: Helvetica, Arial, sans-serif;
  width: 100vw;
  height: 100vh;
  margin: 0;
}
.deck-tooltip {
  font-family: Helvetica, Arial, sans-serif;
  padding: 6px !important;
  margin: 8px;
  color: #ffffff;
  background-color: #4682b4;
  max-width: 300px;
  font-size: 20px;
}

#control-panel {
  position: absolute;
  top: 0;
  left: 0;
  margin: 12px;
  padding: 20px;
  font-size: 12px;
  line-height: 1.5;
  z-index: 1;
  background: #fff;
  font-family: Helvetica, Arial, sans-serif;
  box-shadow: 0 0 4px rgba(0, 0, 0, 0.15);
}

label {
  display: inline-block;
  width: 140px;
}
JavaScript
- mapboxApiAccessTokenには、取得したアクセストークンを入力してください。
- earthquakes_1967-01-01-2021-12-31_.csvが震源データになります。
const deckgl = new deck.DeckGL({
  mapboxApiAccessToken: 'Mapboxのアクセストークンを入力してください',
  mapStyle: 'mapbox://styles/mapbox/dark-v9',
  initialViewState: {
    latitude: 35.1801494,
    longitude: 136.9034925,
    zoom: 4,
    maxZoom: 18,
  },
  controller: true,
});

const OPTIONS = ['intensity', 'radiusPixels', 'threshold', 'opacity'];

const colorRange = [
  [0, 255, 255, 127],
  [63, 255, 0, 127],
  [255, 255, 0, 127],
  [255, 127, 60, 170],
  [255, 0, 0, 212],
  [152, 0, 38, 255]
];

const earthquakes = d3.csv('data/earthquakes_1967-01-01-2021-12-31_.csv');

const renderLayer = () => {
  const options = {};
  OPTIONS.forEach(key => {
    const value = document.getElementById(key).value;
    document.getElementById(key + '-value').innerHTML = value;
    options[key] = Number(value);
  });

  const heatmapLayer = new HeatmapLayer({
    data: earthquakes,
    id: 'heatmp-layer',
    pickable: false,
    getPosition: d => [Number(d.Longitude), Number(d.Latitude)],
    getWeight: 1,
    radiusPixels: 30,
    intensity: 2.5,
    threshold: 0.1,
    opacity: 0.3,
    ...options
  });

  const scatterplotLayer = new ScatterplotLayer({
    id: 'scatter-plot',
    data: earthquakes,
    radiusUnits: 'meters',
    lineWidthUnits: 'meters',
    radiusScale: 0.1,
    lineWidthScale: 0.5,
    stroked: false,
    filled: true,
    radiusMinPixels: 0.5,
    getPosition: d => [Number(d.Longitude), Number(d.Latitude)],
    getFillColor: d => [240, 240, 240],
    getLineColor: d => [0, 250, 0]
  });

  deckgl.setProps({
    layers: [heatmapLayer, scatterplotLayer]
  });
}

renderLayer();

OPTIONS.forEach(key => {
  document.getElementById(key).oninput = renderLayer;
});
参考文献
https://deck.gl/docs/api-reference/layers/scatterplot-layer
https://deck.gl/docs/api-reference/aggregation-layers/heatmap-layer
https://deck.gl/gallery/
https://github.com/visgl/deck.gl
https://deckgl.readthedocs.io/en/latest/index.html

