はじめに
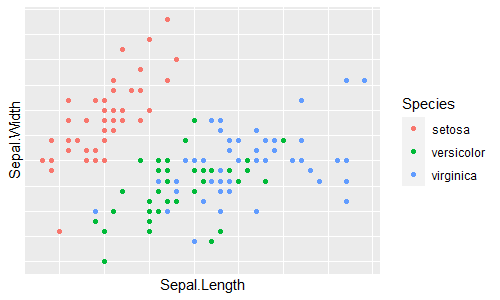
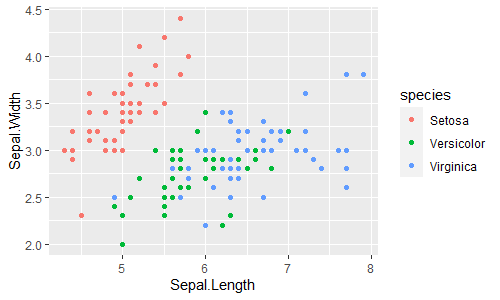
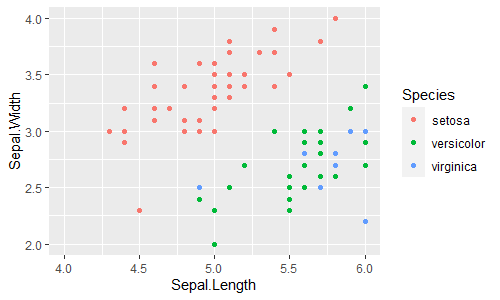
ggplot2 の Cheat Sheet をirisデータの例で試してみました。
CheatSheet:https://github.com/rstudio/cheatsheets/blob/master/data-visualization-2.1.pdf
目次
- データの準備
- Geoms
- Scales
- Coordinate Systems
- Position Adjustments
- Themes
- Faceting
- Labels
- Legends
- Zooming
- Stats
- 参考文献
データの準備
共通して使うデータを先に用意しておきます。
-
iris_id:irisデータに行番号(1~150)"id"とSpeciesごとの行番号(1~50)"id2"を振ったもの -
iris_head3:iris_idからSpeciesごとに先頭3行を取り出したもの(id2が1~3) -
iris_head5:iris_idからSpeciesごとに先頭5行を取り出したもの(id2が1~5) -
iris_head10:iris_idからSpeciesごとに先頭10行を取り出したもの(id2が1~10) -
iris_round:irisのSepal.Length~Petal.Widthをそれぞれ丸めて整数化して因子型にしたもの -
iris_summary:irisのSpeciesごとにSepal.Lengthのmeanとsdを集計したもの
library(tidyverse)

iris_id <- iris %>% as_tibble() %>%
  rowid_to_column("id") %>%
  group_by(Species) %>%
  mutate(id2 = row_number(id)) %>% relocate(id, id2) %>%
  ungroup() %>% print()
# # A tibble: 150 x 7
#       id   id2 Sepal.Length Sepal.Width Petal.Length Petal.Width Species
#    <int> <int>        <dbl>       <dbl>        <dbl>       <dbl> <fct>
#  1     1     1          5.1         3.5          1.4         0.2 setosa
#  2     2     2          4.9         3            1.4         0.2 setosa
#  3     3     3          4.7         3.2          1.3         0.2 setosa
#  4     4     4          4.6         3.1          1.5         0.2 setosa
#  5     5     5          5           3.6          1.4         0.2 setosa
#  6     6     6          5.4         3.9          1.7         0.4 setosa
#  7     7     7          4.6         3.4          1.4         0.3 setosa
#  8     8     8          5           3.4          1.5         0.2 setosa
#  9     9     9          4.4         2.9          1.4         0.2 setosa
# 10    10    10          4.9         3.1          1.5         0.1 setosa
# # ... with 140 more rows

iris_head3 <- iris_id %>%
  filter(id2 %in% 1:3) %>% print()
# # A tibble: 9 x 7
#      id   id2 Sepal.Length Sepal.Width Petal.Length Petal.Width Species
#   <int> <int>        <dbl>       <dbl>        <dbl>       <dbl> <fct>
# 1     1     1          5.1         3.5          1.4         0.2 setosa
# 2     2     2          4.9         3            1.4         0.2 setosa
# 3     3     3          4.7         3.2          1.3         0.2 setosa
# 4    51     1          7           3.2          4.7         1.4 versicolor
# 5    52     2          6.4         3.2          4.5         1.5 versicolor
# 6    53     3          6.9         3.1          4.9         1.5 versicolor
# 7   101     1          6.3         3.3          6           2.5 virginica
# 8   102     2          5.8         2.7          5.1         1.9 virginica
# 9   103     3          7.1         3            5.9         2.1 virginica

iris_head5 <- iris_id %>%
  filter(id2 %in% 1:5)

iris_head10 <- iris_id %>%
  filter(id2 %in% 1:10)

iris_round <- iris %>% as_tibble() %>%
  rename(sl = Sepal.Length, sw = Sepal.Width,
         pl = Petal.Length, pw = Petal.Width) %>%
  mutate(across(1:4, .fn = ~factor(round(.)), .names = "round_{col}")) %>% print()
# # A tibble: 150 x 9
#       sl    sw    pl    pw Species round_sl round_sw round_pl round_pw
#    <dbl> <dbl> <dbl> <dbl> <fct>   <fct>    <fct>    <fct>    <fct>
#  1   5.1   3.5   1.4   0.2 setosa  5        4        1        0
#  2   4.9   3     1.4   0.2 setosa  5        3        1        0
#  3   4.7   3.2   1.3   0.2 setosa  5        3        1        0
#  4   4.6   3.1   1.5   0.2 setosa  5        3        2        0
#  5   5     3.6   1.4   0.2 setosa  5        4        1        0
#  6   5.4   3.9   1.7   0.4 setosa  5        4        2        0
#  7   4.6   3.4   1.4   0.3 setosa  5        3        1        0
#  8   5     3.4   1.5   0.2 setosa  5        3        2        0
#  9   4.4   2.9   1.4   0.2 setosa  4        3        1        0
# 10   4.9   3.1   1.5   0.1 setosa  5        3        2        0
# # ... with 140 more rows

iris_summary <- iris %>%
  group_by(Species) %>%
  summarise(mean = mean(Sepal.Length), sd = sd(Sepal.Length)) %>%
  ungroup() %>% print()
# # A tibble: 3 x 3
#   Species     mean    sd
#   <fct>      <dbl> <dbl>
# 1 setosa      5.01 0.352
# 2 versicolor  5.94 0.516
# 3 virginica   6.59 0.636
Geoms
GRAPHICAL PRIMITIVES
geom_blank()
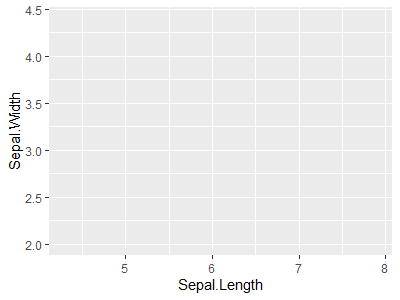
(グラフなしで)座標軸のみ描きます。
ggplot(data = iris, aes(x = Sepal.Length, y = Sepal.Width)) +
  geom_blank()
geom_curve()
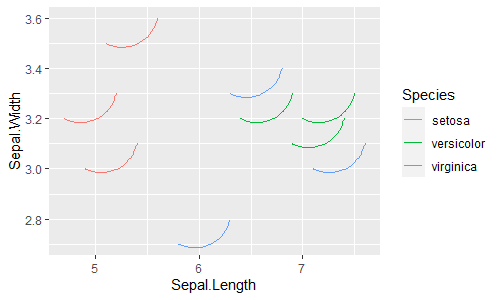
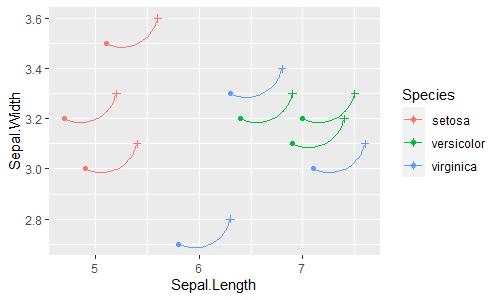
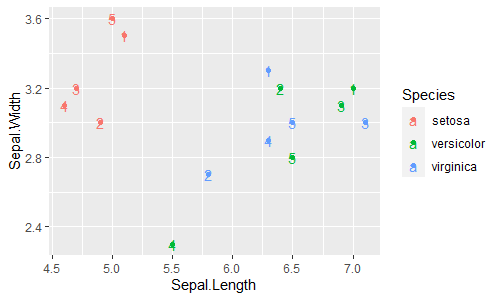
geom_segment()が点(x, y)と点(xend, yend)を結ぶ線分を描くのに対して、geom_curve()は点(x, y)と点(xend, yend)を結ぶカーブを描きます。
-
geom_segment():点(x, y)と点(xend, yend)を結ぶ線分を描く -
geom_curve():点(x, y)と点(xend, yend)を結ぶカーブを描く
ggplot(data = iris_head3, aes(x = Sepal.Length, y = Sepal.Width, color = Species)) +
  geom_curve(aes(xend = Sepal.Length + 0.5, yend = Sepal.Width + 0.1))
ggplot(data = iris_head3) +
  geom_curve(aes(x = Sepal.Length, y = Sepal.Width,
                 xend = Sepal.Length + 0.5, yend = Sepal.Width + 0.1,
                 color = Species))

ggplot(data = iris_head3, aes(x = Sepal.Length, y = Sepal.Width, color = Species)) +
  geom_point() +
  geom_point(aes(x = Sepal.Length + 0.5, y = Sepal.Width + 0.1), shape = 3) +
  geom_curve(aes(xend = Sepal.Length + 0.5, yend = Sepal.Width + 0.1))
ggplot(data = iris_head3, aes(color = Species)) +
  geom_point(aes(x = Sepal.Length, y = Sepal.Width)) +
  geom_point(aes(x = Sepal.Length + 0.5, y = Sepal.Width + 0.1), shape = 3) +
  geom_curve(aes(x = Sepal.Length, y = Sepal.Width,
                 xend = Sepal.Length + 0.5, yend = Sepal.Width + 0.1))
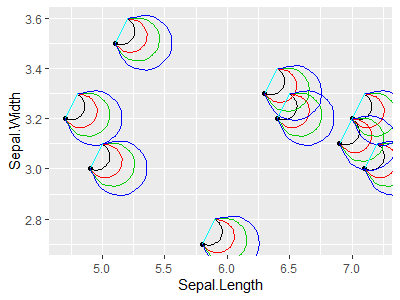
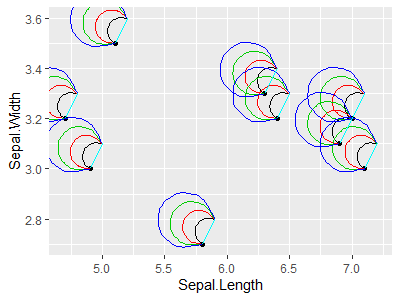
curvatureでカーブの曲率を変えられます(デフォルトは0.5)。
ggplot(data = iris_head3, aes(x = Sepal.Length, y = Sepal.Width)) +
  geom_point() +
  geom_curve(aes(xend = Sepal.Length+0.1,
                 yend = Sepal.Width+0.1), curvature = 1, color = 1) +
  geom_curve(aes(xend = Sepal.Length+0.1,
                 yend = Sepal.Width+0.1), curvature = 2, color = 2) +
  geom_curve(aes(xend = Sepal.Length+0.1,
                 yend = Sepal.Width+0.1), curvature = 3, color = 3) +
  geom_curve(aes(xend = Sepal.Length+0.1,
                 yend = Sepal.Width+0.1), curvature = 4, color = 4) +
  geom_curve(aes(xend = Sepal.Length+0.1,
                 yend = Sepal.Width+0.1), curvature = 0, color = 5)

ggplot(data = iris_head3, aes(x = Sepal.Length, y = Sepal.Width)) +
  geom_point() +
  geom_curve(aes(xend = Sepal.Length+0.1,
                 yend = Sepal.Width+0.1), curvature = -1, color = 1) +
  geom_curve(aes(xend = Sepal.Length+0.1,
                 yend = Sepal.Width+0.1), curvature = -2, color = 2) +
  geom_curve(aes(xend = Sepal.Length+0.1,
                 yend = Sepal.Width+0.1), curvature = -3, color = 3) +
  geom_curve(aes(xend = Sepal.Length+0.1,
                 yend = Sepal.Width+0.1), curvature = -4, color = 4) +
  geom_curve(aes(xend = Sepal.Length+0.1,
                 yend = Sepal.Width+0.1), curvature = 0, color = 5)
geom_path()
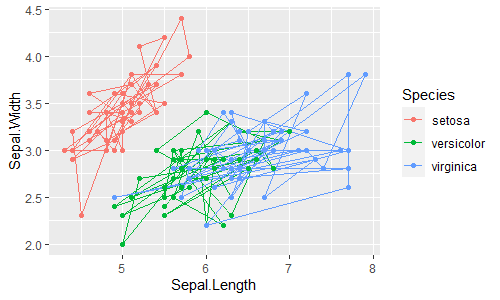
x座標, y座標に指定した点列$(x_i, y_i)$を順に結ぶパスを描きます。
ggplot(data = iris, aes(x = Sepal.Length, y = Sepal.Width, color = Species)) +
  geom_path()

ggplot(data = iris, aes(x = Sepal.Length, y = Sepal.Width, color = Species)) +
  geom_path() +
  geom_point()
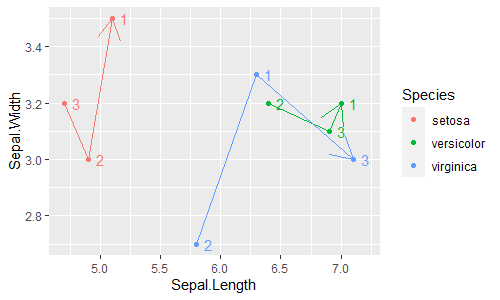
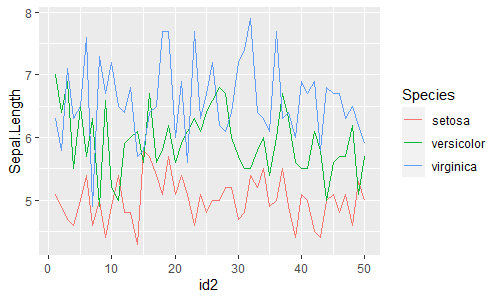
geom_path()とgeom_line()の違いは、点列を結ぶ順序の違いです。
-
geom_path(): データの順に結ぶ -
geom_line(): x軸に沿った順に結ぶ
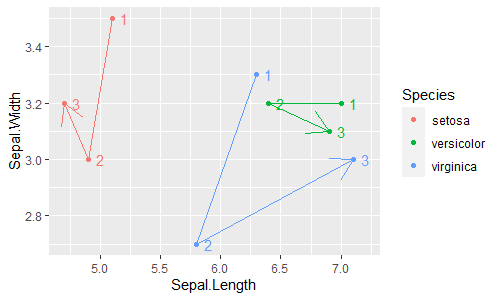
なお、端は矢印にもできます。
ggplot(data = iris_head3, aes(x = Sepal.Length, y = Sepal.Width, color = Species)) +
  geom_point() +
  geom_text(aes(label = id2), nudge_x = 0.1, show.legend = FALSE) +
  geom_path(arrow = arrow(), show.legend = FALSE)

ggplot(data = iris_head3, aes(x = Sepal.Length, y = Sepal.Width, color = Species)) +
  geom_point() +
  geom_text(aes(label = id2), nudge_x = 0.1, show.legend = FALSE) +
  geom_line(arrow = arrow(), show.legend = FALSE)
なので、次はどちらも同じ結果になります。
ggplot(data = iris_id, aes(x = id2, y = Sepal.Length, color = Species)) +
  geom_path()

ggplot(data = iris_id, aes(x = id2, y = Sepal.Length, color = Species)) +
  geom_line()
geom_polygon()
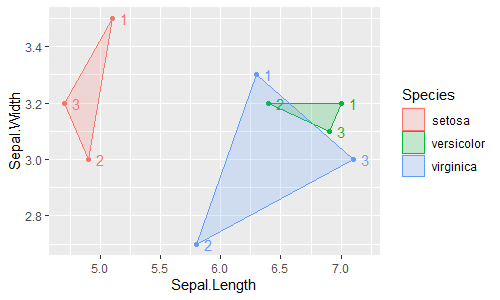
x座標, y座標に指定した点列$(x_i, y_i)$を順に結んでできる多角形を描きます。
ggplot(data = iris_head3, aes(x = Sepal.Length, y = Sepal.Width, color = Species)) +
  geom_polygon(aes(fill = Species), alpha = 0.2)

ggplot(data = iris_head3, aes(x = Sepal.Length, y = Sepal.Width, color = Species)) +
  geom_point(show.legend = FALSE) +
  geom_text(aes(label = id2), nudge_x = 0.1, show.legend = FALSE) +
  geom_polygon(aes(fill = Species), alpha = 0.2)
geom_rect()
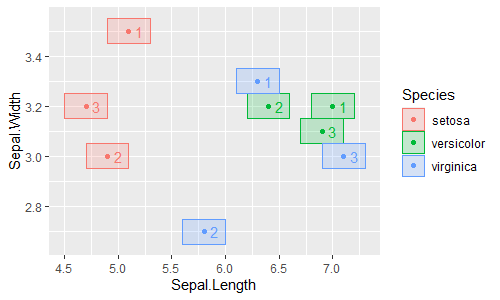
点(xmin, ymin)と点(xmax, ymax)を結ぶ線分を対角線とする長方形を描きます。
ggplot(data = iris_head3, aes(x = Sepal.Length, y = Sepal.Width, color = Species)) +
  geom_rect(aes(xmin = Sepal.Length - 0.2, xmax = Sepal.Length + 0.2,
                ymin = Sepal.Width - 0.05, ymax = Sepal.Width + 0.05,
                fill = Species), alpha = 0.2)

ggplot(data = iris_head3, aes(x = Sepal.Length, y = Sepal.Width, color = Species)) +
  geom_point() +
  geom_text(aes(label = id2), nudge_x = 0.1, show.legend = FALSE) +
  geom_rect(aes(xmin = Sepal.Length - 0.2, xmax = Sepal.Length + 0.2,
                ymin = Sepal.Width - 0.05, ymax = Sepal.Width + 0.05,
                fill = Species), alpha = 0.2)
geom_ribbon()
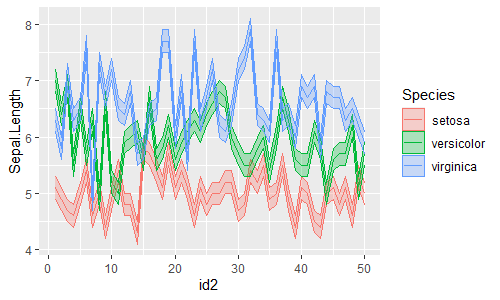
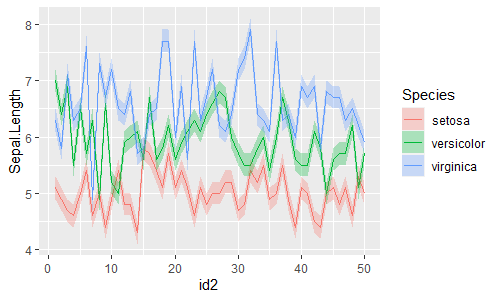
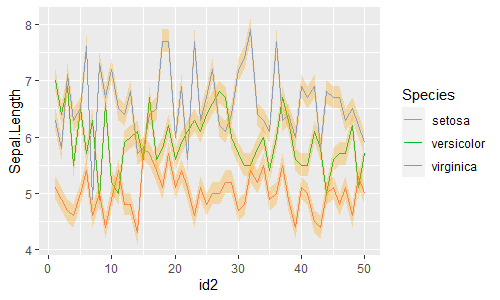
geom_line()が(x軸方向に沿った)折れ線を描くのに対して、geom_ribbon()は(x軸方向に沿って、y軸方向にymin~ymaxの幅を持った)リボンを描きます。
-
geom_line():x軸方向に沿った折れ線を描く -
geom_ribbon():x軸方向に沿ったリボンを描く
ggplot(data = iris_id, aes(x = id2, y = Sepal.Length, color = Species)) +
  geom_line() +
  geom_ribbon(aes(ymin = Sepal.Length - 0.2, ymax = Sepal.Length + 0.2,
                  fill = Species), alpha = 0.3)

ggplot(data = iris_id, aes(x = id2, y = Sepal.Length)) +
  geom_line(aes(color = Species)) +
  geom_ribbon(aes(ymin = Sepal.Length - 0.2, ymax = Sepal.Length + 0.2,
                  fill = Species), alpha = 0.3)

ggplot(data = iris_id, aes(x = id2, y = Sepal.Length)) +
  geom_line(aes(color = Species)) +
  geom_ribbon(aes(ymin = Sepal.Length - 0.2, ymax = Sepal.Length + 0.2,
                  group = Species),
              fill = "orange", alpha = 0.3)
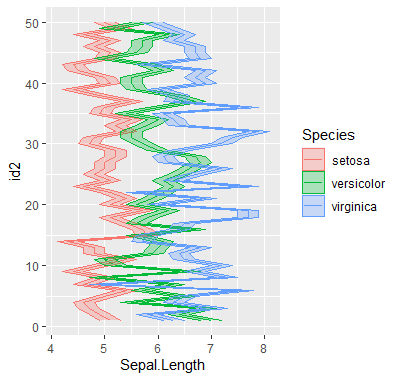
orientation = "y"とするとx軸方向にxmin~xmaxの幅を持ったリボンを描きます。
-
geom_line(orientation = "y"):y軸方向に沿った折れ線を描く -
geom_ribbon(orientation = "y"):y軸方向に沿ったリボンを描く
ggplot(data = iris_id, aes(x = Sepal.Length, y = id2, color = Species)) +
  geom_line(orientation = "y") +
  geom_ribbon(aes(xmin = Sepal.Length - 0.2, xmax = Sepal.Length + 0.2,
                  fill = Species), alpha = 0.3, orientation = "y")
LINE SEGMENTS
geom_abline()
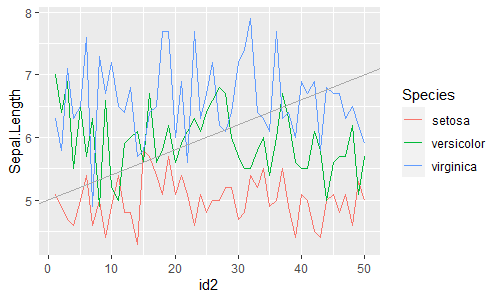
指定した切片と傾きの直線を描きます。
ggplot(data = iris_id, aes(x = id2, y = Sepal.Length)) +
  geom_line(aes(color = Species)) +
  geom_abline(aes(intercept = 5, slope = 2/50), color = "darkgray")
geom_hline(), geom_vline()
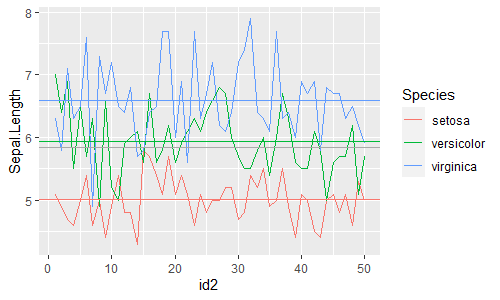
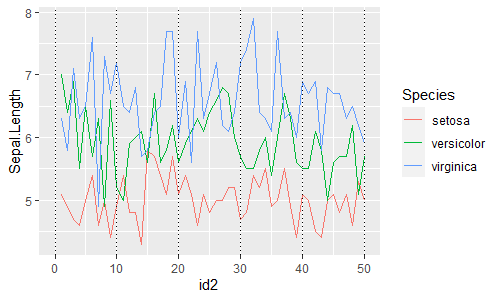
geom_hline()は水平方向(horizontal direction)、geom_vline()は鉛直方向(vertical direction)の直線を描きます。
-
geom_hline():水平方向(horizontal direction)の直線(水平線)を描く -
geom_vline():鉛直方向(vertical direction)の直線を描く
iris_mean <- iris_id %>%
  group_by(Species) %>%
  mutate(mean = mean(Sepal.Length)) %>% ungroup() %>% print()
# # A tibble: 150 x 8
#       id   id2 Sepal.Length Sepal.Width Petal.Length Petal.Width Species  mean
#    <int> <int>        <dbl>       <dbl>        <dbl>       <dbl> <fct>   <dbl>
#  1     1     1          5.1         3.5          1.4         0.2 setosa   5.01
#  2     2     2          4.9         3            1.4         0.2 setosa   5.01
#  3     3     3          4.7         3.2          1.3         0.2 setosa   5.01
#  4     4     4          4.6         3.1          1.5         0.2 setosa   5.01
#  5     5     5          5           3.6          1.4         0.2 setosa   5.01
#  6     6     6          5.4         3.9          1.7         0.4 setosa   5.01
#  7     7     7          4.6         3.4          1.4         0.3 setosa   5.01
#  8     8     8          5           3.4          1.5         0.2 setosa   5.01
#  9     9     9          4.4         2.9          1.4         0.2 setosa   5.01
# 10    10    10          4.9         3.1          1.5         0.1 setosa   5.01
# # ... with 140 more rows

ggplot(data = iris_mean, aes(x = id2, y = Sepal.Length)) +
  geom_line(aes(color = Species)) +
  geom_hline(aes(yintercept = mean, color = Species)) +
  geom_hline(yintercept = mean(iris$Sepal.Length), color = "darkgray")
ggplot(data = iris_id, aes(x = id2, y = Sepal.Length)) +
  geom_line(aes(color = Species)) +
  geom_vline(xintercept = seq(0, 50, by = 10), linetype = "dotted")
geom_segment()
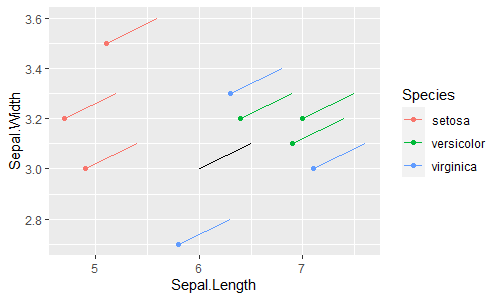
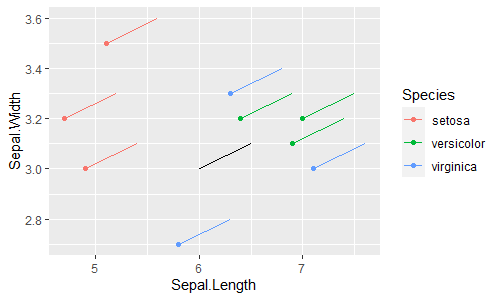
点(x, y)と点(xend, yend)を結ぶ線分を描きます。
ggplot(data = iris_head3, aes(x = Sepal.Length, y = Sepal.Width, color = Species)) +
  geom_point() +
  geom_segment(aes(xend = Sepal.Length + 0.5,
                   yend = Sepal.Width + 0.1))

ggplot(data = iris_head3, aes(x = Sepal.Length, y = Sepal.Width, color = Species)) +
  geom_point() +
  geom_segment(aes(xend = Sepal.Length + 0.5,
                   yend = Sepal.Width + 0.1)) +
  geom_segment(x = 6, xend = 6.5,
               y = 3, yend = 3.1,
               color = "black")
geom_spoke()
geom_segment()が始点と終点を指定して線分を描くのに対して、geom_spoke()は始点と仰角・半径を指定して線分を描きます。
-
geom_segment():始点と終点を指定して線分を描く -
geom_spoke():始点と仰角・半径を指定して線分を描く
ggplot(data = iris_head3, aes(x = Sepal.Length, y = Sepal.Width, color = Species)) +
  geom_point() +
  geom_spoke(angle = pi/6, radius = 0.2) +
  geom_spoke(aes(x = 6, y = 3),
             angle = pi/6, radius = 0.2,
             color = "black")
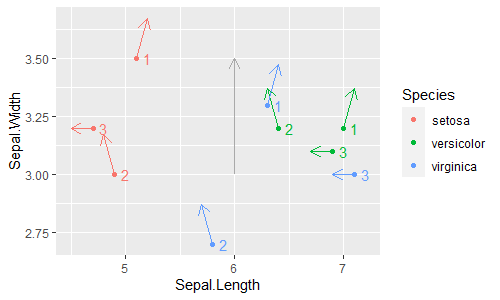
line, path, segment, spoke, curve の端は矢印にもできます。
ggplot(data = iris_head3, aes(x = Sepal.Length, y = Sepal.Width, color = Species)) +
  geom_point() +
  geom_text(aes(label = id2), nudge_x = 0.1, show.legend = FALSE) +
  geom_spoke(aes(angle = pi/3 * id2), radius = 0.2,
             arrow = arrow(length = unit(0.05, "npc")), show.legend = FALSE) +
  geom_spoke(aes(x = 6, y = 3),
             angle = pi/2, radius = 0.5,
             arrow = arrow(length = unit(0.05, "npc")),
             color = "darkgray")

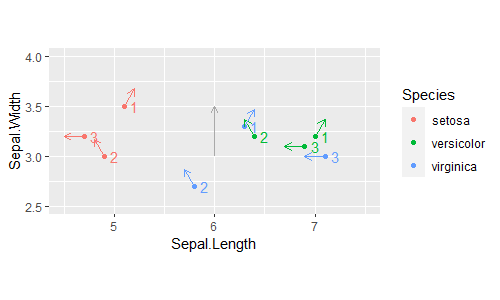
ggplot(data = iris_head3, aes(x = Sepal.Length, y = Sepal.Width, color = Species)) +
  geom_point() +
  geom_text(aes(label = id2), nudge_x = 0.1, show.legend = FALSE) +
  geom_spoke(aes(angle = pi/3 * id2), radius = 0.2,
             arrow = arrow(length = unit(0.05, "npc")), show.legend = FALSE) +
  geom_spoke(aes(x = 6, y = 3),
             angle = pi/2, radius = 0.5,
             arrow = arrow(length = unit(0.05, "npc")),
             color = "darkgray") +
  xlim(4.5, 7.5) + ylim(2.5, 4) +
  coord_fixed(ratio = 1) # 縦軸と横軸の比を1に固定
ONE VARIABLE
continuous
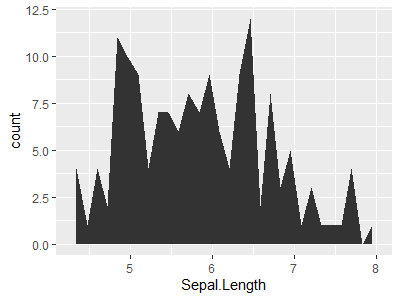
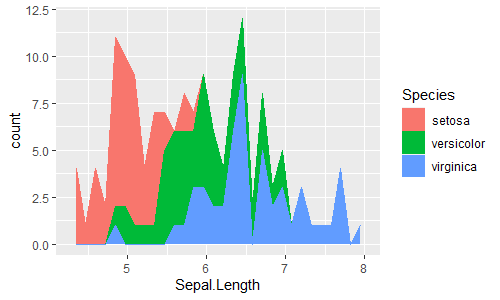
geom_area(stat = "bin")
geom_line()が(x軸方向に沿った)折れ線を描くのに対して、geom_area()は折れ線より下の面を塗りつぶします(y軸方向に0~yの幅を持ったリボンを描くともいえます。)。
-
geom_line():(x軸方向に沿った)折れ線(折れ線グラフ)を描く -
geom_area():(x軸方向に沿った)面グラフ(積み上げ折れ線グラフ)を描く
ggplot(data = iris, aes(Sepal.Length)) +
  geom_area(stat = "bin")

ggplot(data = iris, aes(Sepal.Length)) +
  geom_area(stat = "bin", aes(color = Species, fill = Species), position = "stack")
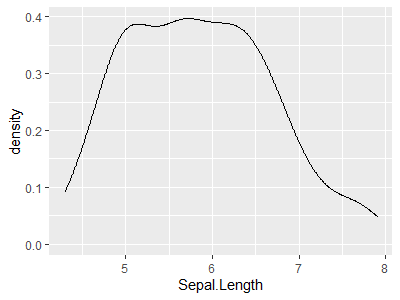
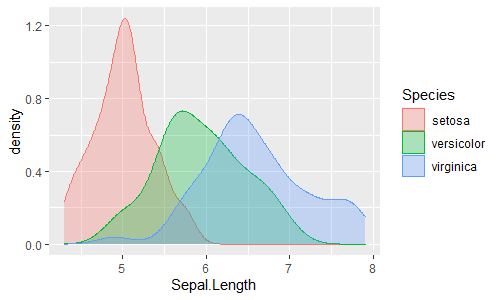
geom_density()
密度曲線(密度推定された曲線)を描きます。
ggplot(data = iris, aes(Sepal.Length)) +
  geom_density()

ggplot(data = iris, aes(Sepal.Length)) +
  geom_density(aes(color = Species, fill = Species), position = "identity", alpha = 0.3)
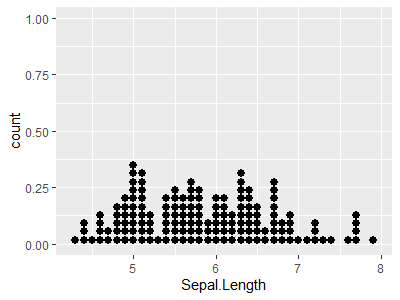
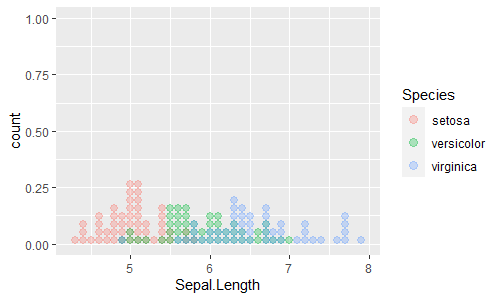
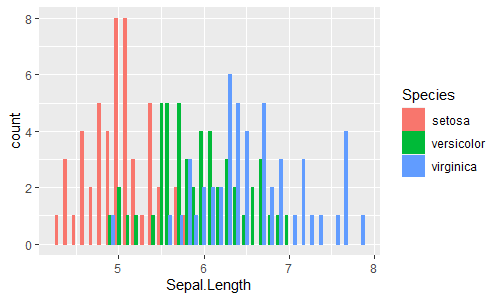
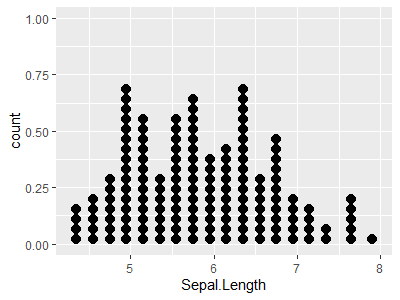
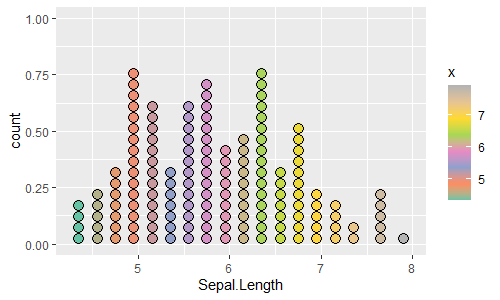
geom_dotplot()
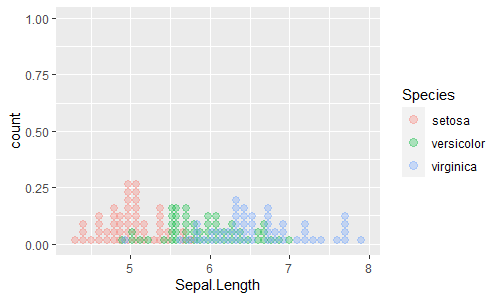
ドットプロットを描きます。
ggplot(data = iris, aes(Sepal.Length)) +
  geom_dotplot(binwidth = 0.1)

ggplot(data = iris, aes(Sepal.Length, color = Species, fill = Species)) +
  geom_dotplot(binwidth = 0.1, alpha = 0.3)
ggplot(data = iris, aes(Sepal.Length, color = Species, fill = Species)) +
  geom_dotplot(binwidth = 0.1, alpha = 0.3, position = "identity")

ggplot(data = iris, aes(Sepal.Length, color = Species, fill = Species)) +
  geom_dotplot(binwidth = 0.1, alpha = 0.3, position = "dodge")
geom_freqpoly()
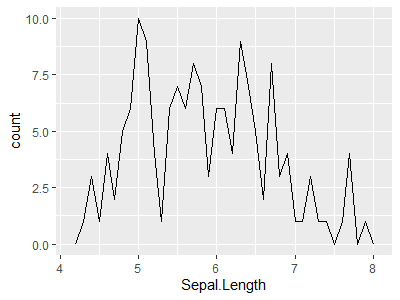
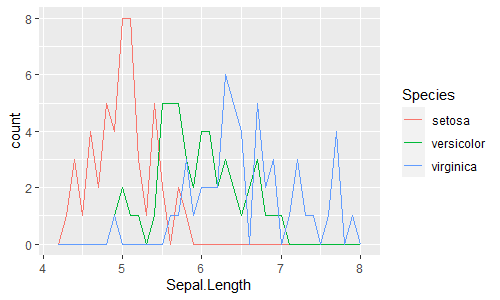
度数曲線を描きます。
ggplot(data = iris, aes(Sepal.Length)) +
  geom_freqpoly(binwidth = 0.1)

ggplot(data = iris, aes(Sepal.Length, color = Species)) +
  geom_freqpoly(binwidth = 0.1)
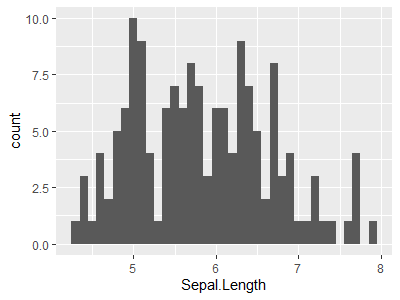
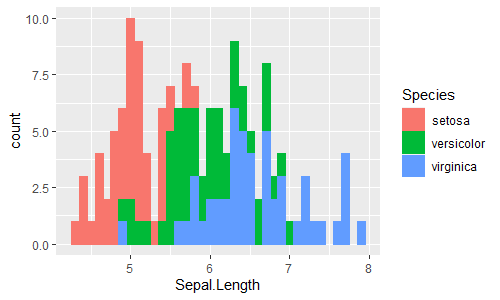
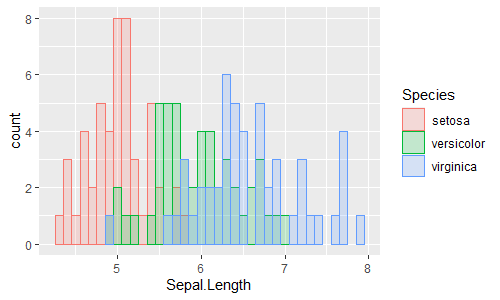
geom_histogram()
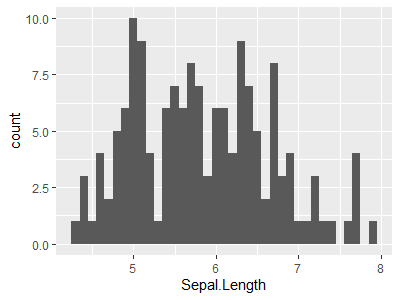
ヒストグラムを描きます。
ggplot(data = iris, aes(Sepal.Length)) +
  geom_histogram(binwidth = 0.1)

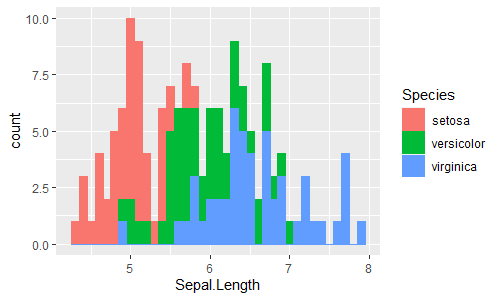
ggplot(data = iris, aes(Sepal.Length, color = Species, fill = Species)) +
  geom_histogram(binwidth = 0.1)
ggplot(data = iris, aes(Sepal.Length, color = Species, fill = Species)) +
  geom_histogram(binwidth = 0.1, position = "stack")

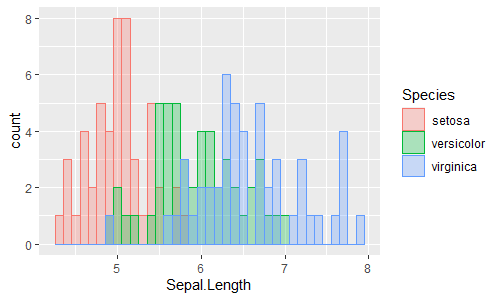
ggplot(data = iris, aes(Sepal.Length, color = Species, fill = Species)) +
  geom_histogram(binwidth = 0.1, position = "identity", alpha = 0.3)
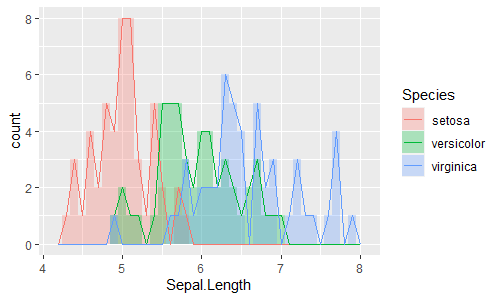
重ね合わせてみます。
ggplot(data = iris, aes(Sepal.Length)) +
  geom_histogram(aes(fill = Species), binwidth = 0.1, position = "identity", alpha = 0.3) +
  geom_freqpoly(aes(color = Species), binwidth = 0.1, position = "identity")
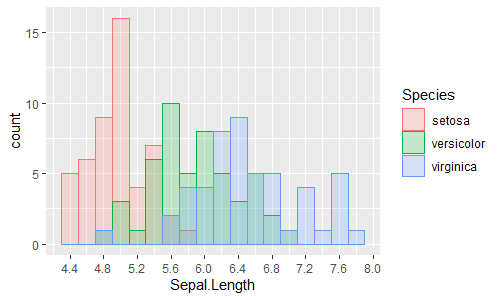
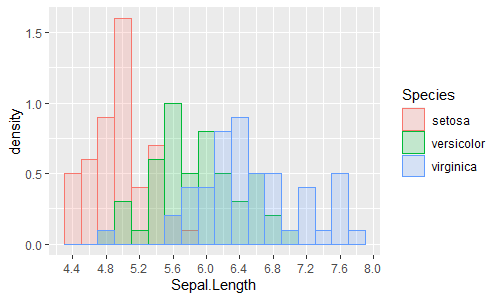
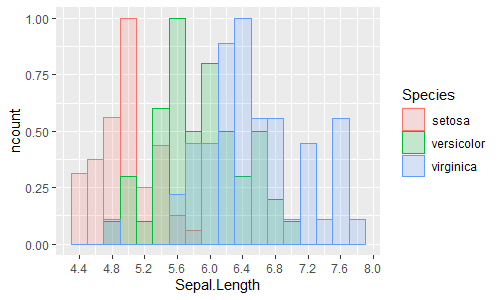
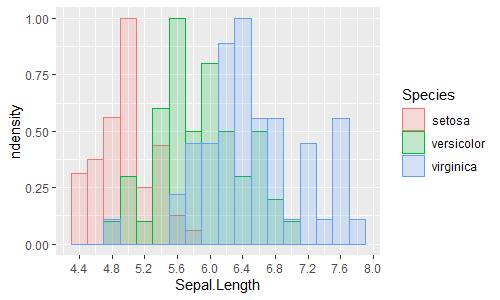
..count.., ..density.., ..ncount.., ..ndensity..
ggplot(data = iris, aes(x = Sepal.Length, y = ..count..)) +
  geom_histogram(aes(color = Species, fill = Species), alpha = 0.2, position = "identity", binwidth = 0.2) +
  scale_x_continuous(breaks = seq(4, 8, by=0.4))
ggplot(data = iris, aes(x = Sepal.Length, y = stat(count))) +
  geom_histogram(aes(color = Species, fill = Species), alpha = 0.2, position = "identity", binwidth = 0.2) +
  scale_x_continuous(breaks = seq(4, 8, by=0.4))

ggplot(data = iris, aes(x = Sepal.Length, y = ..density..)) +
  geom_histogram(aes(color = Species, fill = Species), alpha = 0.2, position = "identity", binwidth = 0.2) +
  scale_x_continuous(breaks = seq(4, 8, by=0.4))

ggplot(data = iris, aes(x = Sepal.Length, y = ..ncount..)) +
  geom_histogram(aes(color = Species, fill = Species), alpha = 0.2, position = "identity", binwidth = 0.2) +
  scale_x_continuous(breaks = seq(4, 8, by=0.4))

ggplot(data = iris, aes(x = Sepal.Length, y = ..ndensity..)) +
  geom_histogram(aes(color = Species, fill = Species), alpha = 0.2, position = "identity", binwidth = 0.2) +
  scale_x_continuous(breaks = seq(4, 8, by=0.4))
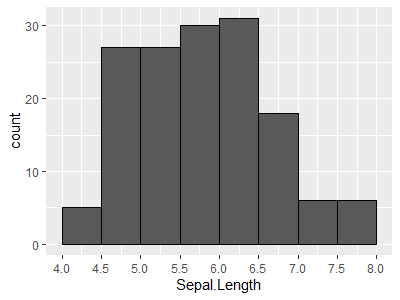
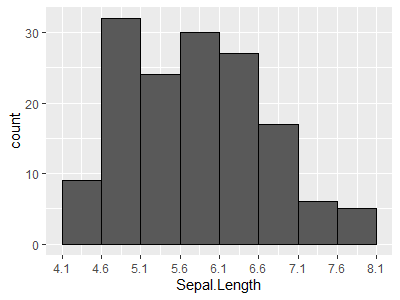
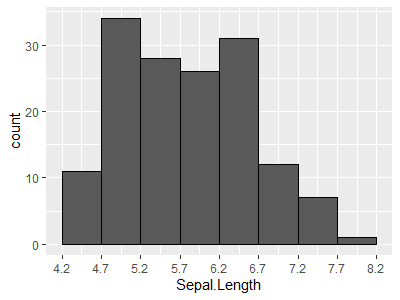
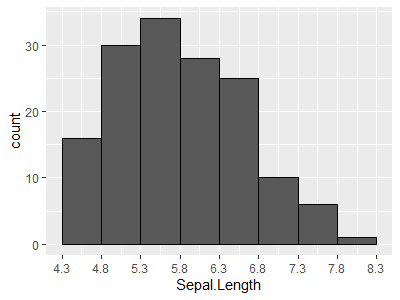
ggplot_build()を用いると内部的に計算されているヒストグラムの情報を取得することができます。
参考:https://heavywatal.github.io/rstats/ggplot2.html#内部変数を使う
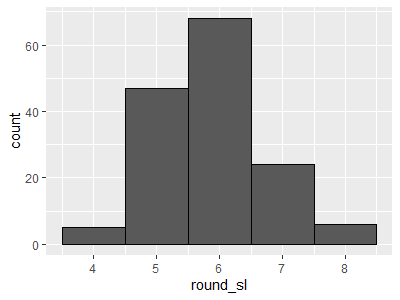
p0 <- ggplot(data = iris, aes(x = Sepal.Length, y = ..count..)) +
  geom_histogram(binwidth = 0.5, boundary = 4.0, color = "black") +
  scale_x_continuous(breaks = seq(4.0, 8.0, by=0.5))
plot(p0)

p1 <- ggplot(data = iris, aes(x = Sepal.Length, y = ..count..)) +
  geom_histogram(binwidth = 0.5, boundary = 4.1, color = "black") +
  scale_x_continuous(breaks = seq(4.1, 8.1, by=0.5))
plot(p1)

p2 <- ggplot(data = iris, aes(x = Sepal.Length, y = ..count..)) +
  geom_histogram(binwidth = 0.5, boundary = 4.2, color = "black") +
  scale_x_continuous(breaks = seq(4.2, 8.2, by=0.5))
plot(p2)

p3 <- ggplot(data = iris, aes(x = Sepal.Length, y = ..count..)) +
  geom_histogram(binwidth = 0.5, boundary = 4.3, color = "black") +
  scale_x_continuous(breaks = seq(4.3, 8.3, by=0.5))
plot(p3)

ggplot_build(p0)$data[[1]]$count
# [1]  5 27 27 30 31 18  6  6
ggplot_build(p1)$data[[1]]$count
# [1]  9 32 24 30 27 17  6  5
ggplot_build(p2)$data[[1]]$count
# [1] 11 34 28 26 31 12  7  1
ggplot_build(p3)$data[[1]]$count
# [1] 16 30 34 28 25 10  6  1

table(cut(iris$Sepal.Length, breaks = seq(4.0, 8.0, by = 0.5), include.lowest = TRUE))
#
# [4,4.5] (4.5,5] (5,5.5] (5.5,6] (6,6.5] (6.5,7] (7,7.5] (7.5,8]
#       5      27      27      30      31      18       6       6
table(cut(iris$Sepal.Length, breaks = seq(4.1, 8.1, by = 0.5), include.lowest = TRUE))
#
# [4.1,4.6] (4.6,5.1] (5.1,5.6] (5.6,6.1] (6.1,6.6] (6.6,7.1] (7.1,7.6] (7.6,8.1]
#         9        32        24        30        27        17         6         5
table(cut(iris$Sepal.Length, breaks = seq(4.2, 8.2, by = 0.5), include.lowest = TRUE))
#
# [4.2,4.7] (4.7,5.2] (5.2,5.7] (5.7,6.2] (6.2,6.7] (6.7,7.2] (7.2,7.7] (7.7,8.2]
#        11        34        28        26        31        12         7         1
table(cut(iris$Sepal.Length, breaks = seq(4.3, 8.3, by = 0.5), include.lowest = TRUE))
#
# [4.3,4.8] (4.8,5.3] (5.3,5.8] (5.8,6.3] (6.3,6.8] (6.8,7.3] (7.3,7.8] (7.8,8.3]
#        16        30        34        28        25        10         6         1
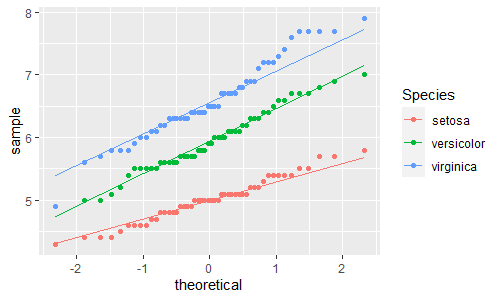
geom_qq()
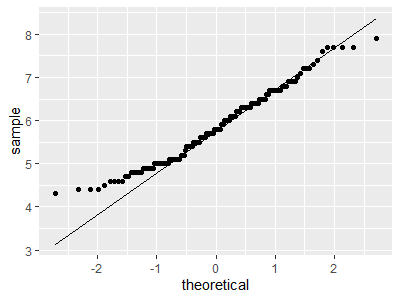
QQ-プロットを描きます。
ggplot(data = iris, aes(sample = Sepal.Length)) +
  geom_qq() +
  stat_qq_line()

ggplot(data = iris, aes(sample = Sepal.Length, color = Species)) +
  geom_qq() +
  stat_qq_line()
descrete
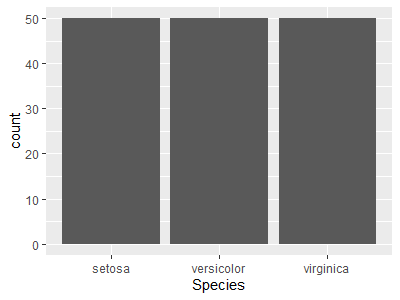
geom_bar()
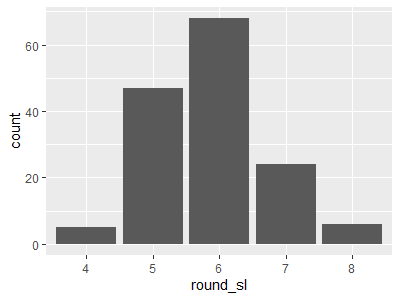
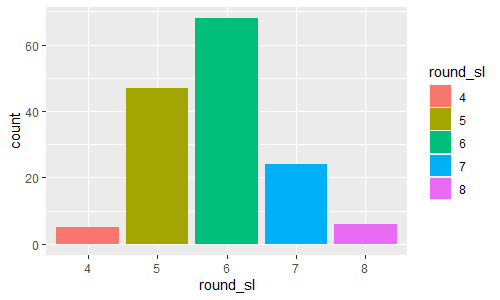
x軸に指定した離散値ごとにstat_count()でカウントした値をy軸にした棒グラフを描きます。
-
geom_bar():カウント数をy軸にとった棒グラフを描く -
geom_col():指定した値をy軸にとった棒グラフを描く
ggplot(data = iris, aes(x = Species)) +
  geom_bar()
ggplot(data = iris, aes(x = Species, y = ..count..)) +
  geom_bar()
ggplot(data = iris, aes(x = Species, y = stat(count))) +
  geom_bar()
ggplot(data = iris, aes(x = Species, y = after_stat(count))) +
  geom_bar()

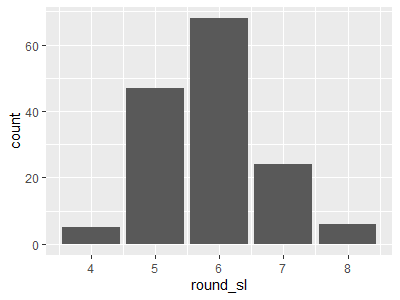
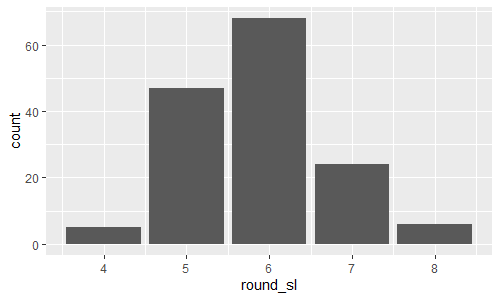
ggplot(data = iris_round, aes(x = round_sl)) +
  geom_bar()
ggplot(data = iris_round, aes(x = round_sl, y = stat(count))) +
  geom_bar()
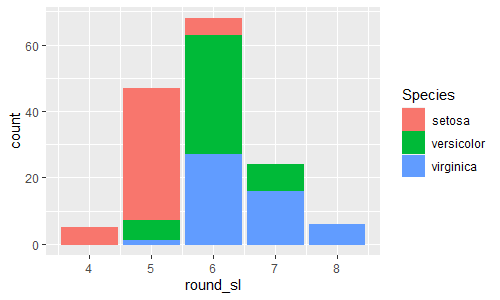
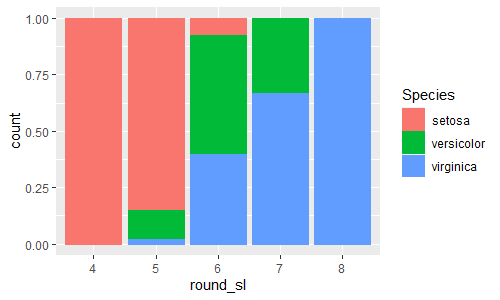
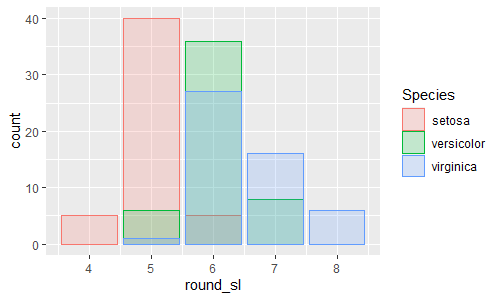
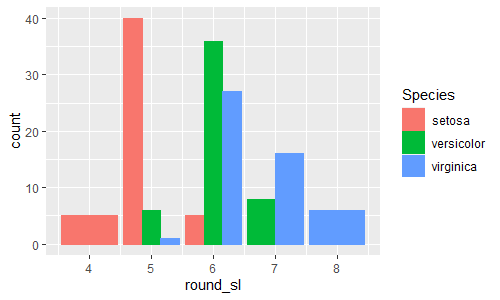
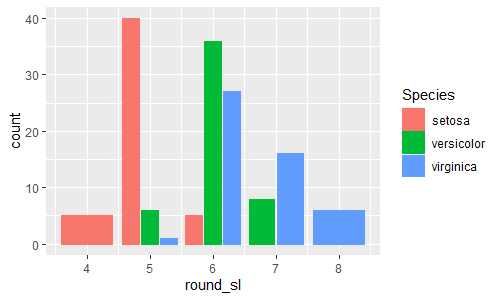
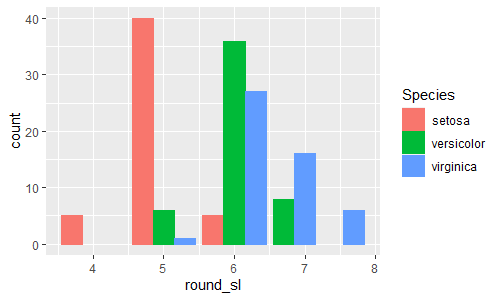
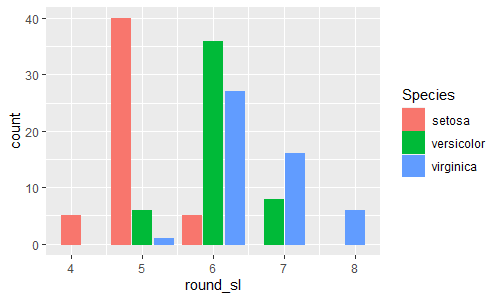
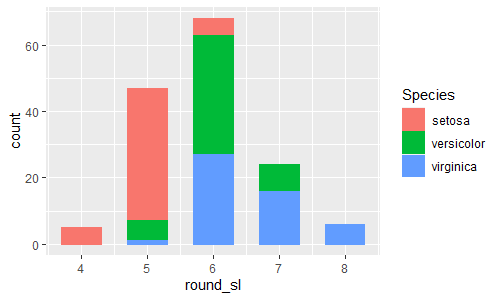
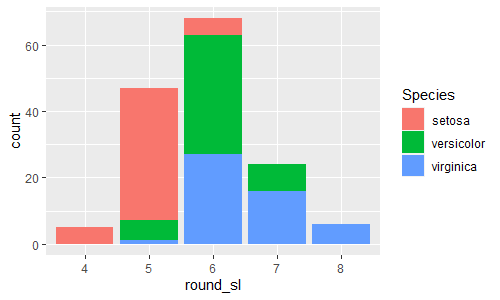
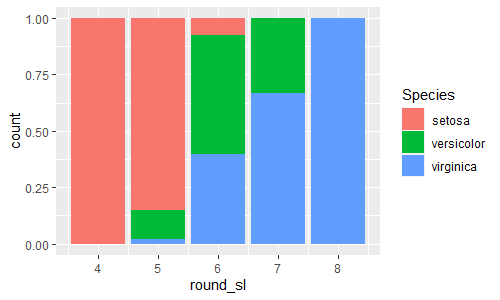
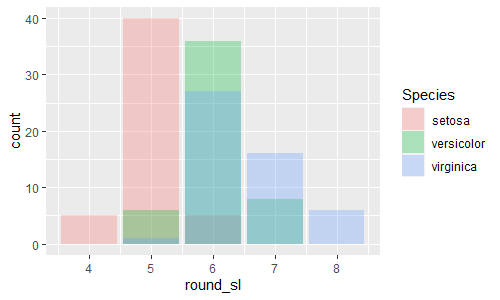
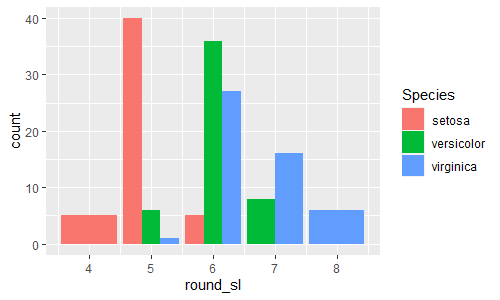
positionで棒グラフの種類を設定できます。
-
position = "stack":積み上げ棒グラフ(エクセルの「積み上げ縦棒」) -
position = "fill":全体を100%にした積み上げ棒グラフ(エクセルの「100%積み上げ縦棒」) -
position = "identity":棒グラフの重ね合わせ -
position = "dodge","dodge2":横並びの棒グラフ(エクセルの「集合縦棒」)
ggplot(data = iris_round, aes(x = round_sl, color = Species, fill = Species)) +
  geom_bar()
ggplot(data = iris_round, aes(x = round_sl, color = Species, fill = Species)) +
  geom_bar(position = "stack")
ggplot(data = iris_round, aes(x = round_sl, color = Species, fill = Species)) +
  geom_bar(position = position_stack())

ggplot(data = iris_round, aes(x = round_sl, color = Species, fill = Species)) +
  geom_bar(position = "fill")
ggplot(data = iris_round, aes(x = round_sl, color = Species, fill = Species)) +
  geom_bar(position = position_fill())

ggplot(data = iris_round, aes(x = round_sl, color = Species, fill = Species)) +
  geom_bar(position = "identity", alpha = 0.2)
ggplot(data = iris_round, aes(x = round_sl, color = Species, fill = Species)) +
  geom_bar(position = position_identity(), alpha = 0.2)

ggplot(data = iris_round, aes(x = round_sl, color = Species, fill = Species)) +
  geom_bar(position = "dodge")
ggplot(data = iris_round, aes(x = round_sl, color = Species, fill = Species)) +
  geom_bar(position = position_dodge())
ggplot(data = iris_round, aes(x = round_sl, color = Species, fill = Species)) +
  geom_bar(position = position_dodge(preserve = "total"))

ggplot(data = iris_round, aes(x = round_sl, color = Species, fill = Species)) +
  geom_bar(position = "dodge2")
ggplot(data = iris_round, aes(x = round_sl, color = Species, fill = Species)) +
  geom_bar(position = position_dodge2())
ggplot(data = iris_round, aes(x = round_sl, color = Species, fill = Species)) +
  geom_bar(position = position_dodge2(preserve = "total"))
position_dodge()とposition_dodge2()の違いは、preserve = "single"とするとよくわかります。
-
position_dodge(preserve = "single"):どのxでもグループごとの配置は同じ -
position_dodge2(preserve = "single"):xごとに全体を真ん中に配置
ggplot(data = iris_round, aes(x = round_sl, color = Species, fill = Species)) +
  geom_bar(position = position_dodge(preserve = "single"))

ggplot(data = iris_round, aes(x = round_sl, color = Species, fill = Species)) +
  geom_bar(position = position_dodge2(preserve = "single"))
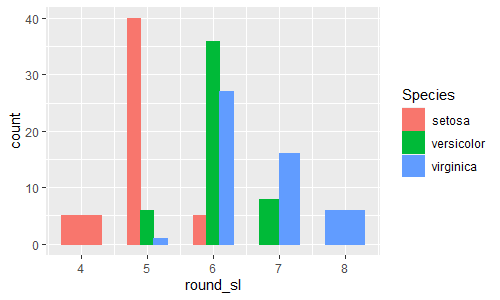
widthで棒の幅を調整できます。
ggplot(data = iris_round, aes(x = round_sl, color = Species, fill = Species)) +
  geom_bar(position = "stack", width = 0.6)

ggplot(data = iris_round, aes(x = round_sl, color = Species, fill = Species)) +
  geom_bar(position = "dodge", width = 0.6)
irisデータは0.1単位ですので、roundせずにそのままx軸に指定すると、ビン幅が0.1のヒストグラムと同じようになります。
ggplot(data = iris, aes(x = Sepal.Length)) +
  geom_bar(width = 0.1)

ggplot(data = iris, aes(x = Sepal.Length, color = Species, fill = Species)) +
  geom_bar(width = 0.1)
ggplot(data = iris, aes(x = Sepal.Length, color = Species, fill = Species)) +
  geom_bar(position = "stack", width = 0.1)

ggplot(data = iris, aes(x = Sepal.Length, color = Species, fill = Species)) +
  geom_bar(position = "identity", alpha = 0.2, width = 0.1)

ggplot(data = iris, aes(x = Sepal.Length, color = Species, fill = Species)) +
  geom_bar(position = position_dodge(preserve = "single"), width = 0.1)
TWO VARIABLES
continuous x, continuous y
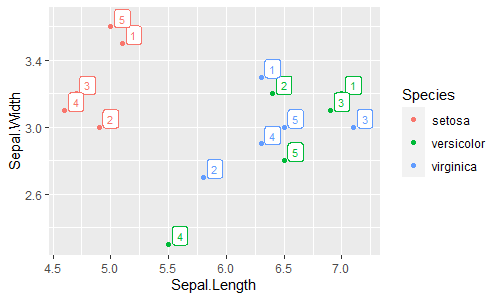
geom_label()
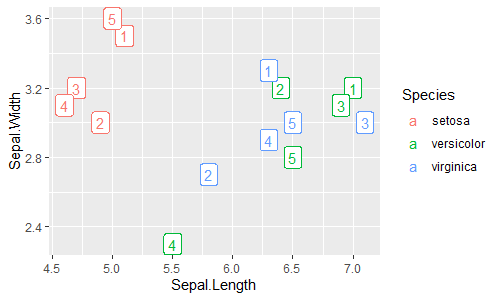
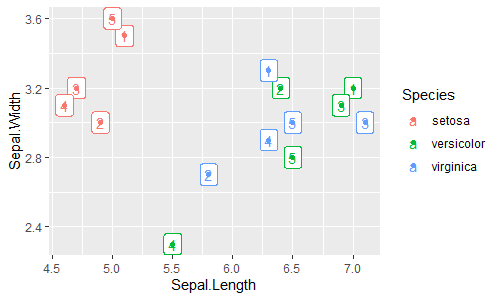
geom_text()が指定した座標(x, y)にテキストを入れるのに対して、geom_label()は指定した座標(x, y)にラベルを貼ります。
-
geom_text():指定した座標(x, y)にテキストを入れる -
geom_label():指定した座標(x, y)にラベルを貼る
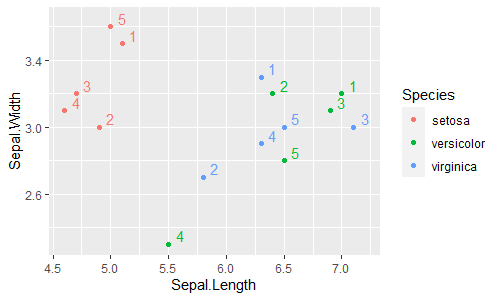
ggplot(data = iris_head5, aes(x = Sepal.Length, y = Sepal.Width, color = Species)) +
  geom_label(aes(label = id2))
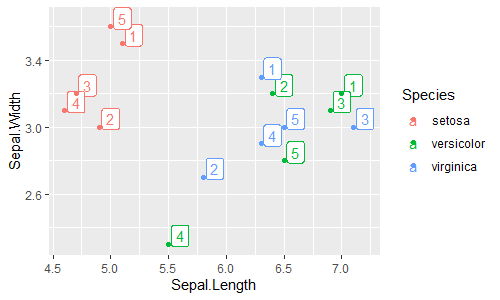
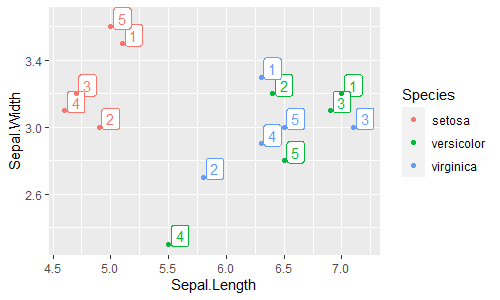
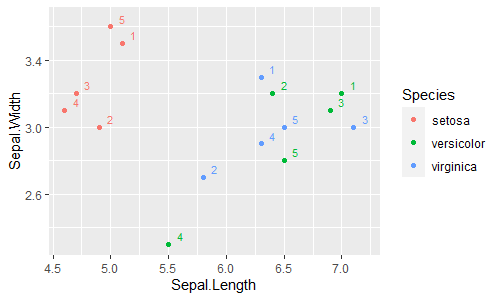
nudge_x, nudge_yでラベルの位置をずらせます。
show.legend = FALSEとすることで凡例に表示しないようにできます。
ggplot(data = iris_head5, aes(x = Sepal.Length, y = Sepal.Width, color = Species)) +
  geom_label(aes(label = id2)) +
  geom_point()

ggplot(data = iris_head5, aes(x = Sepal.Length, y = Sepal.Width, color = Species)) +
  geom_label(aes(label = id2), nudge_x = 0.1, nudge_y = 0.05) +
  geom_point()

ggplot(data = iris_head5, aes(x = Sepal.Length, y = Sepal.Width, color = Species)) +
  geom_label(aes(label = id2), nudge_x = 0.1, nudge_y = 0.05, show.legend = FALSE) +
  geom_point()
geom_jitter()
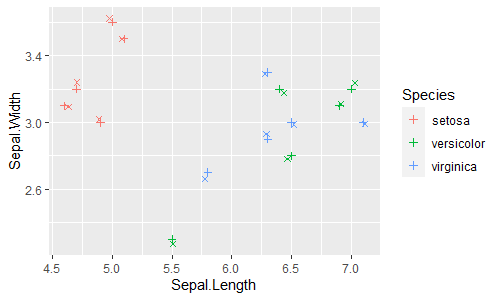
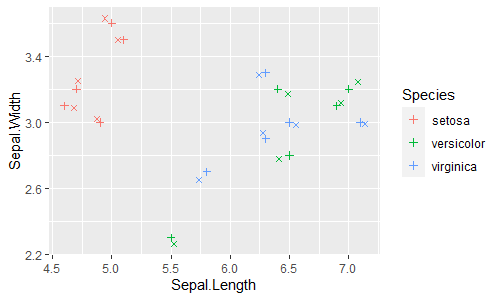
geom_point()が指定した座標に点をプロットするのに対して、geom_jitter()は指定した座標を中心にして点をランダムにばらけさせます。
-
geom_point():指定した座標に点をプロット -
geom_jitter():指定した座標を中心に点をばらけさせてプロット
ggplot(data = iris_head5, aes(x = Sepal.Length, y = Sepal.Width, color = Species)) +
  geom_jitter(width = 0.05, height = 0.05)

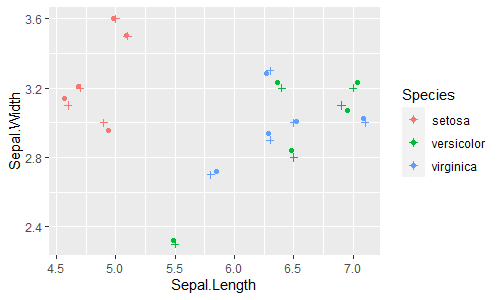
ggplot(data = iris_head5, aes(x = Sepal.Length, y = Sepal.Width, color = Species)) +
  geom_point(shape = 3) # 元の場所:+印

set.seed(1)
ggplot(data = iris_head5, aes(x = Sepal.Length, y = Sepal.Width, color = Species)) +
  geom_jitter(width = 0.05, height = 0.05) +
  geom_point(shape = 3) # 元の場所:+印
geom_point()
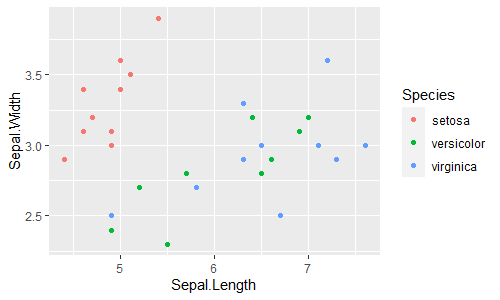
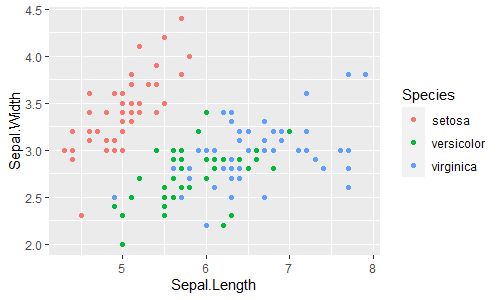
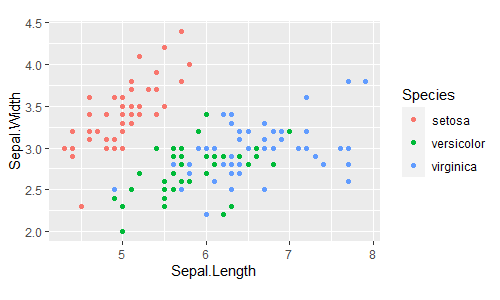
指定した座標に点をプロットすることで散布図を描きます。
ggplot(data = iris_head10, aes(x = Sepal.Length, y = Sepal.Width, color = Species)) +
  geom_point()

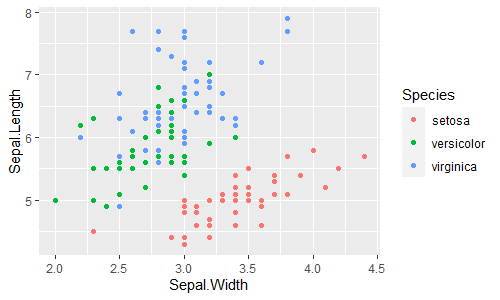
ggplot(data = iris, aes(x = Sepal.Length, y = Sepal.Width, color = Species)) +
  geom_point()
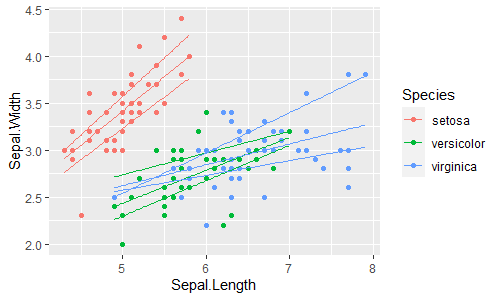
geom_quantile()
分位点回帰の曲線を描きます。
ggplot(data = iris, aes(x = Sepal.Length, y = Sepal.Width, color = Species)) +
  geom_point() +
  geom_quantile()
ggplot(data = iris, aes(x = Sepal.Length, y = Sepal.Width, color = Species)) +
  geom_point() +
  geom_quantile(quantile = c(0.25, 0.75))
geom_rug()
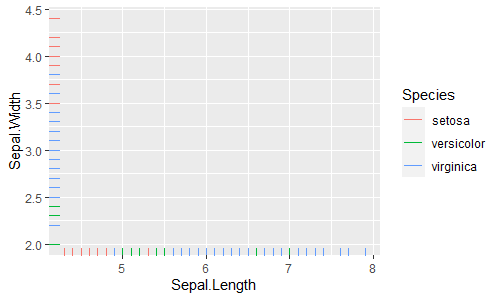
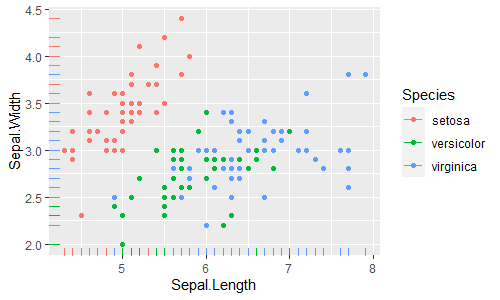
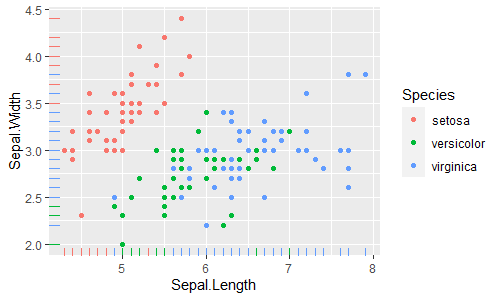
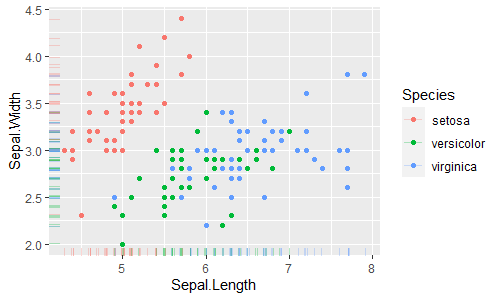
ラグプロット(2次元分布の周辺分布(marginal distributions))を描きます。
ggplot(data = iris, aes(x = Sepal.Length, y = Sepal.Width, color = Species)) +
  geom_rug()
ggplot(data = iris, aes(x = Sepal.Length, y = Sepal.Width, color = Species)) +
  geom_point() +
  geom_rug()
ggplot(data = iris, aes(x = Sepal.Length, y = Sepal.Width, color = Species)) +
  geom_point() +
  geom_rug(sides = "bl") # a string containing any of "trbl", for top, right, bottom, and left.

ggplot(data = iris, aes(x = Sepal.Length, y = Sepal.Width, color = Species)) +
  geom_point() +
  geom_rug(sides = "bl", show.legend = FALSE)
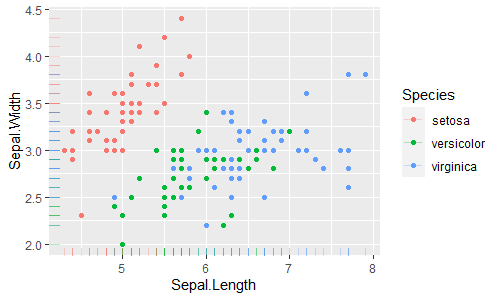
irisデータは0.1単位のため重なるデータが多く、rugが重なって見にくいので、jitterでずらしておきます。
ggplot(data = iris_id, aes(x = Sepal.Length, y = Sepal.Width, color = Species)) +
  geom_point() +
  geom_rug(alpha = 0.3)

ggplot(data = iris_id, aes(x = Sepal.Length, y = Sepal.Width, color = Species)) +
  geom_point() +
  geom_rug(aes(x = jitter(Sepal.Length), y = jitter(Sepal.Width)), alpha = 0.3)
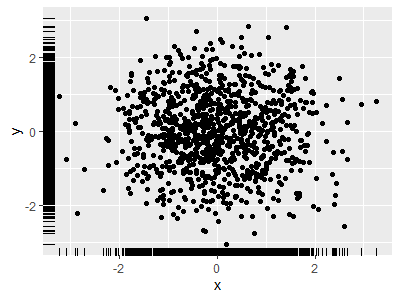
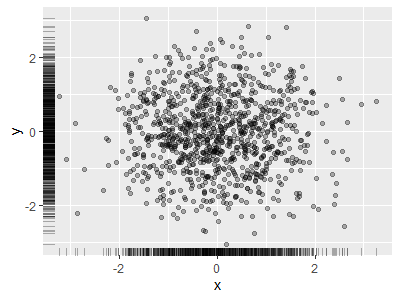
重ならないデータでも試しておきます。
set.seed(0)
x = rnorm(1000, mean = 0, sd = 1)
y = rnorm(1000, mean = 0, sd = 1)

ggplot(data = data.frame(x, y), aes(x = x, y = y)) +
  geom_point() +
  geom_rug()

ggplot(data = data.frame(x, y), aes(x = x, y = y)) +
  geom_point(alpha = 0.3) +
  geom_rug(alpha = 0.3)
geom_smooth()
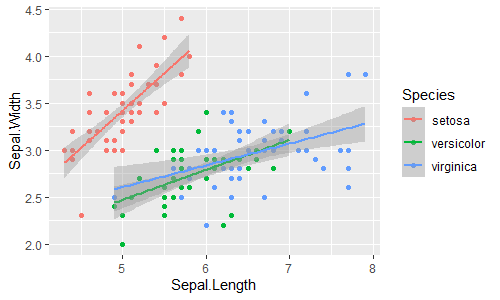
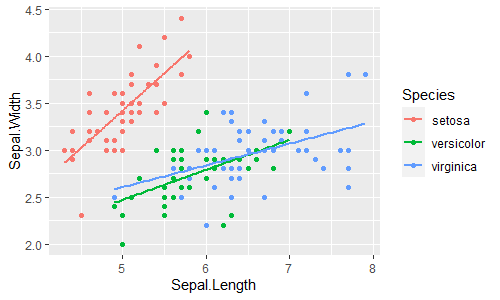
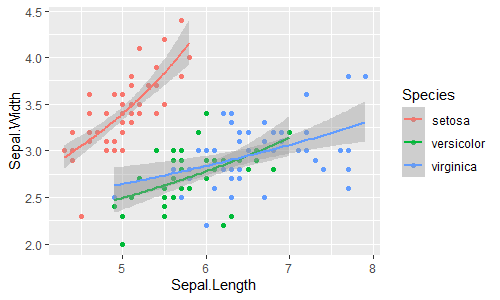
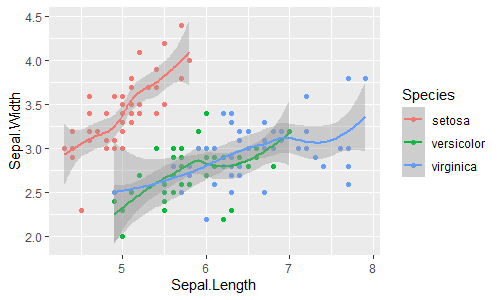
回帰曲線を描きます。
ggplot(data = iris, aes(x = Sepal.Length, y = Sepal.Width, color = Species)) +
  geom_point() +
  geom_smooth(method = lm)

ggplot(data = iris, aes(x = Sepal.Length, y = Sepal.Width, color = Species)) +
  geom_point() +
  geom_smooth(method = lm, se = FALSE)
ggplot(data = iris, aes(x = Sepal.Length, y = Sepal.Width, color = Species)) +
  geom_point() +
  geom_smooth(method = "lm")

ggplot(data = iris, aes(x = Sepal.Length, y = Sepal.Width, color = Species)) +
  geom_point() +
  geom_smooth(method = "glm", method.args = list(family = Gamma(link = "inverse")))

ggplot(data = iris, aes(x = Sepal.Length, y = Sepal.Width, color = Species)) +
  geom_point() +
  geom_smooth(method = "loess")
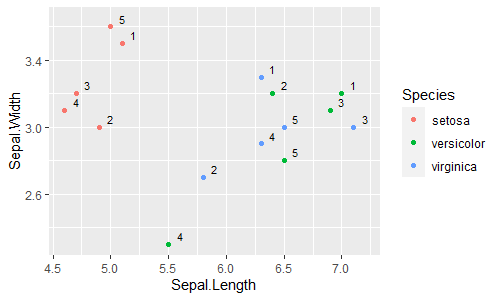
geom_text()
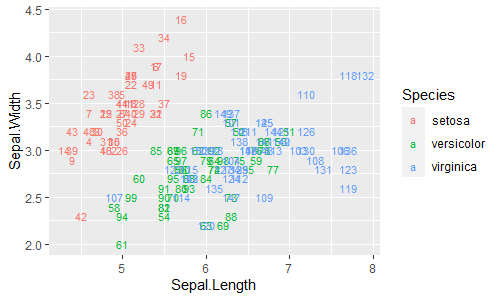
指定した座標(x, y)にテキストを入れます。
-
geom_text():指定した座標(x, y)にテキストを入れる -
geom_label():指定した座標(x, y)にラベルを貼る
ggplot(data = iris_id, aes(x = Sepal.Length, y = Sepal.Width, color = Species)) +
  geom_text(aes(label = id), size = 3)
nudge_x, nudge_yでテキストの位置をずらせます。
ggplot(data = iris_head5, aes(x = Sepal.Length, y = Sepal.Width, color = Species)) +
  geom_point() +
  geom_text(aes(label = id2))

ggplot(data = iris_head5, aes(x = Sepal.Length, y = Sepal.Width, color = Species)) +
  geom_point() +
  geom_text(aes(label = id2), nudge_x = 0.1, nudge_y = 0.05, show.legend = FALSE)
discrete x, continuous y
geom_col()
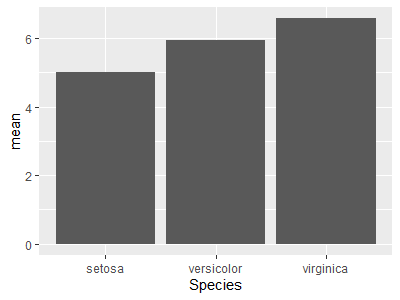
geom_bar()がx軸の離散値ごとにカウントした値をy軸にした棒グラフを描くのに対して、geom_col()は指定した値をy軸にした棒グラフを描きます。
-
geom_bar():カウント数をy軸にとった棒グラフを描く -
geom_col():指定した値をy軸にとった棒グラフを描く
ggplot(data = iris_summary, aes(x = Species, y = mean)) +
  geom_col()
iris %>%
  group_by(Species) %>%
  summarise(mean = mean(Sepal.Length), sd = sd(Sepal.Length)) %>%
  ggplot(aes(x = Species, y = mean)) +
  geom_col()
なので、次はどちらも同じ結果になります。
iris_round %>%
  group_by(round_sl) %>% count(name = "count") %>%
  ggplot(aes(x = round_sl, y = count)) +
  geom_col()

ggplot(data = iris_round, aes(x = round_sl)) +
  geom_bar()
ggplot(data = iris_round, aes(x = round_sl, y = ..count..)) +
  geom_bar()
ggplot(data = iris_round, aes(x = round_sl, y = stat(count))) +
  geom_bar()
ggplot(data = iris_round, aes(x = round_sl, y = after_stat(count))) +
  geom_bar()
iris_round %>%
  group_by(round_sl, Species) %>% count(name = "count") %>%
  ggplot(aes(x = round_sl, y = count, fill = Species)) +
  geom_col()

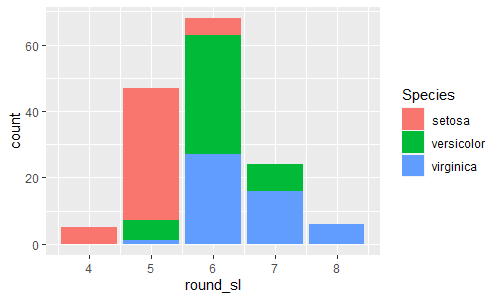
ggplot(data = iris_round, aes(x = round_sl, fill = Species)) +
  geom_bar()
geom_boxplot()
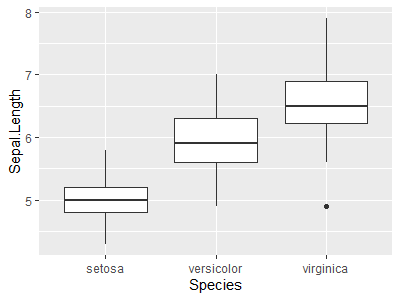
ボックスプロット(箱ひげ図)を描きます。
ggplot(data = iris, aes(x = Species, y = Sepal.Length)) +
  geom_boxplot()
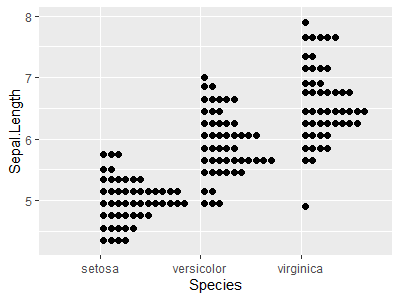
geom_dotplot(binaxis = "y")
ドットプロットを描きます。
ggplot(data = iris, aes(x = Species, y = Sepal.Length)) +
  geom_dotplot(binaxis = "y")

ggplot(data = iris, aes(x = Species, y = Sepal.Length)) +
  geom_dotplot(binaxis = "y", stackdir = "center")
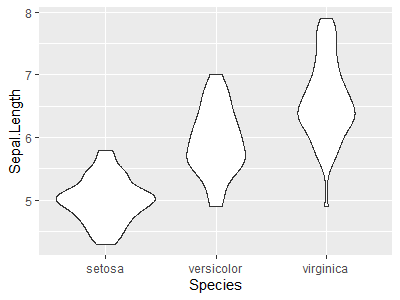
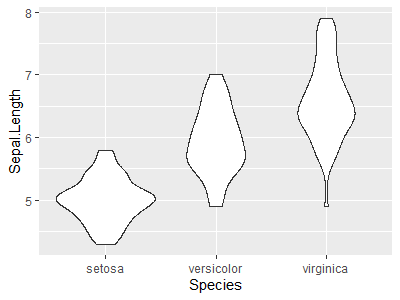
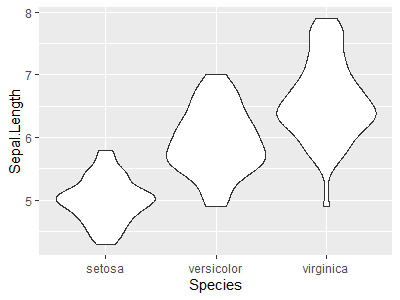
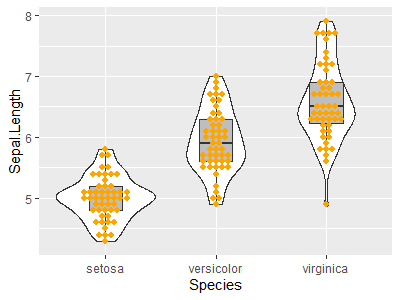
geom_violin()
バイオリンプロットを描きます。
scaleで描かれる各バイオリンの幅のスケーリングを指定できます。
-
scale = "area":各バイオリンの面積を同じに(デフォルト) -
scale = "count":各バイオリンの面積を観測数に比例した面積に -
scale = "width":各バイオリンの最大幅を同じに
ggplot(data = iris, aes(x = Species, y = Sepal.Length)) +
  geom_violin()
ggplot(data = iris, aes(x = Species, y = Sepal.Length)) +
  geom_violin(scale = "area")

ggplot(data = iris, aes(x = Species, y = Sepal.Length)) +
  geom_violin(scale = "count")

ggplot(data = iris, aes(x = Species, y = Sepal.Length)) +
  geom_violin(scale = "width")
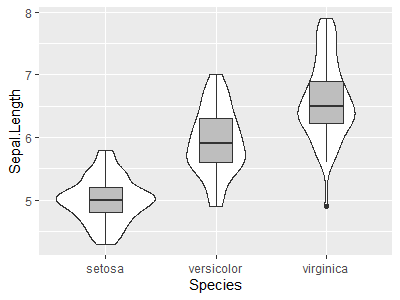
これらを重ね描きしてみます。
参考:https://yukiyanai.github.io/jp/classes/stat2/contents/R/intro-to-ggplot2.html
ggplot(data = iris, aes(x = Species, y = Sepal.Length)) +
  geom_violin() +
  geom_boxplot(width = 0.3, fill = "gray")

ggplot(data = iris, aes(x = Species, y = Sepal.Length)) +
  geom_violin() +
  geom_boxplot(width = 0.3, fill = "gray") +
  geom_dotplot(binaxis = "y", stackdir = "center", binwidth = 0.1,
               color = "orange", fill = "orange")
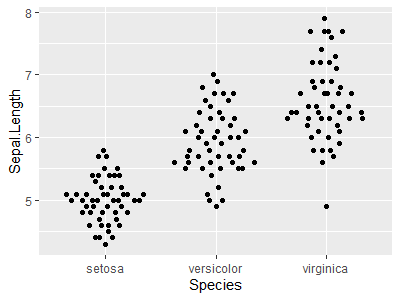
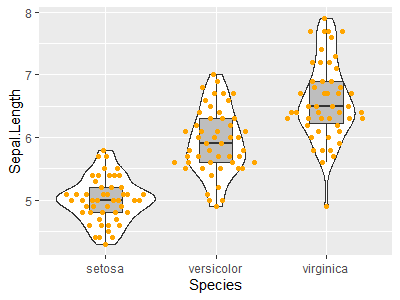
ggbeeswarm::geom_beeswarm()
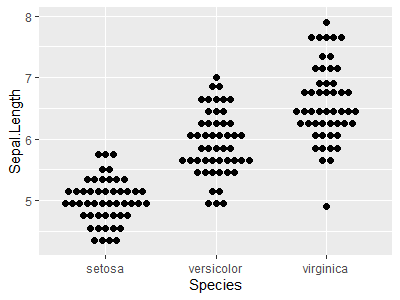
ggbeeswarmライブラリのgeom_beeswarm()でビースウォームプロット(蜂群図)(bee swarm plot)を描けます。
参考:https://yukiyanai.github.io/jp/classes/stat2/contents/R/intro-to-ggplot2.html
library(ggbeeswarm)

ggplot(data = iris, aes(x = Species, y = Sepal.Length)) +
  geom_quasirandom()

ggplot(data = iris, aes(x = Species, y = Sepal.Length)) +
  geom_violin() +
  geom_boxplot(width = 0.3, fill = "gray") +
  geom_quasirandom(color = "orange")
discrete x, discrete y
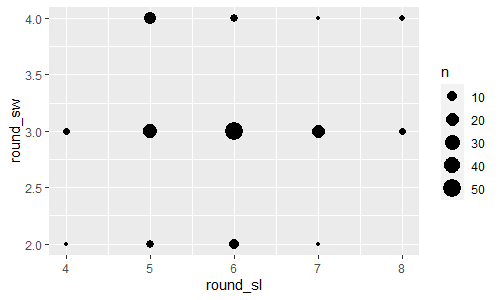
geom_count()
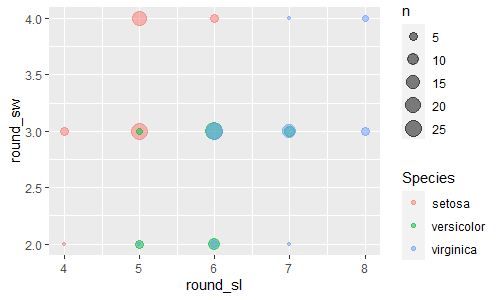
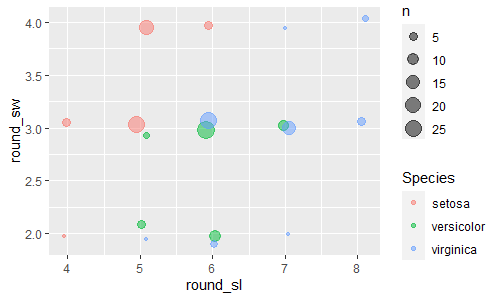
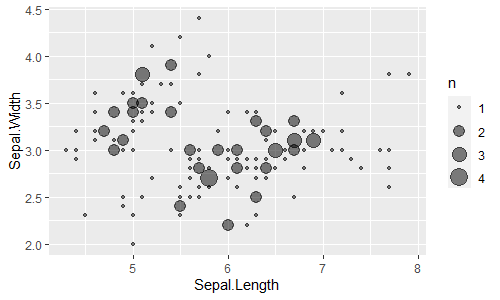
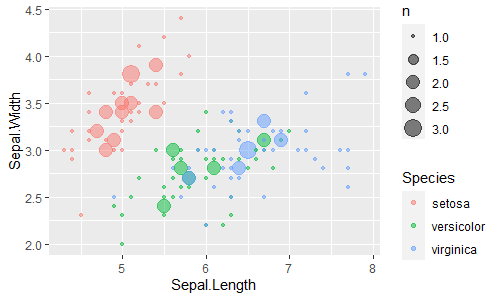
x軸、y軸の離散値ごとにカウントした値を点のサイズで表したグラフを描きます。
ggplot(data = iris_round, aes(x = round_sl, y = round_sw)) +
  geom_count()

ggplot(data = iris_round, aes(x = round_sl, y = round_sw, color = Species)) +
  geom_count(alpha = 0.5)

ggplot(data = iris_round, aes(x = round_sl, y = round_sw, color = Species)) +
  geom_count(position = position_jitter(width = 0.1, height = 0.1, seed = 1), alpha=0.5)
ggplot(data = iris, aes(x = Sepal.Length, y = Sepal.Width)) +
  geom_count(alpha = 0.5)

ggplot(data = iris, aes(x = Sepal.Length, y = Sepal.Width, color = Species)) +
  geom_count(alpha = 0.5)
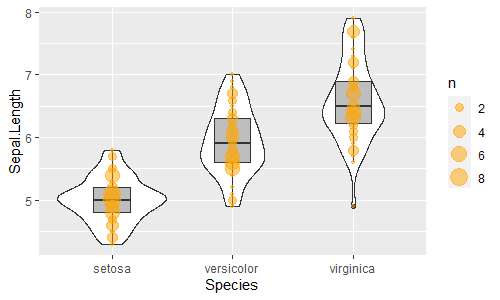
ボックスプロット(箱ひげ図)、バイオリンプロットと重ね描きしてみます。
ggplot(data = iris, aes(x = Species, y = Sepal.Length)) +
  geom_violin() +
  geom_boxplot(width = 0.3, fill = "gray") +
  geom_count(color = "orange", fill = "orange", alpha = 0.5)
continuous bivariate distribution
geom_bin2d()
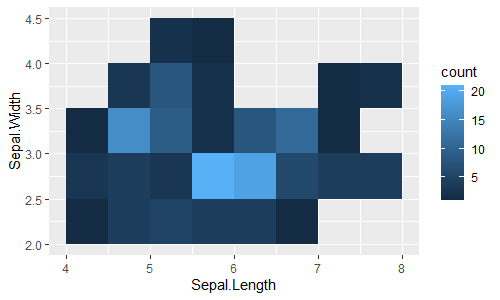
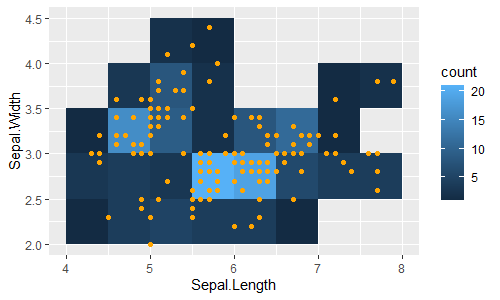
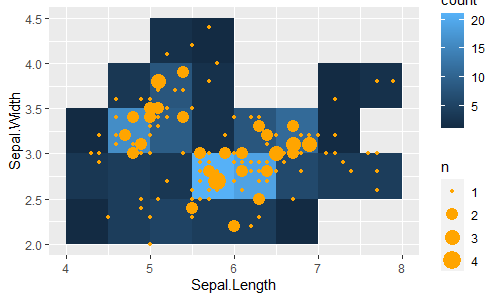
geom_histogram()がx軸に指定した連続値をstat_bin()で区切ったヒストグラム(1次元のヒストグラム)を描くのに対して、geom_bin2d()はx軸・y軸にそれぞれ指定した連続値をstat_bin2d()で区切った2次元のヒストグラムを描きます(ヒストグラムの高さを色で表現)。ビン幅binwidth も2次元のベクトルで指定します。
-
geom_histogram():1次元のヒストグラム -
geom_bin2d():2次元のヒストグラム
ggplot(data = iris, aes(x = Sepal.Length, y = Sepal.Width)) +
  geom_bin2d(binwidth = c(0.5, 0.5))

ggplot(data = iris, aes(x = Sepal.Length, y = Sepal.Width)) +
  geom_bin2d(binwidth = c(0.5, 0.5)) +
  geom_point(color = "orange")

ggplot(data = iris, aes(x = Sepal.Length, y = Sepal.Width)) +
  geom_bin2d(binwidth = c(0.5, 0.5)) +
  geom_count(color = "orange")
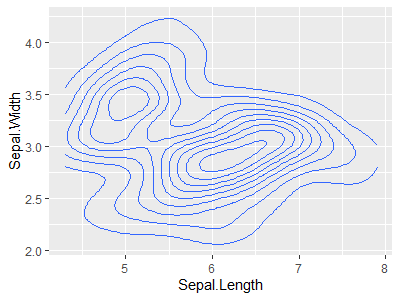
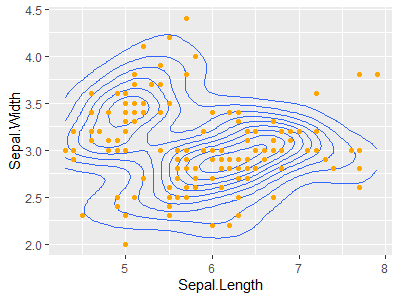
geom_density2d()
2次元の密度関数を等高線で描きます。
-
geom_density():1次元の密度関数 -
geom_density2d():2次元の密度関数
ggplot(data = iris, aes(x = Sepal.Length, y = Sepal.Width)) +
  geom_density2d()

ggplot(data = iris, aes(x = Sepal.Length, y = Sepal.Width)) +
  geom_density2d() +
  geom_point(color = "orange")

ggplot(data = iris, aes(x = Sepal.Length, y = Sepal.Width)) +
  geom_density2d() +
  geom_count(color = "orange")
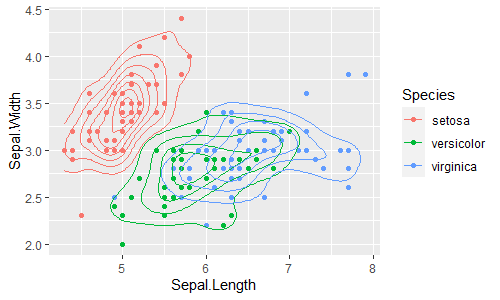
Speciesごとにも描けます。
ggplot(data = iris, aes(x = Sepal.Length, y = Sepal.Width, color = Species)) +
  geom_point() +
  geom_density2d()
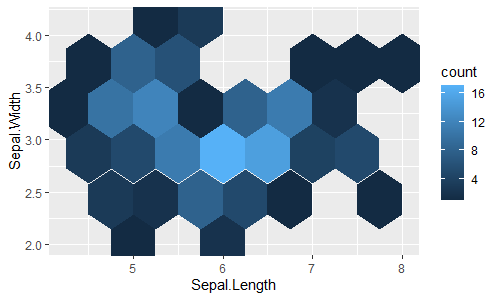
geom_hex()
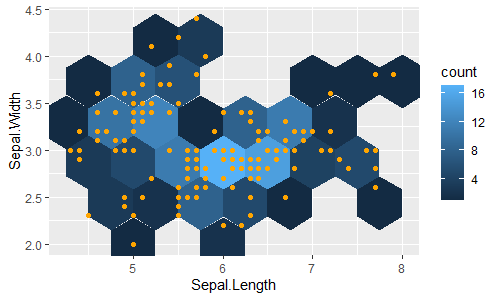
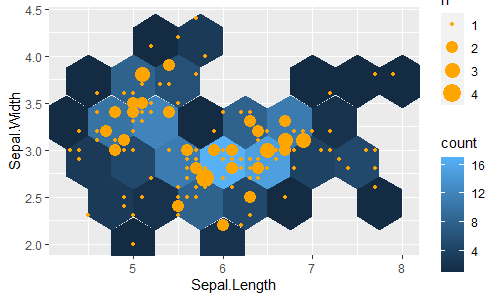
geom_bin2d()の六角形バージョンです。
-
geom_bin2d():2次元ヒストグラム -
geom_hex():2次元ヒストグラムの六角形版
ggplot(data = iris, aes(x = Sepal.Length, y = Sepal.Width)) +
  geom_hex(binwidth = c(0.5, 0.5))

ggplot(data = iris, aes(x = Sepal.Length, y = Sepal.Width)) +
  geom_hex(binwidth = c(0.5, 0.5)) +
  geom_point(color = "orange")

ggplot(data = iris, aes(x = Sepal.Length, y = Sepal.Width)) +
  geom_hex(binwidth = c(0.5, 0.5)) +
  geom_count(color = "orange")
continuous function
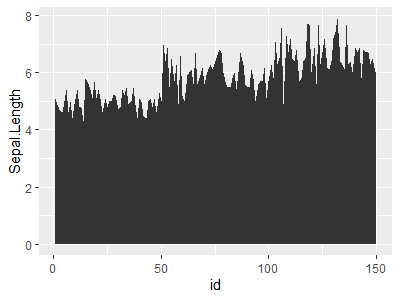
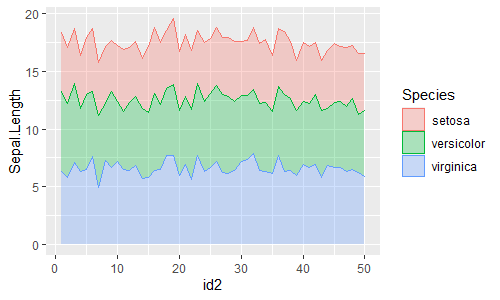
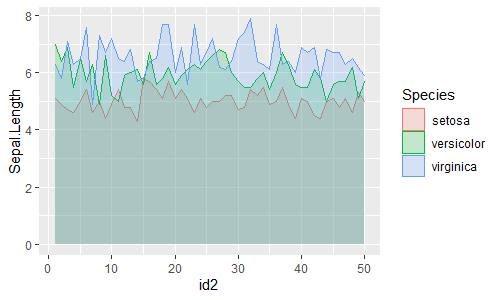
geom_area()
geom_line()が(x軸方向に沿った)折れ線を描くのに対して、geom_area()は折れ線より下の面を塗りつぶします(y軸方向に0~yの幅を持ったリボンを描くともいえます。)。
-
geom_line():(x軸方向に沿った)折れ線(折れ線グラフ)を描く -
geom_area():(x軸方向に沿った)面グラフ(積み上げ折れ線グラフ)を描く
ggplot(data = iris_id, aes(x = id, y = Sepal.Length)) +
  geom_area()

ggplot(data = iris_id, aes(x = id2, y = Sepal.Length, color = Species)) +
  geom_area(aes(fill = Species), alpha = 0.3)
ggplot(data = iris_id, aes(x = id2, y = Sepal.Length, color = Species)) +
  geom_area(aes(fill = Species), alpha = 0.3, position = "stack")
ggplot(data = iris_id, aes(x = id2, y = Sepal.Length, color = Species)) +
  geom_area(aes(fill = Species), alpha = 0.2, position = "identity")
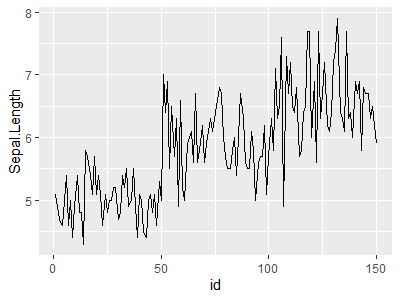
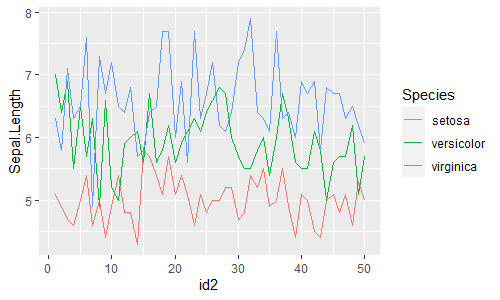
geom_line()
(x軸方向に沿った)折れ線を描きます。
ggplot(data = iris_id, aes(x = id, y = Sepal.Length)) +
  geom_line()

ggplot(data = iris_id, aes(x = id2, y = Sepal.Length, color = Species)) +
  geom_line()
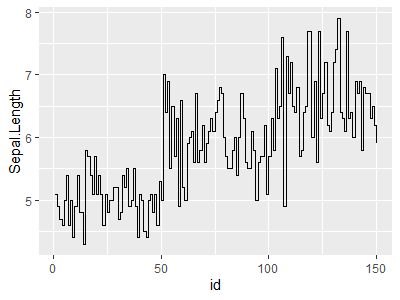
geom_step()
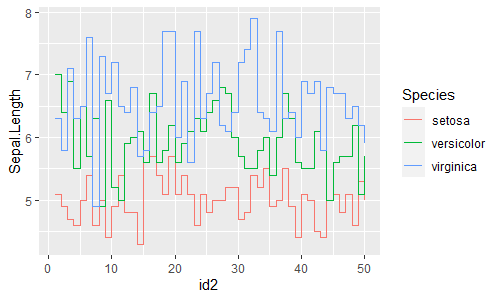
geom_line()のstep関数バージョンです。x軸に沿って階段状に結びます。
-
geom_line():(x軸方向に沿った)折れ線(折れ線グラフ)を描く(点を結ぶ) -
geom_step():(x軸方向に沿った)ステップ関数を描く(階段状に結ぶ)
ggplot(data = iris_id, aes(x = id, y = Sepal.Length)) +
  geom_step()

ggplot(data = iris_id, aes(x = id2, y = Sepal.Length, color = Species)) +
  geom_step()
visualizing error
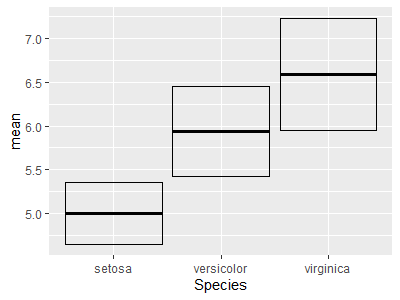
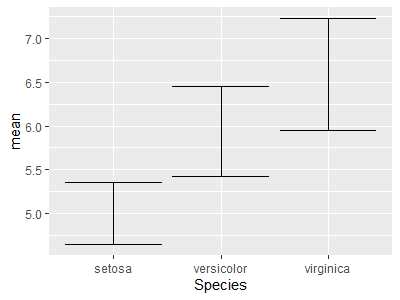
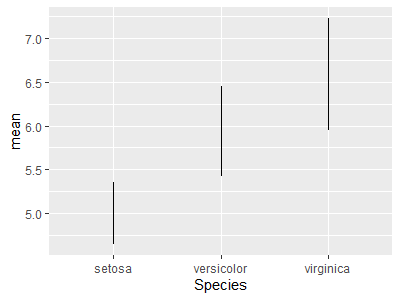
エラーバーを描きます。
geom_crossbar()
ggplot(data = iris_summary, aes(x = Species, y = mean, ymin = mean-sd, ymax = mean+sd)) +
  geom_crossbar()
geom_errorbar()
ggplot(data = iris_summary, aes(x = Species, y = mean, ymin = mean-sd, ymax = mean+sd)) +
  geom_errorbar()
geom_linerange()
ggplot(data = iris_summary, aes(x = Species, y = mean, ymin = mean-sd, ymax = mean+sd)) +
  geom_linerange()
geom_pointrange()
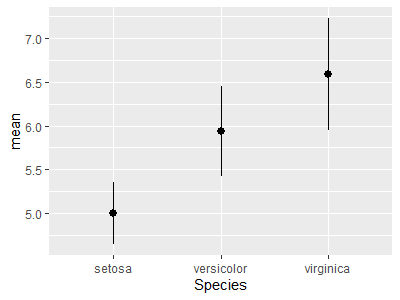
ggplot(data = iris_summary, aes(x = Species, y = mean, ymin = mean-sd, ymax = mean+sd)) +
  geom_pointrange()
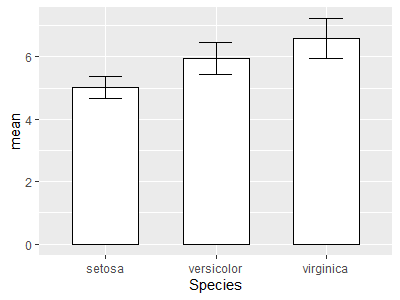
棒グラフと重ね描きしておきます。
ggplot(data = iris_summary, aes(x = Species, y = mean)) +
  geom_col(color = "black", fill = "white", width = 0.6) +
  geom_errorbar(aes(ymin = mean-sd, ymax = mean+sd), color = "black", width = 0.3)

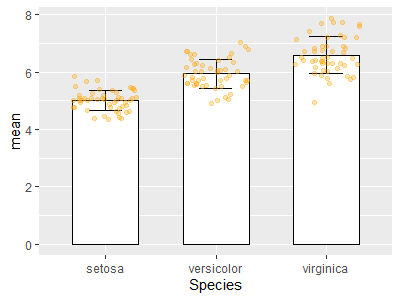
ggplot(data = iris_summary, aes(x = Species, y = mean)) +
  geom_col(color = "black", fill = "white", width = 0.6) +
  geom_errorbar(aes(ymin = mean-sd, ymax = mean+sd), color = "black", width = 0.3) +
  geom_jitter(data = iris, aes(y = Sepal.Length), color = "orange", width = 0.3, alpha = 0.3)
maps
geom_map()
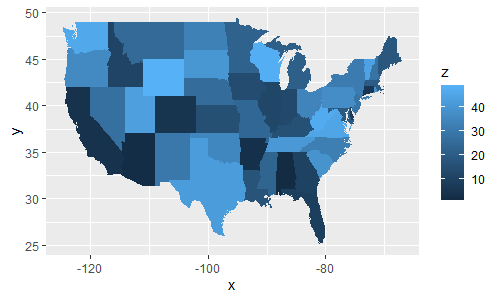
色分けしたマップを描きます(地図を塗り分けます)。
map <- map_data("state")
map$region
states <- unique(map$region)
states
length(states)
# [1] 49
df_us <- data.frame(state = states,
                    z = 1:length(states))
df_us
ggplot(data = df_us, aes(fill = z)) +
  geom_map(aes(map_id = state), map = map) +
  expand_limits(x = map$long, y = map$lat)
THREE VARIABLES
ここでは2次元正規分布のデータを使います。
library(mvtnorm)
mu <- c(0, 0)
sigma <- matrix(c(4, 2, 2, 3), ncol = 2)
x <- seq(-4, 4, by = 0.5)
y <- seq(-4, 4, by = 0.5)
xy <- expand.grid(x, y)
names(xy) <- c("x", "y")
z <- dmvnorm(xy, mean = mu, sigma = sigma)
df <- cbind(xy, z)
geom_contour()
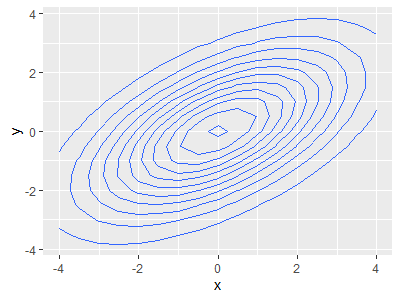
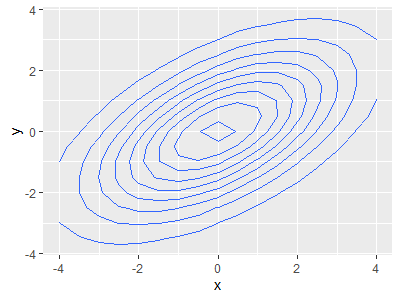
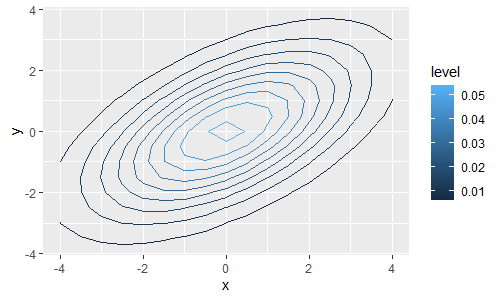
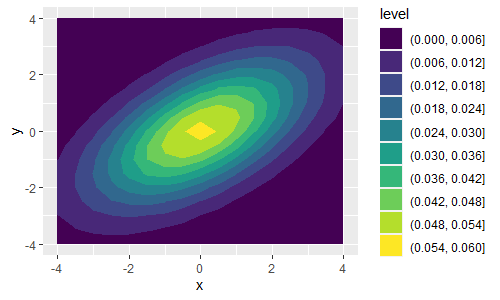
等高線を描きます。
ggplot(df, aes(x = x, y = y)) +
  geom_contour(aes(z = z))

ggplot(df, aes(x = x, y = y)) +
  geom_contour(aes(z = z), bins = 10)

ggplot(df, aes(x = x, y = y)) +
  geom_contour(aes(z = z, colour = ..level..), bins = 10)
ggplot(df, aes(x = x, y = y)) +
  geom_contour(aes(z = z, colour = stat(level)), bins = 10)
ggplot(df, aes(x = x, y = y)) +
  geom_contour(aes(z = z, colour = after_stat(level)), bins = 10)
ggplot(df, aes(x = x, y = y)) +
  geom_contour_filled(aes(z = z), bins = 10)
geom_raster()
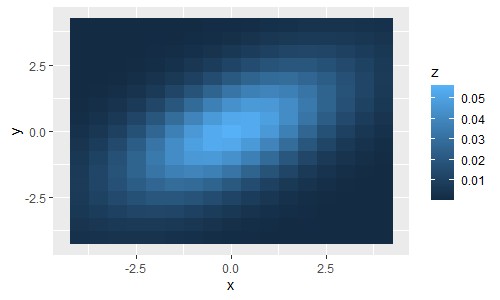
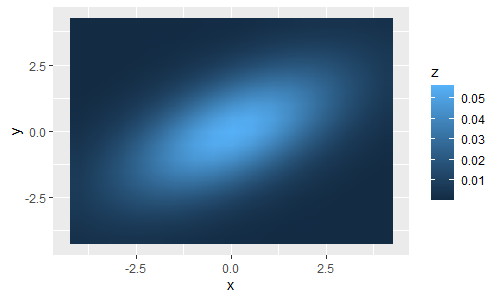
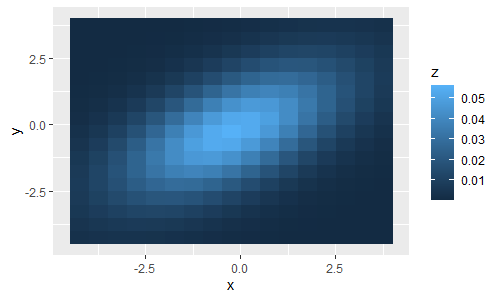
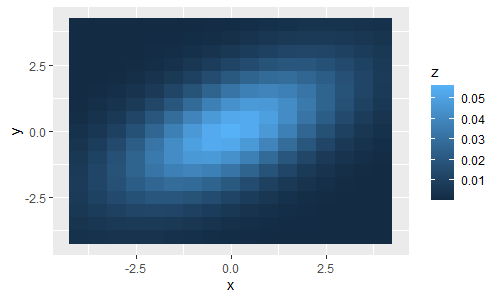
ヒートマップ表示(格子状(グリッド)に分けて色で表示)します。
geom_tile()はタイルの大きさを(x,y)座標ごとに変えられますが、geom_raster()はタイルの大きさをそろえるため高速らしいです。
参考:https://heavywatal.github.io/rstats/ggplot2.html#プロットの種類
ggplot(df, aes(x = x, y = y)) +
  geom_raster(aes(fill = z))
ggplot(df, aes(x = x, y = y)) +
  geom_raster(aes(fill = z), hjust = 0.5, vjust = 0.5, interpolate = FALSE)

ggplot(df, aes(x = x, y = y)) +
  geom_raster(aes(fill = z), hjust = 0.5, vjust = 0.5, interpolate = TRUE)

ggplot(df, aes(x = x, y = y)) +
  geom_raster(aes(fill = z), hjust = 0, vjust = 0, interpolate = FALSE)
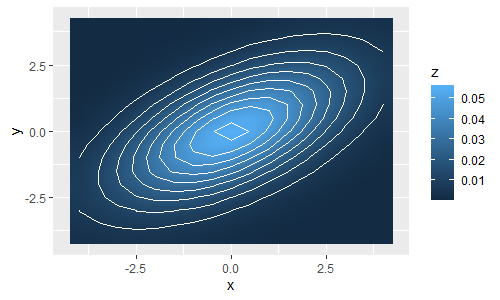
geom_contour()と重ね描きしておきます。
ggplot(df, aes(x = x, y = y)) +
  geom_raster(aes(fill = z), interpolate = TRUE) +
  geom_contour(aes(z = z), bins = 10, color = "white")
geom_tile()
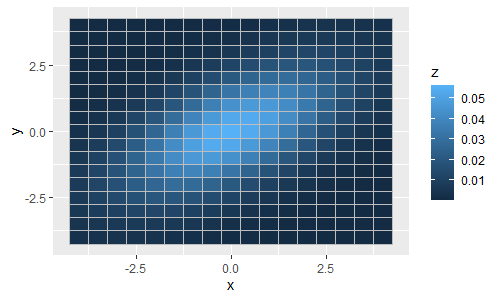
geom_tile()は長方形のタイルを敷き詰めたものを描きます。geom_rect()が長方形の頂点を指定するのに対して、geom_tile()は長方形の中心と幅を指定します。
-
geom_rect():頂点を指定して長方形を描く -
geom_tile():中心と幅を指定して長方形を描く
ggplot(df, aes(x = x, y = y)) +
    geom_tile(aes(fill = z))

ggplot(df, aes(x = x, y = y)) +
  geom_tile(aes(fill = z), color = "gray")

ggplot(df, aes(x = x, y = y)) +
  geom_rect(aes(xmin = x, xmax = x + 0.5,
                ymin = y, ymax = y + 0.5,
                fill = z), color = "gray")
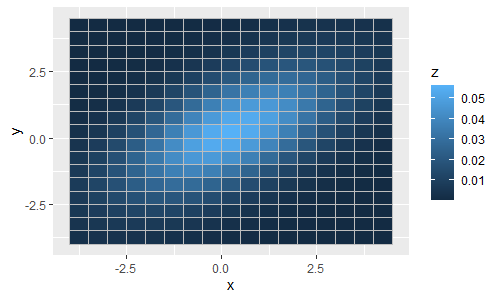
なので、次はどちらも同じ結果になります。
ggplot(df, aes(x = x, y = y)) +
  geom_rect(aes(xmin = x - 0.5/2, xmax = x + 0.5 - 0.5/2,
                ymin = y - 0.5/2, ymax = y + 0.5 - 0.5/2,
                fill = z), color = "gray")

ggplot(df, aes(x = x, y = y)) +
  geom_tile(aes(fill = z), width = 0.5, color = "gray")
Scales
scale_*()関数を使います。scale_*()関数については、こちらにまとめました。
Scales
scale_fill_manual()
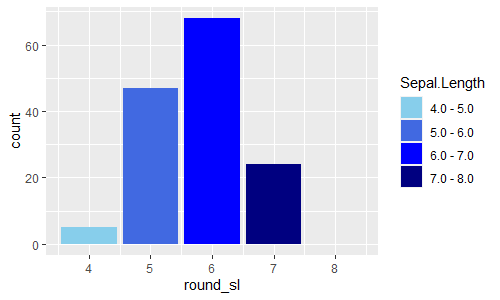
fill軸の手動による設定ができます。
ggplot(data = iris_round) +
  geom_bar(aes(x = round_sl, fill = factor(round_sl)))

ggplot(data = iris_round) +
  geom_bar(aes(x = round_sl, fill = factor(round_sl))) +
  scale_fill_manual(values = c("skyblue", "royalblue", "blue", "navy"),
                    limits = str_c(4:7),
                    breaks = str_c(4:7),
                    name = "Sepal.Length",
                    labels = str_c(4:7, ".0 - ", 4:7+1, ".0"))
GENERAL PURPOSE SCALES
X & Y LOCATION SCALES
scale_x_log10()
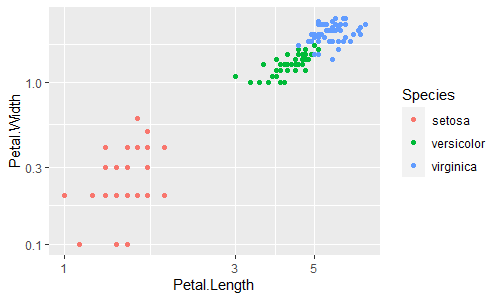
x軸をlogスケール(対数目盛)にします。
y軸の場合はscale_y_log10()を使います。
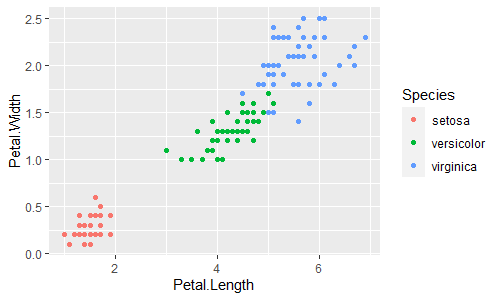
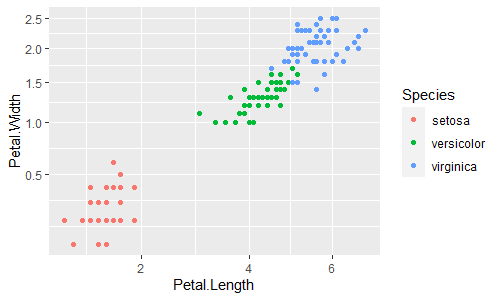
ggplot(data = iris, aes(x = Petal.Length, y = Petal.Width, color = Species)) +
  geom_point()

ggplot(data = iris, aes(x = Petal.Length, y = Petal.Width, color = Species)) +
  geom_point() +
  scale_x_log10() + scale_y_log10()
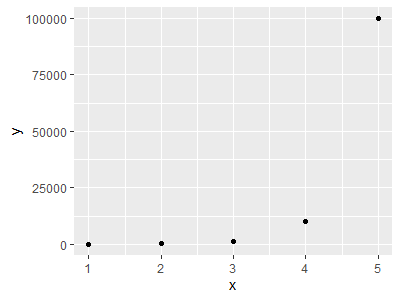
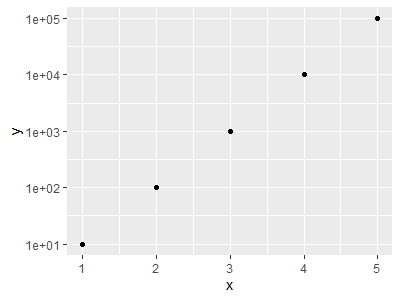
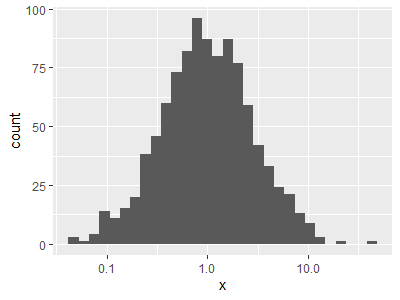
logスケール(対数目盛)の効果がわかりやすいように別のデータでも描いておきます。
x <- 1:5
y <- 10^x

ggplot(data = data.frame(x, y), aes(x = x, y = y)) +
  geom_point()

ggplot(data = data.frame(x, y), aes(x = x, y = y)) +
  geom_point() +
  scale_y_log10()
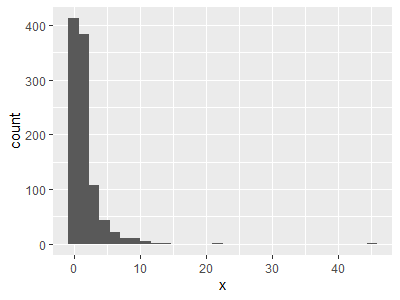
set.seed(1)
x <- rlnorm(1000, meanlog = 0, sdlog = 1)

ggplot() +
  geom_histogram(aes(x = x))

ggplot() +
  geom_histogram(aes(x = x)) +
  scale_x_log10()
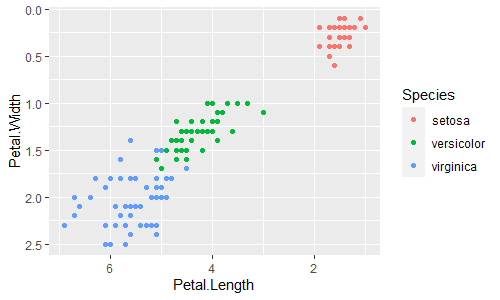
scale_x_reverse()
x軸を反転します。
y軸の場合はscale_y_reverse()を使います。
ggplot(data = iris, aes(x = Petal.Length, y = Petal.Width, color = Species)) +
  geom_point()

ggplot(data = iris, aes(x = Petal.Length, y = Petal.Width, color = Species)) +
  geom_point() +
  scale_x_reverse() + scale_y_reverse()
scale_x_sqrt()
x軸をsqrtスケールにします。
y軸の場合はscale_y_sqrt()を使います。
ggplot(data = iris, aes(x = Petal.Length, y = Petal.Width, color = Species)) +
  geom_point()

ggplot(data = iris, aes(x = Petal.Length, y = Petal.Width, color = Species)) +
  geom_point() +
  scale_x_sqrt() + scale_y_sqrt()
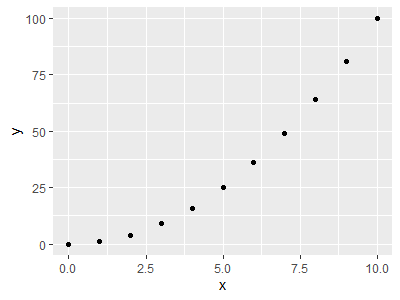
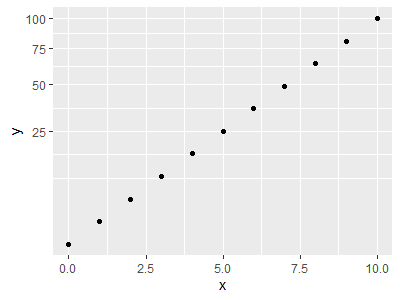
sqrtスケールの効果がわかりやすいように別のデータでも描いておきます。
x <- seq(0, 10, by = 1)
y <- x ^ 2

ggplot(data = data.frame(x, y), aes(x = x, y = y)) +
  geom_point()

ggplot(data = data.frame(x, y), aes(x = x, y = y)) +
  geom_point() +
  scale_y_sqrt()
COLOR AND FILL SCALES (DISCRETE)
離散値の場合のcolor・fill軸の設定です。
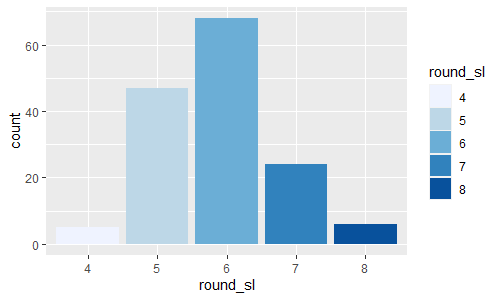
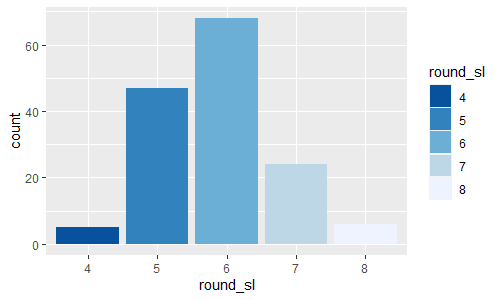
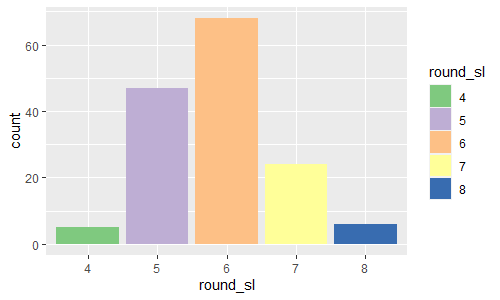
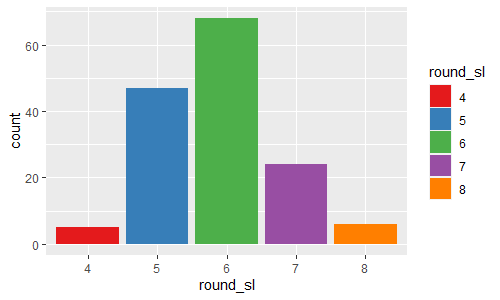
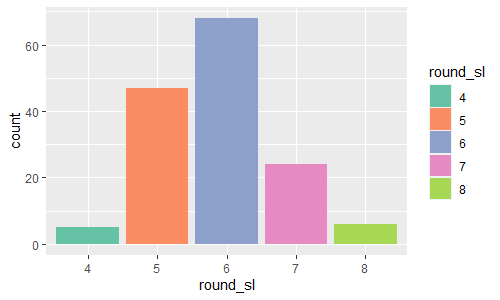
scale_fill_brewer()
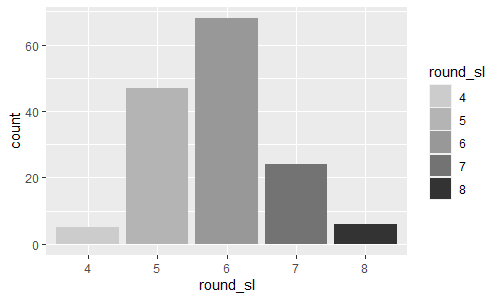
ggplot(data = iris_round) +
  geom_bar(aes(x = round_sl, fill = round_sl)) +
  scale_fill_brewer(palette = "Blues")

ggplot(data = iris_round) +
  geom_bar(aes(x = round_sl, fill = round_sl)) +
  scale_fill_brewer(palette = "Blues", direction = -1)

ggplot(data = iris_round) +
  geom_bar(aes(x = round_sl, fill = round_sl)) +
  scale_fill_brewer(palette = "Accent")

ggplot(data = iris_round) +
  geom_bar(aes(x = round_sl, fill = round_sl)) +
  scale_fill_brewer(palette = "Set1")

ggplot(data = iris_round) +
  geom_bar(aes(x = round_sl, fill = round_sl)) +
  scale_fill_brewer(palette = "Set2")

ggplot(data = iris_round) +
  geom_bar(aes(x = round_sl, fill = round_sl)) +
  scale_fill_brewer(palette = "Set3")
scale_fill_grey()
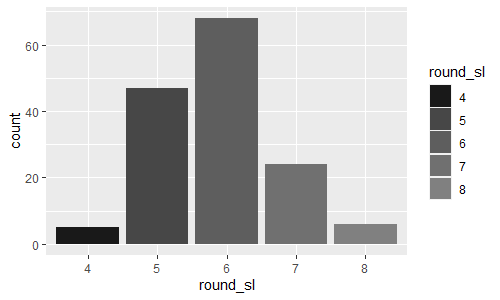
ggplot(data = iris_round) +
  geom_bar(aes(x = round_sl, fill = round_sl)) +
  scale_fill_grey(start = 0.8, end = 0.2, na.value = "red")

ggplot(data = iris_round) +
  geom_bar(aes(x = round_sl, fill = round_sl)) +
  scale_fill_grey(start = 0.1, end = 0.5, na.value = "red")
COLOR AND FILL SCALES (CONTINUOUS)
連続値の場合のcolor・fill軸の設定です。
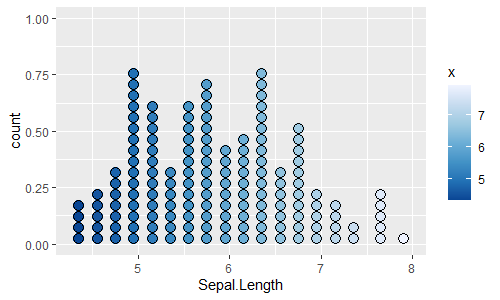
scale_fill_distiller()
ggplot(data = iris, aes(Sepal.Length)) +
  geom_dotplot()

ggplot(data = iris, aes(Sepal.Length)) +
  geom_dotplot(aes(fill = ..x..)) +
  scale_fill_distiller(palette = "Blues")
ggplot(data = iris, aes(Sepal.Length)) +
  geom_dotplot(aes(fill = stat(x))) +
  scale_fill_distiller(palette = "Blues")
ggplot(data = iris, aes(Sepal.Length)) +
  geom_dotplot(aes(fill = after_stat(x))) +
  scale_fill_distiller(palette = "Blues")
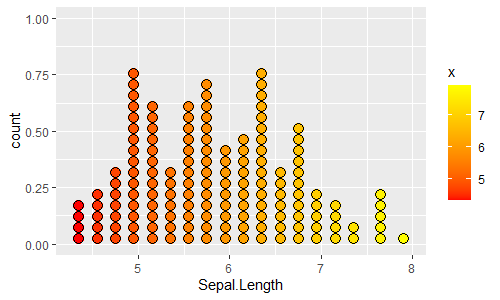
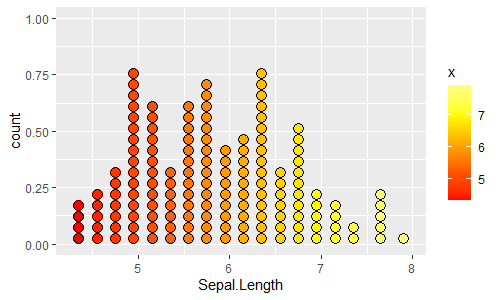
scale_fill_gradient()
ggplot(data = iris, aes(Sepal.Length)) +
  geom_dotplot(aes(fill = ..x..)) +
  scale_fill_gradient(low = "red", high = "yellow")
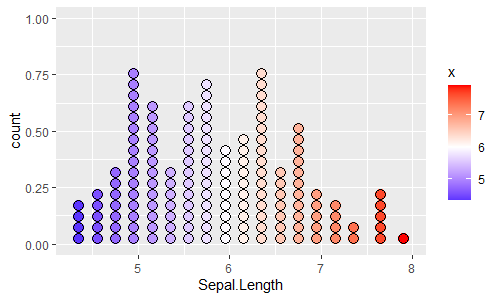
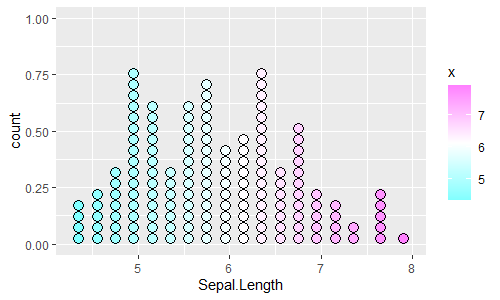
scale_fill_gradient2()
ggplot(data = iris, aes(Sepal.Length)) +
  geom_dotplot(aes(fill = ..x..)) +
  scale_fill_gradient2(low = "blue", high = "red", mid = "white", midpoint = 6)
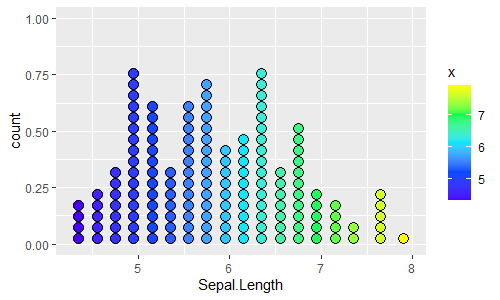
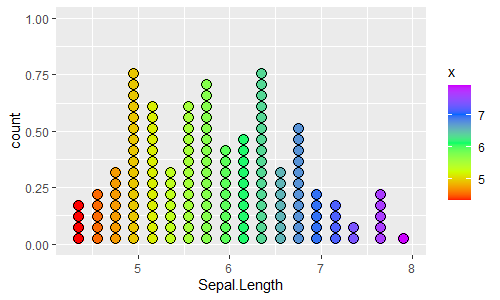
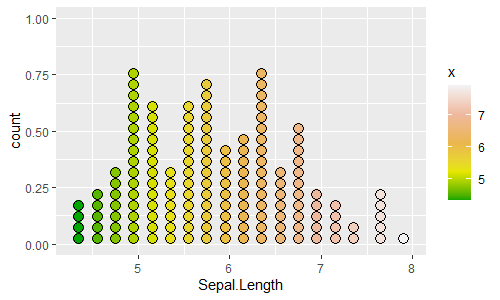
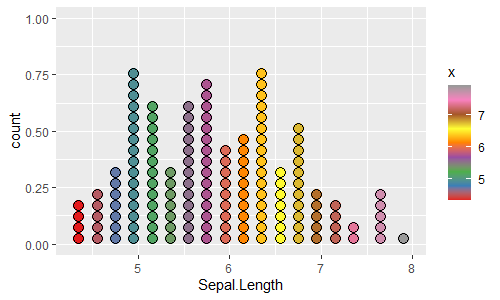
scale_fill_gradientn()
ggplot(data = iris, aes(Sepal.Length)) +
  geom_dotplot(aes(fill = ..x..)) +
  scale_fill_gradientn(colours = topo.colors(5))

ggplot(data = iris, aes(Sepal.Length)) +
  geom_dotplot(aes(fill = ..x..)) +
  scale_fill_gradientn(colours = rainbow(5))

ggplot(data = iris, aes(Sepal.Length)) +
  geom_dotplot(aes(fill = ..x..)) +
  scale_fill_gradientn(colours = heat.colors(5))

ggplot(data = iris, aes(Sepal.Length)) +
  geom_dotplot(aes(fill = ..x..)) +
  scale_fill_gradientn(colours = terrain.colors(5))

ggplot(data = iris, aes(Sepal.Length)) +
  geom_dotplot(aes(fill = ..x..)) +
  scale_fill_gradientn(colours = cm.colors(5))
ggplot(data = iris, aes(Sepal.Length)) +
  geom_dotplot(aes(fill = ..x..)) +
  scale_fill_gradientn(colours = RColorBrewer::brewer.pal(name = "Set1", n = 9))

ggplot(data = iris, aes(Sepal.Length)) +
  geom_dotplot(aes(fill = ..x..)) +
  scale_fill_gradientn(colours = RColorBrewer::brewer.pal(name = "Set2", n = 8))
topo.colors(5)
# [1] "#4C00FFFF" "#004CFFFF" "#00E5FFFF" "#00FF4DFF" "#FFFF00FF"
rainbow(5)
# [1] "#FF0000FF" "#CCFF00FF" "#00FF66FF" "#0066FFFF" "#CC00FFFF"
heat.colors(5)
# [1] "#FF0000FF" "#FF5500FF" "#FFAA00FF" "#FFFF00FF" "#FFFF80FF"
terrain.colors(5)
# [1] "#00A600FF" "#E6E600FF" "#EAB64EFF" "#EEB99FFF" "#F2F2F2FF"
cm.colors(5)
# [1] "#80FFFFFF" "#BFFFFFFF" "#FFFFFFFF" "#FFBFFFFF" "#FF80FFFF"
RColorBrewer::brewer.pal(name = "Set1", n = 9)
# [1] "#E41A1C" "#377EB8" "#4DAF4A" "#984EA3" "#FF7F00" "#FFFF33" "#A65628" "#F781BF" "#999999"
RColorBrewer::brewer.pal(name = "Set2", n = 8)
# [1] "#66C2A5" "#FC8D62" "#8DA0CB" "#E78AC3" "#A6D854" "#FFD92F" "#E5C494" "#B3B3B3"
SHAPE AND SIZE SCALES
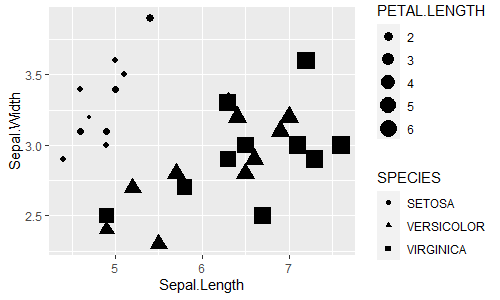
shape軸やsize軸の設定です。
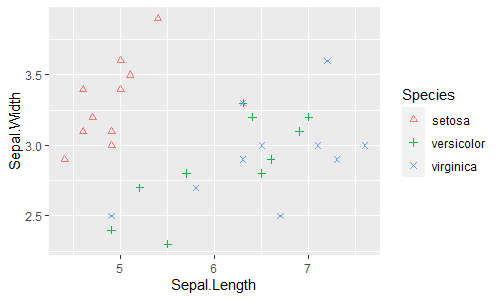
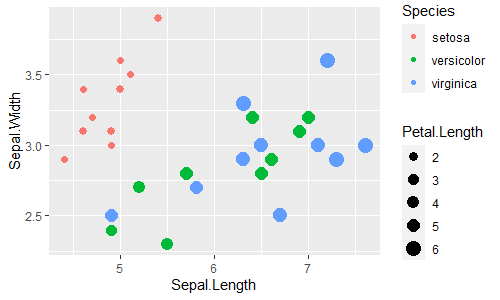
scale_shape(), scale_size()
ggplot(data = iris_head10, aes(x = Sepal.Length, y = Sepal.Width)) +
  geom_point(aes(shape = Species, size = Petal.Length)) +
  scale_shape(name = toupper("Species"),
              label = toupper(unique(iris$Species))) +
  scale_size(name = toupper("Petal.Length"))
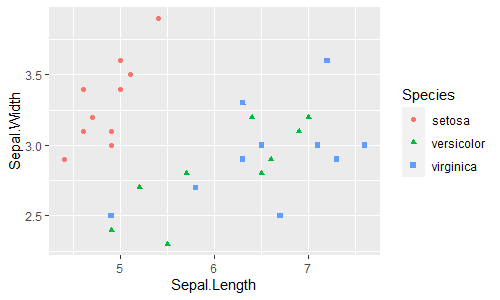
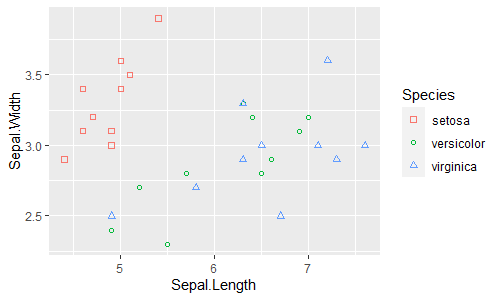
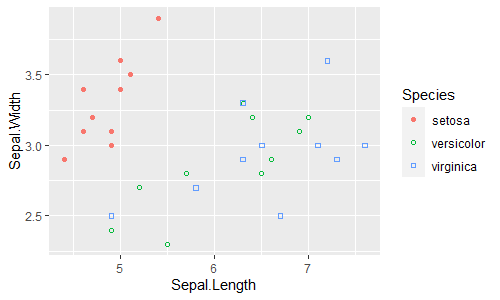
scale_shape_manual()
shape軸を手動で設定します。
ggplot(data = iris_head10, aes(x = Sepal.Length, y = Sepal.Width)) +
  geom_point(aes(color = Species, shape = Species))

ggplot(data = iris_head10, aes(x = Sepal.Length, y = Sepal.Width)) +
  geom_point(aes(color = Species, shape = Species)) +
  scale_shape_manual(values = 0:2)

ggplot(data = iris_head10, aes(x = Sepal.Length, y = Sepal.Width)) +
  geom_point(aes(color = Species, shape = Species)) +
  scale_shape_manual(values = 2:4)

ggplot(data = iris_head10, aes(x = Sepal.Length, y = Sepal.Width)) +
  geom_point(aes(color = Species, shape = Species)) +
  scale_shape_manual(values = c(19,21,22))
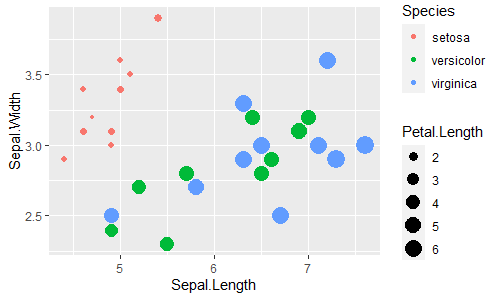
scale_radius()
size軸の半径を設定します。
ggplot(data = iris_head10, aes(x = Sepal.Length, y = Sepal.Width)) +
  geom_point(aes(color = Species, size = Petal.Length))

ggplot(data = iris_head10, aes(x = Sepal.Length, y = Sepal.Width)) +
  geom_point(aes(color = Species, size = Petal.Length)) +
  scale_radius(range = c(1,9))
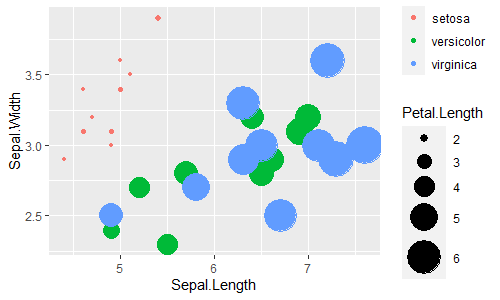
scale_size_area()
size軸の面積を設定します。
ggplot(data = iris_head10, aes(x = Sepal.Length, y = Sepal.Width)) +
  geom_point(aes(color = Species, size = Petal.Length)) +
  scale_size_area(max_size = 5)
Coordinate Systems
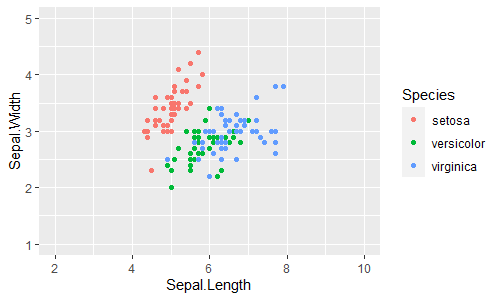
coord_cartesian()
直交座標$(x, y)$の座標軸の設定です。
ggplot(data = iris, aes(x = Sepal.Length, y = Sepal.Width)) +
  geom_point(aes(color = Species)) +
  coord_cartesian(xlim = c(2, 10), ylim = c(1, 5))
ggplot(data = iris, aes(x = Sepal.Length, y = Sepal.Width)) +
  geom_point(aes(color = Species)) +
  xlim(2, 10) + ylim(1, 5)
coord_fixed()
x軸(横軸)、y軸(縦軸)の比を固定します。
coord_fixed(ratio = 1)で縦横の比が同じになります。
ggplot(data = iris, aes(x = Sepal.Length, y = Sepal.Width)) +
  geom_point(aes(color = Species)) +
  coord_fixed(ratio = 1)
coord_flip()
x軸(横軸)とy軸(縦軸)を入れ替えます。
ggplot(data = iris, aes(x = Sepal.Length, y = Sepal.Width)) +
  geom_point(aes(color = Species))

ggplot(data = iris, aes(x = Sepal.Length, y = Sepal.Width)) +
  geom_point(aes(color = Species)) +
  coord_flip()
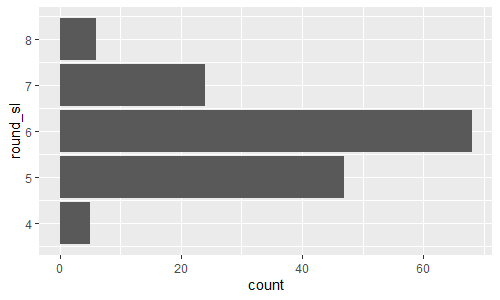
ggplot(data = iris_round, aes(x = round_sl)) +
  geom_bar()

ggplot(data = iris_round, aes(x = round_sl)) +
  geom_bar() +
  coord_flip()
coord_polar()
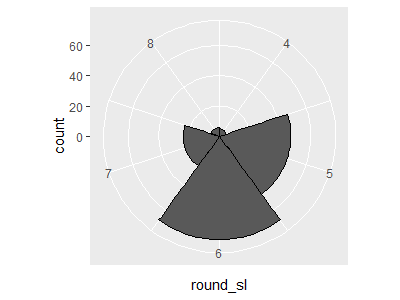
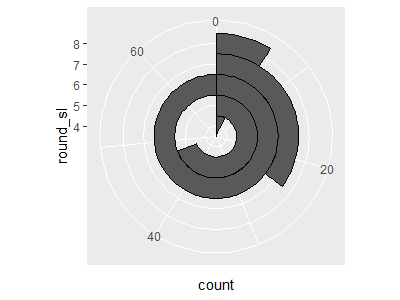
通常の直交座標$(x, y)$ではなく、極座標$(r, \theta)$でグラフを描きます。
もとの座標系の$x$と$y$のどちらを極座標の$\theta$にするかを指定します。
ggplot(data = iris_round, aes(x = round_sl)) +
  geom_bar(width = 1, color = "black")

ggplot(data = iris_round, aes(x = round_sl)) +
  geom_bar(width = 1, color = "black") +
  coord_polar(theta = "x")

ggplot(data = iris_round, aes(x = round_sl)) +
  geom_bar(width = 1, color = "black") +
  coord_polar(theta = "y")
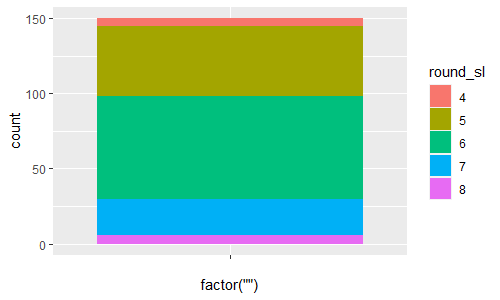
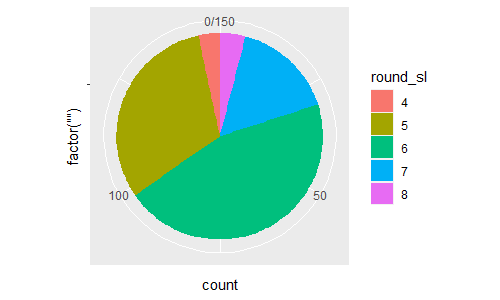
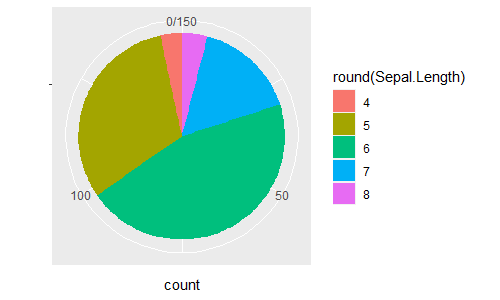
これを使うと円グラフ(パイチャート)が描けます。
参考:https://www.jaysong.net/RBook/visualization1.html
ggplot(data = iris_round) +
  geom_bar(aes(x = factor(""), fill = round_sl))

ggplot(data = iris_round) +
  geom_bar(aes(x = factor(""), fill = round_sl)) +
  coord_polar(theta = "y")

ggplot(data = iris_round) +
  geom_bar(aes(x = factor(""), fill = round_sl)) +
  labs(fill = "round(Sepal.Length)", x = "", y = "count") +
  coord_polar(theta = "y")
詳しくはこちら参照。
coord_trans()
座標軸のスケール変換ができます。
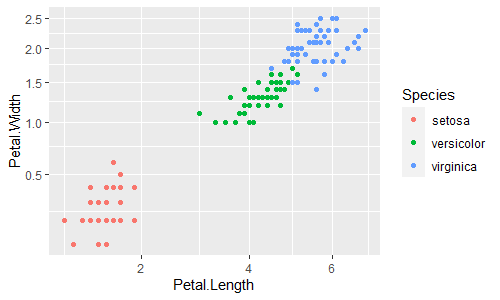
ggplot(data = iris, aes(x = Petal.Length, y = Petal.Width, color = Species)) +
  geom_point() +
  scale_x_sqrt() + scale_y_sqrt()
ggplot(data = iris, aes(x = Petal.Length, y = Petal.Width, color = Species)) +
  geom_point() +
  coord_trans(x = "sqrt", y = "sqrt")

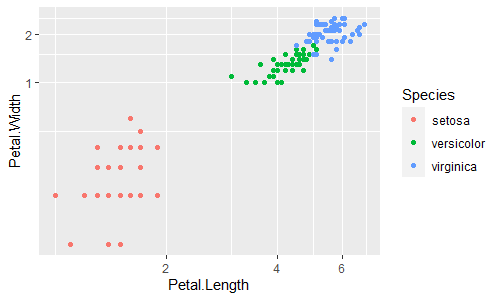
ggplot(data = iris, aes(x = Petal.Length, y = Petal.Width, color = Species)) +
  geom_point() +
  scale_x_log10() + scale_y_log10()
ggplot(data = iris, aes(x = Petal.Length, y = Petal.Width, color = Species)) +
  geom_point() +
  coord_trans(x = "log10", y = "log10")
coord_quickmap(), coord_map()
Position Adjustments
geom_bar()の中で
-
position = "stack":積み上げ棒グラフ(エクセルの「積み上げ縦棒」) -
position = "fill":全体を100%にした積み上げ棒グラフ(エクセルの「100%積み上げ縦棒」) -
position = "identity":棒グラフの重ね合わせ -
position = "dodge":横並びの棒グラフ(エクセルの「集合縦棒」)
ggplot(data = iris_round, aes(x = round_sl, fill = Species)) +
  geom_bar(position = "stack")
ggplot(data = iris_round, aes(x = round_sl, fill = Species)) +
  geom_bar(position = "fill")
ggplot(data = iris_round, aes(x = round_sl, fill = Species)) +
  geom_bar(position = "identity", alpha = 0.3)
ggplot(data = iris_round, aes(x = round_sl, fill = Species)) +
  geom_bar(position = "dodge")
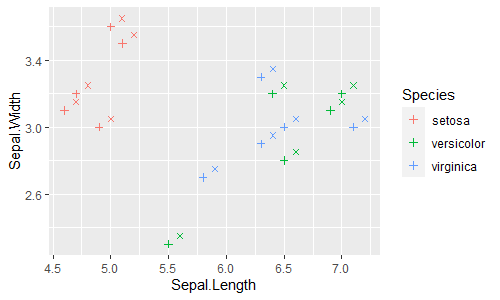
geom_point()の中で
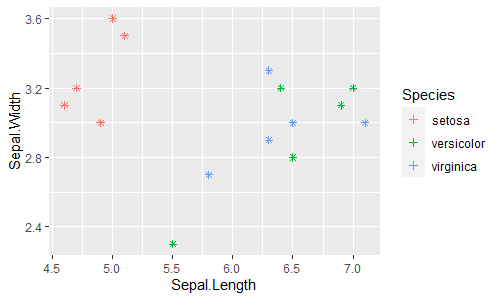
-
position = "identity":座標の位置に配置 -
position = "jitter":座標の位置を中心にランダムにばらけさせた位置に配置 -
position = position_jitter():座標の位置を中心にランダムにばらけさせた位置に配置 -
position = position_nudge():座標の位置から指定した距離ずらした位置に配置
ggplot(data = iris_head5, aes(x = Sepal.Length, y = Sepal.Width, color = Species)) +
  geom_point(shape = 3) +  # +印
  geom_point(shape = 4)    # x印

ggplot(data = iris_head5, aes(x = Sepal.Length, y = Sepal.Width, color = Species)) +
  geom_point(shape = 3) +
  geom_point(shape = 4, position = "identity", show.legend = FALSE)

set.seed(1)
ggplot(data = iris_head5, aes(x = Sepal.Length, y = Sepal.Width, color = Species)) +
  geom_point(shape = 3) +
  geom_point(shape = 4, position = "jitter", show.legend = FALSE)

ggplot(data = iris_head5, aes(x = Sepal.Length, y = Sepal.Width, color = Species)) +
  geom_point(shape = 3) +
  geom_point(shape = 4, position = position_jitter(width = 0.1, height = 0.05, seed = 1), show.legend = FALSE)

ggplot(data = iris_head5, aes(x = Sepal.Length, y = Sepal.Width, color = Species)) +
  geom_point(shape = 3) +
  geom_point(shape = 4, position = position_nudge(x = 0.1, y =0.05), show.legend = FALSE)
geom_text(), geom_label()の中で
-
position = "identity":座標の位置に配置 -
position = "jitter":座標の位置を中心にランダムにばらけさせた位置に配置 -
position = position_jitter():座標の位置を中心にランダムにばらけさせた位置に配置 -
position = position_nudge():座標の位置から指定した距離ずらした位置に配置
ggplot(data = iris_head5, aes(x = Sepal.Length, y = Sepal.Width, color = Species)) +
  geom_point() +
  geom_text(aes(label = id2), size = 3,
            position = position_nudge(x = 0.1, y = 0.05), show.legend = FALSE)
ggplot(data = iris_head5, aes(x = Sepal.Length, y = Sepal.Width, color = Species)) +
  geom_point() +
  geom_text(aes(label = id2), size = 3,
            nudge_x = 0.1, nudge_y = 0.05, show.legend = FALSE)

ggplot(data = iris_head5, aes(x = Sepal.Length, y = Sepal.Width, color = Species)) +
  geom_point() +
  geom_text(aes(label = id2), size = 3,
            position = position_nudge(x = 0.1, y = 0.05), show.legend = FALSE)
ggplot(data = iris_head5, aes(x = Sepal.Length, y = Sepal.Width)) +
  geom_point(aes(color = Species)) +
  geom_text(aes(label = id2), size = 3,
            position = position_nudge(x = 0.1, y = 0.05), show.legend = FALSE)
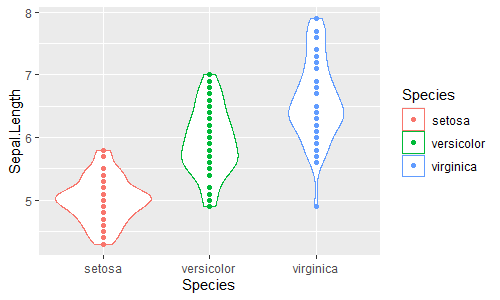
ggplot(data = iris_id, aes(x = Species, y = Sepal.Length, color = Species)) +
  geom_violin() +
  geom_point()

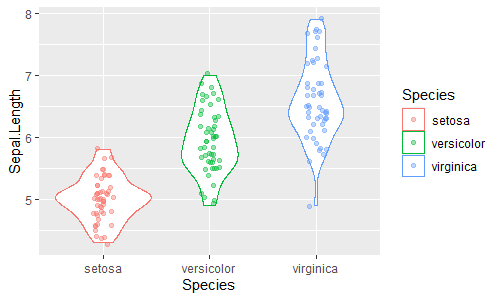
ggplot(data = iris_id, aes(x = Species, y = Sepal.Length, color = Species)) +
  geom_violin() +
  geom_point(position = position_jitter(width = 0.1), alpha = 0.4)

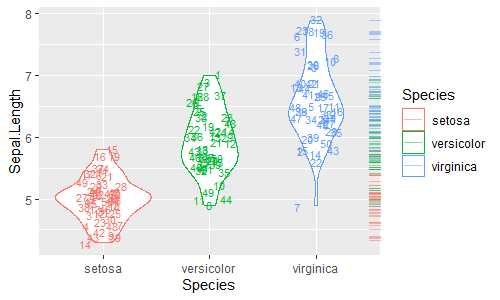
ggplot(data = iris_id, aes(x = Species, y = Sepal.Length, color = Species)) +
  geom_violin() +
  geom_text(aes(label = id2), size = 3, position = position_jitter(width = 0.2), show.legend = FALSE) +
  geom_rug(sides = "r", position = "jitter", alpha = 0.5)
こちらも参照。
Themes
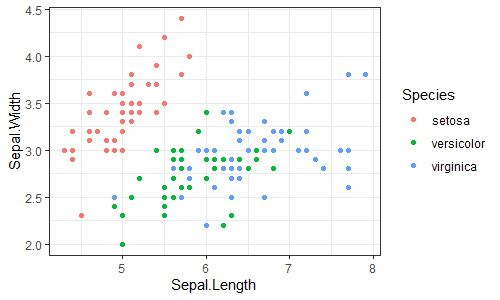
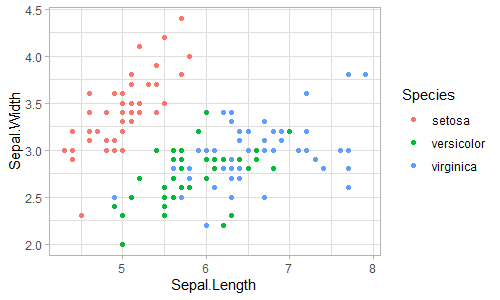
ggplot(data = iris, aes(x = Sepal.Length, y = Sepal.Width, color = Species)) +
  geom_point() +
  theme_bw()
ggplot(data = iris, aes(x = Sepal.Length, y = Sepal.Width, color = Species)) +
  geom_point() +
  theme_gray()
ggplot(data = iris, aes(x = Sepal.Length, y = Sepal.Width, color = Species)) +
  geom_point() +
  theme_grey()
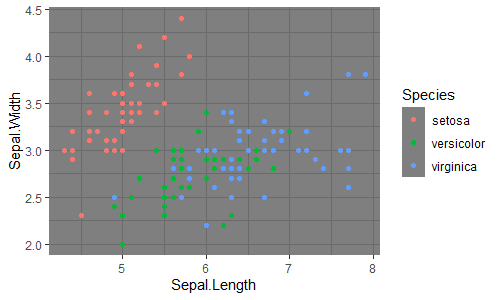
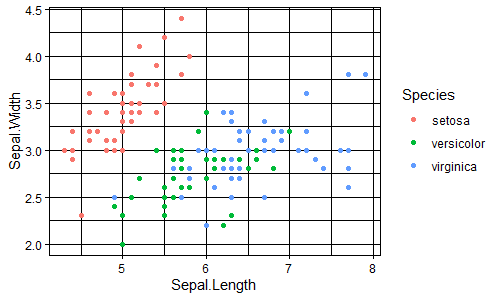
ggplot(data = iris, aes(x = Sepal.Length, y = Sepal.Width, color = Species)) +
  geom_point() +
  theme_dark()
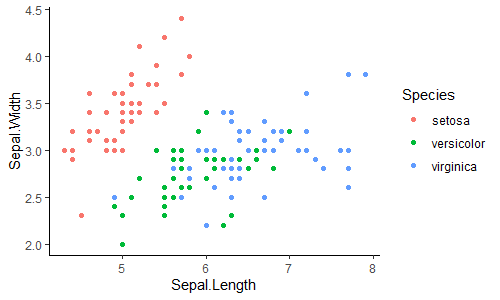
ggplot(data = iris, aes(x = Sepal.Length, y = Sepal.Width, color = Species)) +
  geom_point() +
  theme_classic()
ggplot(data = iris, aes(x = Sepal.Length, y = Sepal.Width, color = Species)) +
  geom_point() +
  theme_light()
ggplot(data = iris, aes(x = Sepal.Length, y = Sepal.Width, color = Species)) +
  geom_point() +
  theme_linedraw()
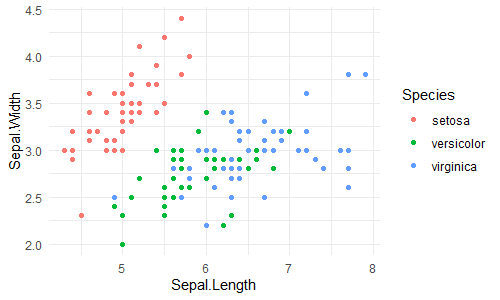
ggplot(data = iris, aes(x = Sepal.Length, y = Sepal.Width, color = Species)) +
  geom_point() +
  theme_minimal()
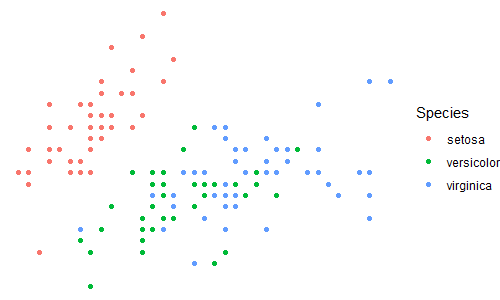
ggplot(data = iris, aes(x = Sepal.Length, y = Sepal.Width, color = Species)) +
  geom_point() +
  theme_void()
Faceting
facet_grid()
ggplot(data = iris, aes(x = Sepal.Length, y = Sepal.Width)) +
  geom_point() +
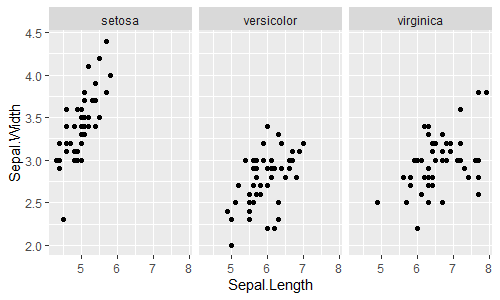
  facet_grid(cols = vars(Species))
ggplot(data = iris, aes(x = Sepal.Length, y = Sepal.Width)) +
  geom_point() +
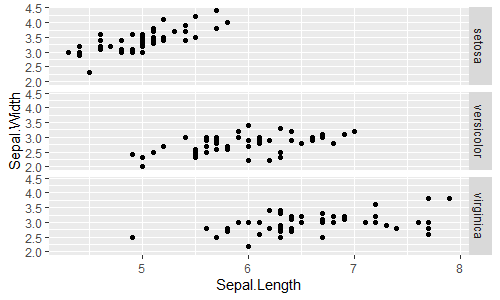
  facet_grid(rows = vars(Species))

ggplot(data = iris, aes(x = Sepal.Length, y = Sepal.Width)) +
  geom_point() +
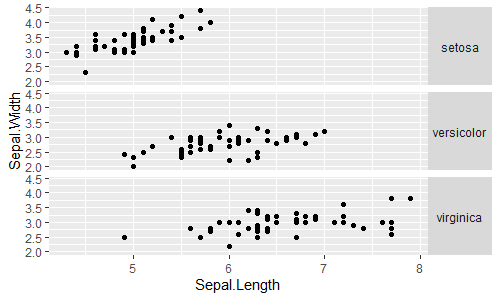
  facet_grid(rows = vars(Species)) +
  theme(strip.text.y = element_text(angle = 0))
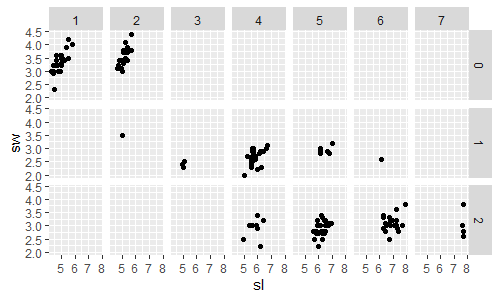
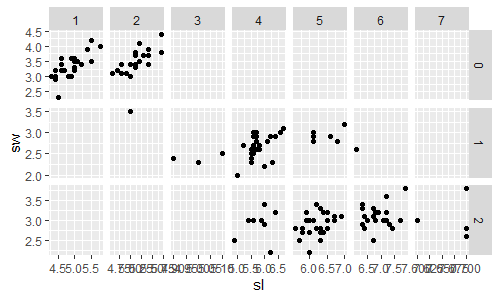
ggplot(data = iris_round, aes(x = sl, y = sw)) +
  geom_point() +
  facet_grid(cols = vars(round_pl), rows = vars(round_pw))
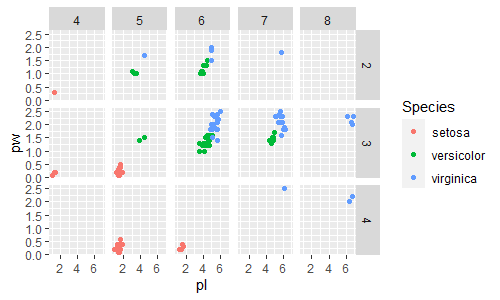
ggplot(data = iris_round, aes(x = pl, y = pw, color = Species)) +
  geom_point() +
  facet_grid(cols = vars(round_sl), rows = vars(round_sw))
facet_wrap()
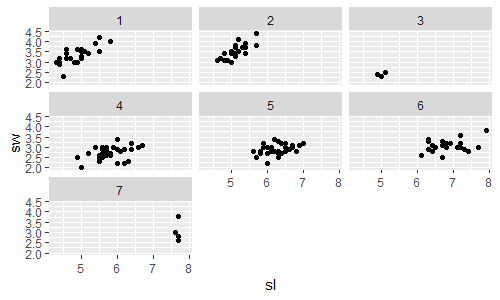
ggplot(data = iris_round, aes(x = sl, y = sw)) +
  geom_point() +
  facet_wrap(vars(round_pl))
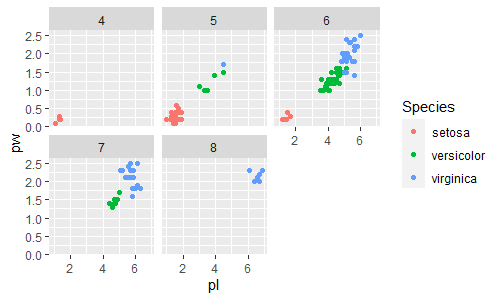
ggplot(data = iris_round, aes(x = pl, y = pw, color = Species)) +
  geom_point() +
  facet_wrap(vars(round_sl))
scales = "free"
ggplot(data = iris_round, aes(x = sl, y = sw)) +
  geom_point() +
  facet_grid(cols = vars(round_pl), rows = vars(round_pw),
             scales = "free")
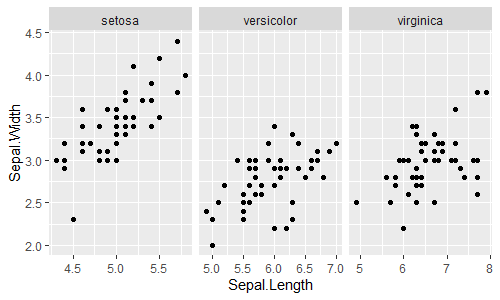
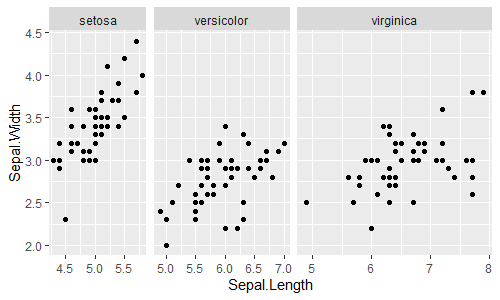
scales = "free", space = "free"
ggplot(data = iris, aes(x = Sepal.Length, y = Sepal.Width)) +
  geom_point() +
  facet_grid(cols = vars(Species))

ggplot(data = iris, aes(x = Sepal.Length, y = Sepal.Width)) +
  geom_point() +
  facet_grid(cols = vars(Species), scales = "free")

ggplot(data = iris, aes(x = Sepal.Length, y = Sepal.Width)) +
  geom_point() +
  facet_grid(cols = vars(Species), scales = "free", space = "free")
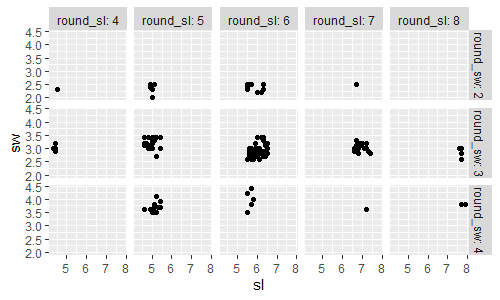
labeller = label_both
ggplot(data = iris_round, aes(x = sl, y = sw)) +
  geom_point() +
  facet_grid(cols = vars(round_sl), rows = vars(round_sw),
             labeller = label_both)
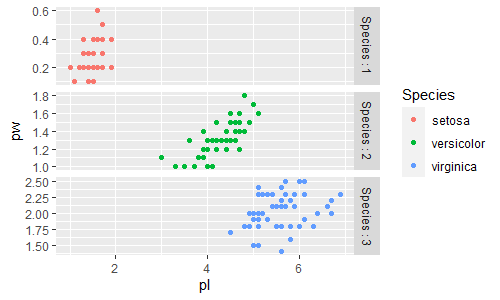
label_bquote()
ggplot(data = iris_round, aes(x = pl, y = pw, color = Species)) +
  geom_point() +
  facet_grid(rows = vars(Species),
             scales = "free",
             labeller = label_bquote(Species: .(Species)))
Labels
labs()
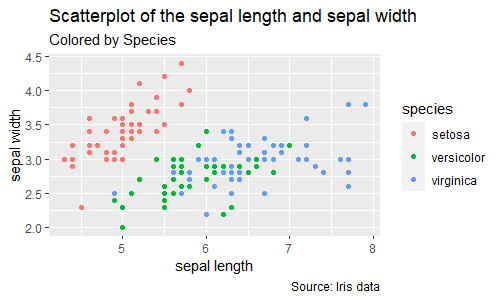
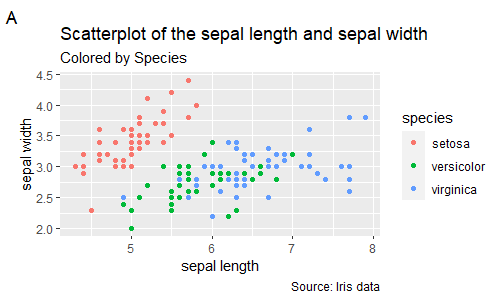
labs()でタイトル等のラベルを設定できます。
ggplot(data = iris, aes(x = Sepal.Length, y = Sepal.Width, color = Species)) +
  geom_point() +
  labs(title = "Scatterplot of the sepal length and sepal width",
       subtitle = "Colored by Species",
       caption = "Source: Iris data",
       x = "sepal length", y = "sepal width",
       color = "species")

ggplot(data = iris, aes(x = Sepal.Length, y = Sepal.Width, color = Species)) +
  geom_point() +
  labs(title = "Scatterplot of the sepal length and sepal width",
       subtitle = "Colored by Species",
       caption = "Source: Iris data",
       tag = "A",
       x = "sepal length", y = "sepal width",
       color = "species")
annotate()
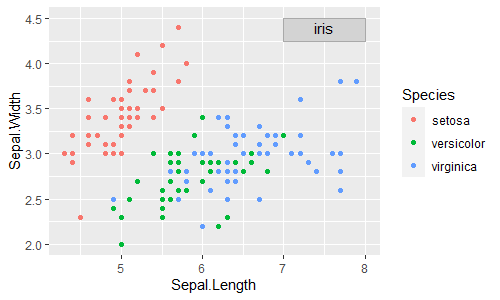
annotate()でグラフに図形や文字列を加えられます。
ggplot(data = iris, aes(x = Sepal.Length, y = Sepal.Width, color = Species)) +
  geom_point() +
  annotate(geom = "rect",
           xmin = 7.0, xmax = 8.0, ymin = 4.25, ymax = 4.5,
           color = "darkgray", fill = "lightgray") +
  annotate(geom = "text", x = 7.5, y = 4.4, label = "iris")
Legends
theme()
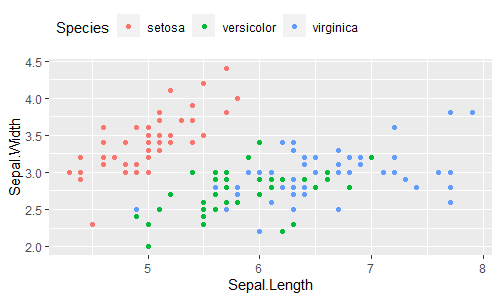
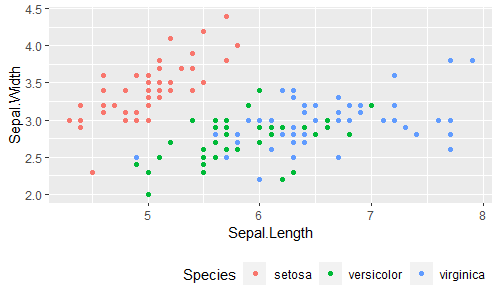
legend.position
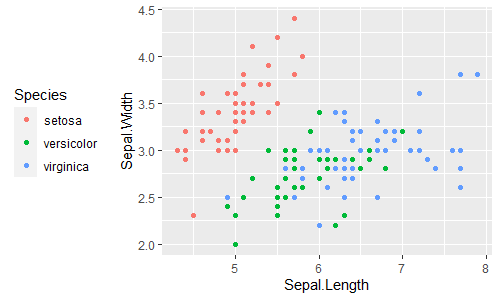
凡例の位置を指定します。
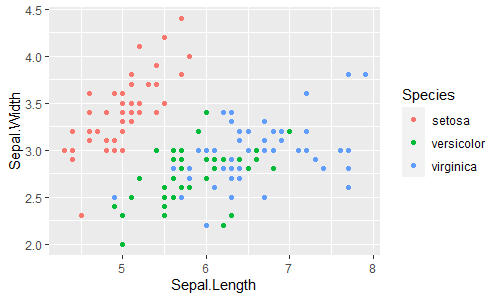
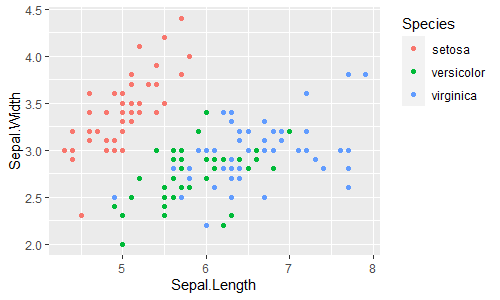
ggplot(data = iris, aes(x = Sepal.Length, y = Sepal.Width, color = Species)) +
  geom_point()
ggplot(data = iris, aes(x = Sepal.Length, y = Sepal.Width, color = Species)) +
  geom_point() +
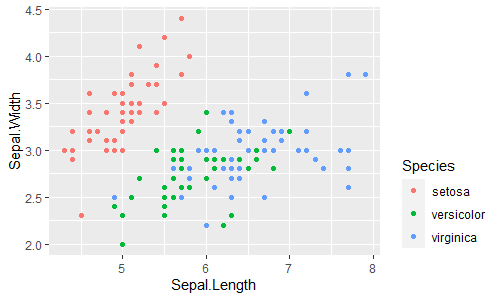
  theme(legend.position = "right")

ggplot(data = iris, aes(x = Sepal.Length, y = Sepal.Width, color = Species)) +
  geom_point() +
  theme(legend.position = "left")

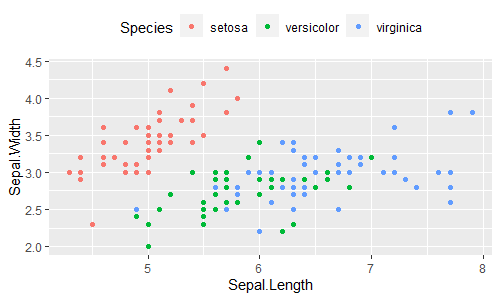
ggplot(data = iris, aes(x = Sepal.Length, y = Sepal.Width, color = Species)) +
  geom_point() +
  theme(legend.position = "top")

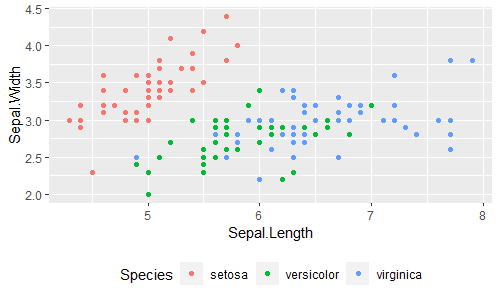
ggplot(data = iris, aes(x = Sepal.Length, y = Sepal.Width, color = Species)) +
  geom_point() +
  theme(legend.position = "bottom")

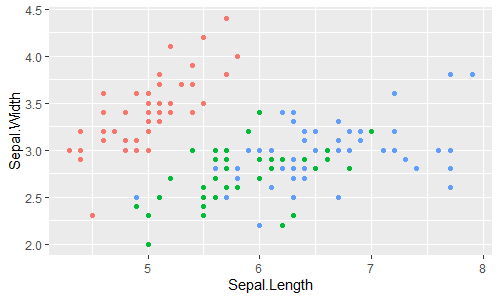
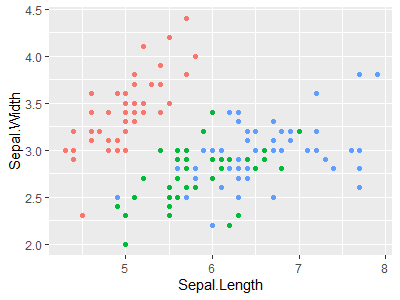
ggplot(data = iris, aes(x = Sepal.Length, y = Sepal.Width, color = Species)) +
  geom_point() +
  theme(legend.position = "none")
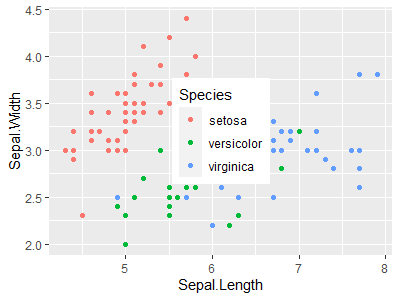
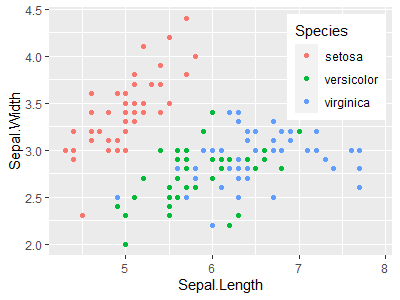
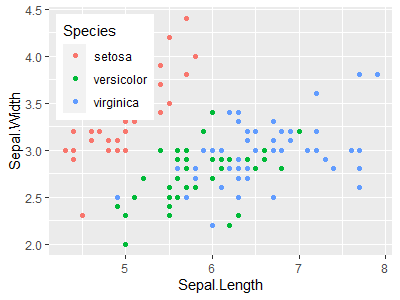
凡例を図の内側に表示することもできます。
ggplot(data = iris, aes(x = Sepal.Length, y = Sepal.Width, color = Species)) +
  geom_point() +
  theme(legend.position = c(0.5, 0.5))

ggplot(data = iris, aes(x = Sepal.Length, y = Sepal.Width, color = Species)) +
  geom_point() +
  theme(legend.position = c(0.98, 0.97), legend.justification = c("right", "top"))
ggplot(data = iris, aes(x = Sepal.Length, y = Sepal.Width, color = Species)) +
  geom_point() +
  theme(legend.position = c(0.98, 0.97), legend.justification = c(1, 1))

ggplot(data = iris, aes(x = Sepal.Length, y = Sepal.Width, color = Species)) +
  geom_point() +
  theme(legend.position = c(0.02, 0.97), legend.justification = c("left", "top"))
ggplot(data = iris, aes(x = Sepal.Length, y = Sepal.Width, color = Species)) +
  geom_point() +
  theme(legend.position = c(0.02, 0.97), legend.justification = c(0, 1))

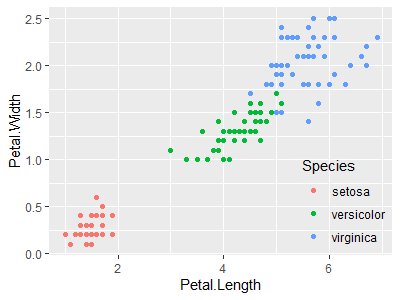
ggplot(data = iris, aes(x = Petal.Length, y = Petal.Width, color = Species)) +
  geom_point() +
  theme(legend.position = c(1, 0),
        legend.justification = c(1, 0),
        legend.background = element_blank(),
        legend.key = element_blank())

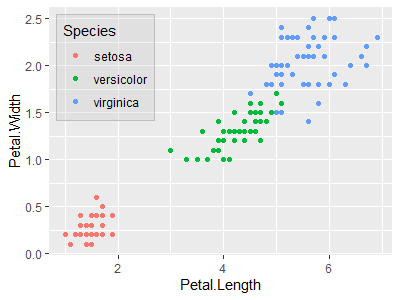
ggplot(data = iris, aes(x = Petal.Length, y = Petal.Width, color = Species)) +
  geom_point() +
  theme(legend.position = c(0.02, 0.97),
        legend.justification = c(0, 1),
        legend.background = element_rect(color = "gray", fill = alpha("gray", alpha = 1/4)),
        legend.key = element_blank())
legend.justification
凡例の揃え位置を指定します。
ggplot(data = iris, aes(x = Sepal.Length, y = Sepal.Width, color = Species)) +
  geom_point() +
  theme(legend.position = "right", legend.justification = "center")  # デフォルト

ggplot(data = iris, aes(x = Sepal.Length, y = Sepal.Width, color = Species)) +
  geom_point() +
  theme(legend.position = "right", legend.justification = "top")

ggplot(data = iris, aes(x = Sepal.Length, y = Sepal.Width, color = Species)) +
  geom_point() +
  theme(legend.position = "right", legend.justification = "bottom")

ggplot(data = iris, aes(x = Sepal.Length, y = Sepal.Width, color = Species)) +
  geom_point() +
  theme(legend.position = "top", legend.justification = "left")

ggplot(data = iris, aes(x = Sepal.Length, y = Sepal.Width, color = Species)) +
  geom_point() +
  theme(legend.position = "bottom", legend.justification = "right")
複数凡例
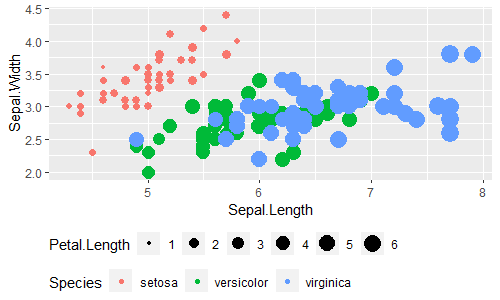
ggplot(data = iris, aes(x = Sepal.Length, y = Sepal.Width)) +
  geom_point(aes(color = Species, size = Petal.Length)) +
  guides(size = guide_legend(nrow = 1)) +
  theme(legend.position = "bottom",      # 凡例の位置
        legend.direction = "horizontal", # 凡例値の配置方向
        legend.justification = "left",   # 凡例の揃え位置
        legend.box = "vertical",         # 複数凡例の配置方向
        legend.box.just = "left",        # 複数凡例の揃え位置
        legend.margin = margin(0, 0, 0, 0),      # 複数凡例のージン
        legend.box.margin = margin(0, 0, 0, 0))  # 凡例全体のマージン
# margin(t = 0, r = 0, b = 0, l = 0, unit = "pt")

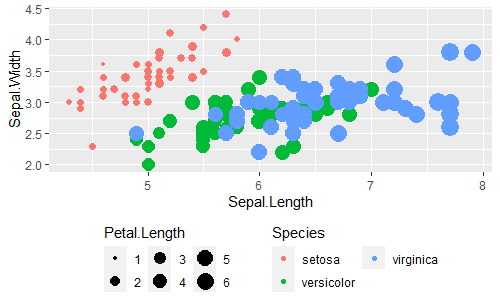
ggplot(data = iris, aes(x = Sepal.Length, y = Sepal.Width)) +
  geom_point(aes(color = Species, size = Petal.Length)) +
  guides(size = guide_legend(nrow = 2)) +
  guides(color = guide_legend(nrow = 2)) +
  theme(legend.position = "bottom",      # 凡例の位置
        legend.direction = "vertical",   # 凡例値の配置方向
        legend.justification = "center", # 凡例の揃え位置
        legend.box = "horizontal",       # 複数凡例の配置方向
        legend.box.just = "top",         # 複数凡例の揃え位置
        legend.margin = margin(0, 10, 0, 10),    # 複数凡例のージン
        legend.box.margin = margin(0, 0, 0, 0))  # 凡例全体のマージン

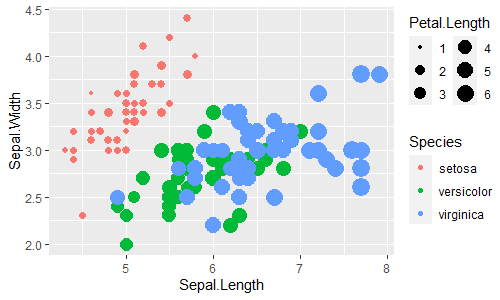
ggplot(data = iris, aes(x = Sepal.Length, y = Sepal.Width)) +
  geom_point(aes(color = Species, size = Petal.Length)) +
  guides(size = guide_legend(nrow = 3)) +
  guides(color = guide_legend(nrow = 3)) +
  theme(legend.position = "right",     # 凡例の位置
        legend.direction = "vertical", # 凡例値の配置方向
        legend.justification = "top",  # 凡例の揃え位置
        legend.box = "vertical",       # 複数凡例の配置方向
        legend.box.just = "left",      # 複数凡例の揃え位置
        legend.margin = margin(5, 0, 5, 0),      # 複数凡例のージン
        legend.box.margin = margin(0, 0, 0, 0))  # 凡例全体のマージン
guides()
各軸の凡例について、guides(軸名 = ***)の形で設定します。
guide_none(), "none"
guides(color = "none")またはguides(color = FALSE)とするとcolorの凡例を非表示にできます。x, yについては、guides(x = "none")をguides(x = FALSE)とはできません。
ggplot(data = iris, aes(x = Sepal.Length, y = Sepal.Width, color = Species)) +
  geom_point() +
  guides(color = guide_none())
ggplot(data = iris, aes(x = Sepal.Length, y = Sepal.Width, color = Species)) +
  geom_point() +
  guides(color = "none")
ggplot(data = iris, aes(x = Sepal.Length, y = Sepal.Width, color = Species)) +
  geom_point() +
  guides(color = FALSE)

ggplot(data = iris, aes(x = Sepal.Length, y = Sepal.Width, color = Species)) +
  geom_point() +
  guides(x = guide_none()) +
  guides(y = guide_none())
ggplot(data = iris, aes(x = Sepal.Length, y = Sepal.Width, color = Species)) +
  geom_point() +
  guides(x = "none") +
  guides(y = "none")
ggplot(data = iris, aes(x = Sepal.Length, y = Sepal.Width, color = Species)) +
  geom_point() +
  guides(x = guide_none(), y = guide_none())
ggplot(data = iris, aes(x = Sepal.Length, y = Sepal.Width, color = Species)) +
  geom_point() +
  guides(x = "none", y = "none")

ggplot(data = iris, aes(x = Sepal.Length, y = Sepal.Width, color = Species)) +
  geom_point() +
  guides(x = FALSE, y = FALSE)
# エラー: Unknown guide: FALSE
# Run `rlang::last_error()` to see where the error occurred.
guide_axis(), "axis"
ggplot(data = iris, aes(x = Sepal.Length, y = Sepal.Width, color = Species)) +
  geom_point() +
  guides(x = "axis", y = "axis", color = "legend")
ggplot(data = iris, aes(x = Sepal.Length, y = Sepal.Width, color = Species)) +
  geom_point() +
  guides(x = guide_axis(), y = guide_axis(), color = "legend")
- https://qiita.com/swathci/items/00b4a847843a33345887#guide_axis軸の凡例を設定する関数
- https://qiita.com/swathci/items/00b4a847843a33345887#guide_axis軸の凡例を設定する関数-1
guide_legend(), "legend"
ggplot(data = iris, aes(x = Sepal.Length, y = Sepal.Width, color = Petal.Length)) +
  geom_point() +
  guides(x = "axis", y = "axis", color = "legend")
ggplot(data = iris, aes(x = Sepal.Length, y = Sepal.Width, color = Petal.Length)) +
  geom_point() +
  guides(x = "axis", y = "axis", color = guide_legend())

ggplot(data = iris, aes(x = Sepal.Length, y = Sepal.Width, color = Petal.Length)) +
  geom_point() +
  guides(x = "axis", y = "axis", color = guide_legend(reverse = TRUE))
guide_colorbar(), "colorbar"
ggplot(data = iris, aes(x = Sepal.Length, y = Sepal.Width, color = Petal.Length)) +
  geom_point() +
  guides(x = "axis", y = "axis", color = "colorbar")
ggplot(data = iris, aes(x = Sepal.Length, y = Sepal.Width, color = Petal.Length)) +
  geom_point() +
  guides(x = "axis", y = "axis", color = guide_colorbar())

ggplot(data = iris, aes(x = Sepal.Length, y = Sepal.Width, color = Petal.Length)) +
  geom_point() +
  guides(x = "axis", y = "axis", color = guide_colorbar(reverse = TRUE))
guide_bins(), "bins"
ggplot(data = iris, aes(x = Sepal.Length, y = Sepal.Width, color = Petal.Length)) +
  geom_point() +
  guides(x = "axis", y = "axis", color = "bins")
ggplot(data = iris, aes(x = Sepal.Length, y = Sepal.Width, color = Petal.Length)) +
  geom_point() +
  guides(x = "axis", y = "axis", color = guide_bins())

ggplot(data = iris, aes(x = Sepal.Length, y = Sepal.Width, color = Petal.Length)) +
  geom_point() +
  guides(x = "axis", y = "axis", color = guide_bins(reverse = TRUE))
guide_coloursteps(), "colorsteps"
ggplot(data = iris, aes(x = Sepal.Length, y = Sepal.Width, color = Petal.Length)) +
  geom_point() +
  guides(x = "axis", y = "axis", color = "colorsteps")
ggplot(data = iris, aes(x = Sepal.Length, y = Sepal.Width, color = Petal.Length)) +
  geom_point() +
  guides(x = "axis", y = "axis", color = guide_colorsteps())

ggplot(data = iris, aes(x = Sepal.Length, y = Sepal.Width, color = Petal.Length)) +
  geom_point() +
  guides(x = "axis", y = "axis", color = guide_colorsteps(reverse = TRUE))
scale_*_*()
scale_color_*(), scale_fill_*()でcolor, fillの凡例の設定がきます。
ggplot(data = iris, aes(x = Sepal.Length, y = Sepal.Width, color = Species)) +
  geom_point() +
  scale_color_discrete(name = "species",
                       labels = str_to_title(unique(iris$Species)))
詳しくはこちら参照。
Zooming
ggplot(data = iris, aes(x = Sepal.Length, y = Sepal.Width, color = Species)) +
  geom_point() +
  coord_cartesian(xlim = c(4, 6), ylim = c(2, 4))
ggplot(data = iris, aes(x = Sepal.Length, y = Sepal.Width, color = Species)) +
  geom_point() +
  xlim(4, 6) + ylim(2, 4)
ggplot(data = iris, aes(x = Sepal.Length, y = Sepal.Width, color = Species)) +
  geom_point() +
  scale_x_continuous(limits = c(4, 6)) + scale_y_continuous(limits = c(2, 4))
Stats
stat_*()関数を使います。stat_*()関数については、こちらにまとめました。
参考文献
- https://ggplot2.tidyverse.org/
- https://github.com/tidyverse/ggplot2
- https://cran.r-project.org/web/packages/ggplot2/index.html
- https://rstudio.cloud/learn/cheat-sheets
- https://ggplot2-book.org/index.html
- https://r-graphics.org/
- https://r4ds.had.co.nz/data-visualisation.html
- https://heavywatal.github.io/rstats/ggplot2.html
- https://yukiyanai.github.io/jp/classes/stat2/contents/R/intro-to-ggplot2.html
- https://www.jaysong.net/RBook/
- https://kazutan.github.io/fukuokaR11/intro_ggplot2.html
- https://triadsou.hatenablog.com/entry/20100528/1275042816
- https://qiita.com/swathci/items/b08496d863bca4b479b3
- https://qiita.com/swathci/items/00b4a847843a33345887
