はじめに
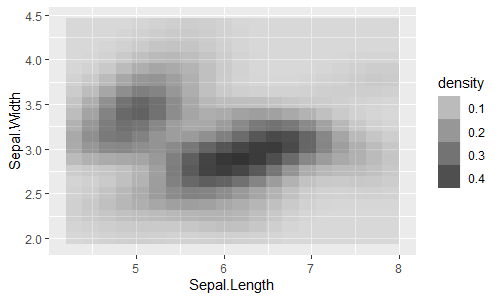
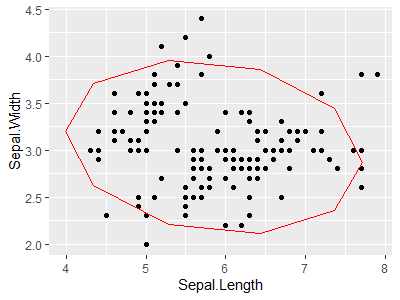
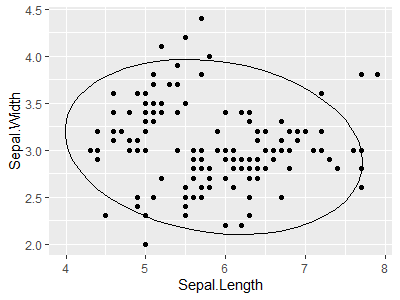
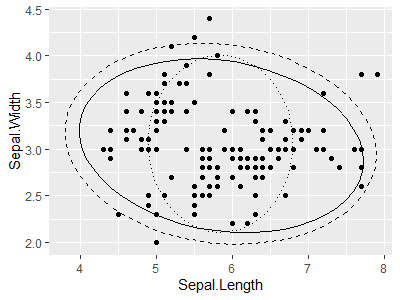
ggplot2では、データから、stat_*()関数で集計した結果を、geom_*()関数でグラフの形状にして描画します。
例えば、離散値のデータから値ごとにカウント集計した結果を棒グラフに描画する場合には、
-
stat_count(geom = "bar"):カウント集計する関数stat_count()の引数に棒グラフで表示するgeom = "bar"を指定 -
geom_bar(stat = "count"):棒グラフで表示する関数geom_bar()の引数にカウント集計するstat = "count"を指定
の2通りの指定方法があります(どちらでも同じ結果になります。)1。
具体的な例として、irisデータからSpeciesごとにカウント集計した結果を棒グラフに描く場合は、次のように書けます(50件ずつなのであまり面白くない例ですが)。
library(tidyverse)

ggplot(data = iris, aes(x = Species)) +
  stat_count(geom = "bar")

ggplot(data = iris, aes(x = Species)) +
  geom_bar(stat = "count")
このように多くの場合、stat_count()とgeom_bar()が対応しています。
なお、stat_count()の引数geomはデフォルトでgeom = "bar"となっており、また、geom_bar()の引数statはデフォルトでstat = "count"となっていますので、この場合は引数を省略して書くこともできます。
ggplot(data = iris, aes(x = Species)) +
  stat_count()

ggplot(data = iris, aes(x = Species)) +
  geom_bar()
以下では、データの型ごとに使用できるstat_*()関数をまとます。
目次
- Stats
- まとめ
- 参考文献
Stats
1変数(x:離散)
stat_count()
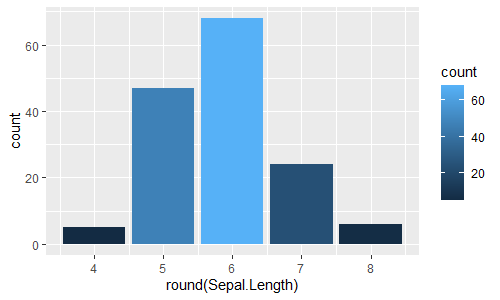
stat_count()は離散値のデータを値ごとにカウント集計します。デフォルトでgeom = "bar"(棒グラフ)で、これはgeom_bar(stat = "count")と同じです。
ggplot(data = iris, aes(x = round(Sepal.Length))) +
  stat_count()
ggplot(data = iris, aes(x = round(Sepal.Length))) +
  stat_count(geom = "bar")
ggplot(data = iris, aes(x = round(Sepal.Length))) +
  geom_bar()
ggplot(data = iris, aes(x = round(Sepal.Length))) +
  geom_bar(stat = "count")
geom
stat_count()はデフォルトではgeom = "bar"ですが、geom = "line"とすると折れ線グラフが描けます(ただし下の(注)参照。)。これは、geom_line(stat = "count")と同じです。
また、geom = "path"とも基本的に同じです2。
ggplot(data = iris, aes(x = round(Sepal.Length))) +
  stat_count(geom = "line")
ggplot(data = iris, aes(x = round(Sepal.Length))) +
  geom_line(stat = "count")

ggplot(data = iris, aes(x = round(Sepal.Length))) +
  stat_count(geom = "path")
ggplot(data = iris, aes(x = round(Sepal.Length))) +
  geom_path(stat = "count")
(注)折れ線グラフは、x軸の変数が数値型である必要があります。例えば、x軸を次のように因子型にして折れ線グラフを描こうとするとエラーになります。
# エラー
ggplot(data = iris, aes(x = factor(round(Sepal.Length)))) +
  stat_count(geom = "line")
# geom_path: Each group consists of only one observation. Do you need to adjust the group aesthetic?

# エラー
ggplot(data = iris, aes(x = Species)) +
  stat_count(geom = "line")
# geom_path: Each group consists of only one observation. Do you need to adjust the group aesthetic?

# エラーにならない
ggplot(data = iris, aes(x = as.integer(Species))) +
  stat_count(geom = "line")
また、geom = "area"とすると、面グラフが描けます(ただし下の(注)参照。)。これは、geom_area(stat = "count")と同じです。
ggplot(data = iris, aes(x = round(Sepal.Length))) +
  stat_count(geom = "area")
ggplot(data = iris, aes(x = round(Sepal.Length))) +
  geom_area(stat = "count")
(注)面グラフも(折れ線グラフの下の面積を塗りつぶしただけなので、折れ線グラフと同様に)x軸の変数は数値型である必要があります。
geomには他にもいろいろ指定できます。
ggplot(data = iris, aes(x = round(Sepal.Length))) +
  stat_count(geom = "point")
ggplot(data = iris, aes(x = round(Sepal.Length))) +
  geom_point(stat = "count")

ggplot(data = iris, aes(x = round(Sepal.Length))) +
  stat_count(geom = "text", label = "count", size = 3)
ggplot(data = iris, aes(x = round(Sepal.Length))) +
  geom_text(stat = "count", label = "count", size = 3)
また、これらを+でつなぐことで重ねて描くこともできます。折れ線(geom = "line")と点(geom = "point")を重ねるとマーカー付き折れ線グラフになります。
ggplot(data = iris, aes(x = round(Sepal.Length))) +
  stat_count(geom = "line") +
  stat_count(geom = "point")
ggplot(data = iris, aes(x = round(Sepal.Length))) +
  geom_line(stat = "count") +
  geom_point(stat = "count")

ggplot(data = iris, aes(x = round(Sepal.Length))) +
  stat_count(geom = "bar") +
  stat_count(geom = "line") +
  stat_count(geom = "point")
ggplot(data = iris, aes(x = round(Sepal.Length))) +
  geom_bar(stat = "count") +
  geom_line(stat = "count") +
  geom_point(stat = "count")
..count..等
stat_count()を使った場合、y軸はデフォルトでは..count..になっています。つまり、aes(y = ..count..)となっています。これを..prop..にすると(つまり、aes(y = ..prop..)とすると)y軸が割合になります。
なお、..count..は、stat(count), after_stat(count)(最近の書き方)と書いても同じです3。
-
..count..:x軸の値ごとのカウント数 -
..prop..:全体を1にした割合(=..count.. / sum(..count..))
ggplot(data = iris, aes(x = round(Sepal.Length))) +
  stat_count(aes(y = ..count..), geom = "bar")
ggplot(data = iris, aes(x = round(Sepal.Length))) +
  stat_count(aes(y = stat(count)), geom = "bar")
ggplot(data = iris, aes(x = round(Sepal.Length))) +
  stat_count(aes(y = after_stat(count)), geom = "bar")

ggplot(data = iris, aes(x = round(Sepal.Length))) +
  stat_count(aes(y = ..prop..), geom = "bar")
ggplot(data = iris, aes(x = round(Sepal.Length))) +
  stat_count(aes(y = stat(prop)), geom = "bar")
ggplot(data = iris, aes(x = round(Sepal.Length))) +
  stat_count(aes(y = after_stat(prop)), geom = "bar")
# これは次と同じ
ggplot(data = iris, aes(x = round(Sepal.Length))) +
  stat_count(aes(y = ..count.. / sum(..count..)), geom = "bar")
ggplot(data = iris, aes(x = round(Sepal.Length))) +
  stat_count(aes(y = after_stat(count / sum(count))), geom = "bar")
これを利用して次のようなグラフも描けます。
ggplot(data = iris, aes(x = round(Sepal.Length))) +
  stat_count(geom = "bar", fill = "gray") +
  stat_count(geom = "text", aes(label = ..count..))

ggplot(data = iris, aes(x = round(Sepal.Length))) +
  stat_count(geom = "bar") +
  stat_count(geom = "text", aes(label = ..count.., y = ..count.. + 3))
ggplot(data = iris, aes(x = round(Sepal.Length))) +
  stat_count(geom = "bar") +
  stat_count(geom = "text", aes(label = ..count..), position = position_nudge(y = 3))

ggplot(data = iris, aes(x = round(Sepal.Length))) +
  stat_count(geom = "bar", aes(fill = ..count..))

ggplot(data = iris, aes(x = round(Sepal.Length))) +
  stat_count(geom = "bar", aes(fill = ..x..))
..count..等の値はstat_*()によって描画前に内部的に計算されていて描画させないと見えませんが、ggplot_build()を使うとこれらの値を確認することができます。
内部的に計算されている値を確認しておきます。
p <- ggplot(data = iris, aes(x = round(Sepal.Length))) +
  stat_count()
ggplot_build(p)

layer_data(p)
#    y count       prop x flipped_aes PANEL group ymin ymax xmin xmax colour   fill size linetype alpha
# 1  5     5 0.03333333 4       FALSE     1    -1    0    5 3.55 4.45     NA grey35  0.5        1    NA
# 2 47    47 0.31333333 5       FALSE     1    -1    0   47 4.55 5.45     NA grey35  0.5        1    NA
# 3 68    68 0.45333333 6       FALSE     1    -1    0   68 5.55 6.45     NA grey35  0.5        1    NA
# 4 24    24 0.16000000 7       FALSE     1    -1    0   24 6.55 7.45     NA grey35  0.5        1    NA
# 5  6     6 0.04000000 8       FALSE     1    -1    0    6 7.55 8.45     NA grey35  0.5        1    NA

layer_scales(p)
# $x
# <ScaleContinuousPosition>
#  Range:  3.55 -- 8.45
#  Limits: 3.55 -- 8.45
#
# $y
# <ScaleContinuousPosition>
#  Range:     0 --   68
#  Limits:    0 --   68
#

layer_grob(p)
# $`1`
# rect[geom_rect.rect.****]
#

names(layer_data(p))
# [1] "y"           "count"       "prop"        "x"           "flipped_aes" "PANEL"       "group"       "ymin"
# [9] "ymax"        "xmin"        "xmax"        "colour"      "fill"        "size"        "linetype"    "alpha"
グラフの色分け
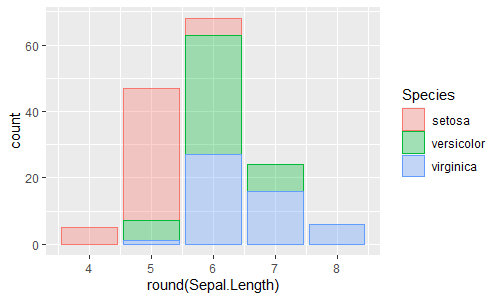
color軸, fill軸を加えて色分けした棒グラフを描くこともできます。ただしデフォルトでは積み上げ棒グラフになっています。
棒グラフの並べ方はpositionで指定できます。
-
position = "stack":積み上げ棒グラフ(エクセルの「積み上げ縦棒」) -
position = "fill":全体を100%にした積み上げ棒グラフ(エクセルの「100%積み上げ縦棒」) -
position = "identity":棒グラフの重ね合わせ -
position = "dodge", "dodge2":横並びの棒グラフ(エクセルの「集合縦棒」)
また、横並びのさせ方は2種類あります。
-
position_dodge(preserve = "single"):xごとに左詰めで配置 -
position_dodge2(preserve = "single"):xごとに全体を真ん中に配置
ggplot(data = iris, aes(x = round(Sepal.Length), color = Species, fill = Species)) +
  stat_count(geom = "bar", position = "stack", alpha = 1/3)
ggplot(data = iris, aes(x = round(Sepal.Length), color = Species, fill = Species)) +
  stat_count(geom = "bar", position = position_stack(), alpha = 1/3)

ggplot(data = iris, aes(x = round(Sepal.Length), color = Species, fill = Species)) +
  stat_count(geom = "bar", position = "fill", alpha = 1/3)
ggplot(data = iris, aes(x = round(Sepal.Length), color = Species, fill = Species)) +
  stat_count(geom = "bar", position = position_fill(), alpha = 1/3)

ggplot(data = iris, aes(x = round(Sepal.Length), color = Species, fill = Species)) +
  stat_count(geom = "bar", position = "identity", alpha = 1/3)
ggplot(data = iris, aes(x = round(Sepal.Length), color = Species, fill = Species)) +
  stat_count(geom = "bar", position = position_identity(), alpha = 1/3)

ggplot(data = iris, aes(x = round(Sepal.Length), color = Species, fill = Species)) +
  stat_count(geom = "bar", position = "dodge", alpha = 1/3)
ggplot(data = iris, aes(x = round(Sepal.Length), color = Species, fill = Species)) +
  stat_count(geom = "bar", position = position_dodge(), alpha = 1/3)
ggplot(data = iris, aes(x = round(Sepal.Length), color = Species, fill = Species)) +
  stat_count(geom = "bar", position = position_dodge(preserve = "total"), alpha = 1/3)

ggplot(data = iris, aes(x = round(Sepal.Length), color = Species, fill = Species)) +
  stat_count(geom = "bar", position = position_dodge(preserve = "single"), alpha = 1/3)

ggplot(data = iris, aes(x = round(Sepal.Length), color = Species, fill = Species)) +
  stat_count(geom = "bar", position = position_dodge2(preserve = "single"), alpha = 1/3)
折れ線グラフでも色分けができます。ただし、これもデフォルトは積み上げ折れ線グラフです。通常の(重なった)折れ線グラフを描くにはposition = "identity"とします。
ggplot(data = iris, aes(x = round(Sepal.Length), color = Species)) +
  stat_count(geom = "line") +
  stat_count(geom = "point")
ggplot(data = iris, aes(x = round(Sepal.Length), color = Species)) +
  stat_count(geom = "line", position = "stack") +
  stat_count(geom = "point", position = "stack")
ggplot(data = iris, aes(x = round(Sepal.Length), color = Species)) +
  geom_line(stat = "count", position = "stack") +
  geom_point(stat = "count", position = "stack")

ggplot(data = iris, aes(x = round(Sepal.Length), color = Species)) +
  stat_count(geom = "line", position = "fill") +
  stat_count(geom = "point", position = "fill")
ggplot(data = iris, aes(x = round(Sepal.Length), color = Species)) +
  geom_line(stat = "count", position = "fill") +
  geom_point(stat = "count", position = "fill")

ggplot(data = iris, aes(x = round(Sepal.Length), color = Species)) +
  stat_count(geom = "line", position = "identity") +
  stat_count(geom = "point", position = "identity")
ggplot(data = iris, aes(x = round(Sepal.Length), color = Species)) +
  geom_line(stat = "count", position = "identity") +
  geom_point(stat = "count", position = "identity")
ggplot(data = iris, aes(x = round(Sepal.Length), color = Species)) +
  geom_line(stat = "count") +
  geom_point(stat = "count")

ggplot(data = iris, aes(x = round(Sepal.Length), color = Species)) +
  stat_count(geom = "line", position = position_dodge(width = 0.0)) +
  stat_count(geom = "point", position = position_dodge(width = 0.3))
ggplot(data = iris, aes(x = round(Sepal.Length), color = Species)) +
  geom_line(stat = "count", position = position_dodge(width = 0.0)) +
  geom_point(stat = "count", position = position_dodge(width = 0.3))
1変数(x:連続)
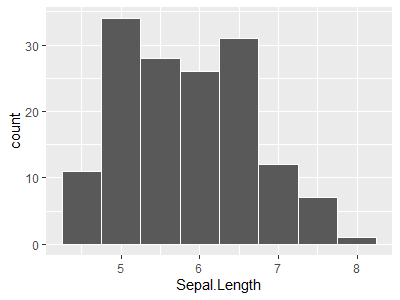
stat_bin()
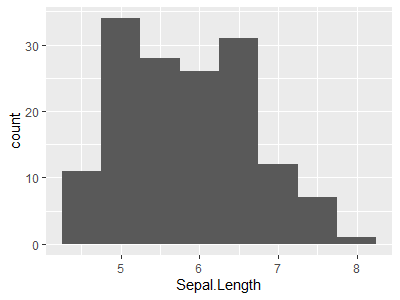
stat_bin()は連続値のデータを区間(ビン)に分割してカウント集計します。デフォルトでstat_bin(geom = "bar")(棒グラフ)で、これはgeom_histogram(stat = "bin")(ヒストグラム)と同じです。
また、これはグラフの形状としては棒グラフなので、geom_bar(stat = "bin")としても同じです。
ggplot(data = iris, aes(x = Sepal.Length)) +
  stat_bin(binwidth = 0.5)
ggplot(data = iris, aes(x = Sepal.Length)) +
  stat_bin(binwidth = 0.5, geom = "bar")
ggplot(data = iris, aes(x = Sepal.Length)) +
  geom_histogram(binwidth = 0.5)
ggplot(data = iris, aes(x = Sepal.Length)) +
  geom_histogram(stat = "bin", binwidth = 0.5)
ggplot(data = iris, aes(x = Sepal.Length)) +
  geom_bar(stat = "bin", binwidth = 0.5)
なお、これは、次のようにx軸をcut_width()で分割してカテゴリー変数として棒グラフを描いているのと同じことです(x軸が連続値ではなく離散値になりますが。)。
ggplot(data = iris, aes(x = cut_width(x = Sepal.Length, width = 0.5))) +
  stat_count(geom = "bar")
ggplot(data = iris, aes(x = cut_width(x = Sepal.Length, width = 0.5))) +
  geom_bar(stat = "count")
ggplot(data = iris, aes(x = cut_width(x = Sepal.Length, width = 0.5))) +
  geom_bar(stat = "count", width = 1) # widthはビンの幅ではなく棒グラフの棒の幅
ggplot(data = iris, aes(x = cut_width(x = Sepal.Length, width = 0.5))) +
  geom_bar(stat = "count", width = 1) +
  theme(axis.text.x = element_text(angle = 20)) # 文字の重なりを避けるため20度回転

levels(cut_width(x = iris$Sepal.Length, width = 0.5))
# [1] "[4.25,4.75]" "(4.75,5.25]" "(5.25,5.75]" "(5.75,6.25]"
# [5] "(6.25,6.75]" "(6.75,7.25]" "(7.25,7.75]" "(7.75,8.25]"
geom
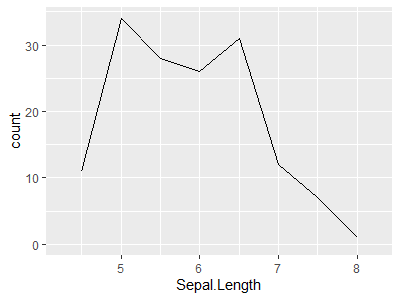
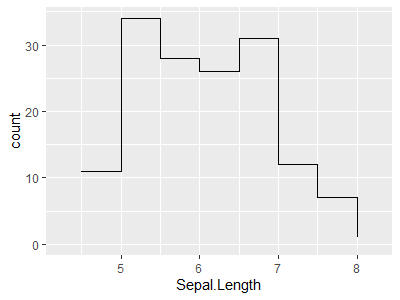
stat_bin()はデフォルトではgeom = "bar"ですが、geom = "line"とするとgeom_line(stat = "bin")と同じになります。
またこれは度数分布曲線を描くgeom_freqpoly()ともほぼ同じです(こちらは度数が0のところまであります)。
ggplot(data = iris, aes(x = Sepal.Length)) +
  stat_bin(binwidth = 0.5, geom = "line")
ggplot(data = iris, aes(x = Sepal.Length)) +
  geom_line(stat = "bin", binwidth = 0.5)

ggplot(data = iris, aes(x = Sepal.Length)) +
  geom_freqpoly(binwidth = 0.5)
ggplot(data = iris, aes(x = Sepal.Length)) +
  geom_freqpoly(stat = "bin", binwidth = 0.5)
geom = "area"とすると、geom_area(stat = "bin")と同じになります。
ggplot(data = iris, aes(x = Sepal.Length)) +
  stat_bin(binwidth = 0.5, geom = "area")
ggplot(data = iris, aes(x = Sepal.Length)) +
  geom_area(stat = "bin", binwidth = 0.5)
geomには他にもいろいろ指定できます。
ggplot(data = iris, aes(x = Sepal.Length)) +
  stat_bin(binwidth = 0.5, geom = "step")
ggplot(data = iris, aes(x = Sepal.Length)) +
  geom_step(stat = "bin", binwidth = 0.5)

ggplot(data = iris, aes(x = Sepal.Length)) +
  stat_bin(binwidth = 0.5, geom = "point")
ggplot(data = iris, aes(x = Sepal.Length)) +
  geom_point(stat = "bin", binwidth = 0.5)

ggplot(data = iris, aes(x = Sepal.Length)) +
  stat_bin(binwidth = 0.5, geom = "text", label = "+")
ggplot(data = iris, aes(x = Sepal.Length)) +
  geom_text(stat = "bin", binwidth = 0.5, label = "+")
..count..等
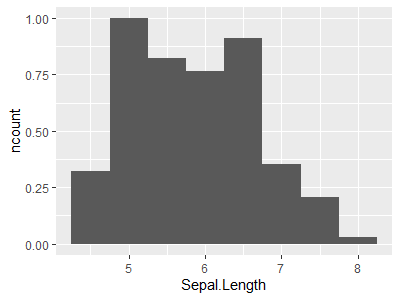
stat_bin()のy軸はデフォルトでは..count..になっています。つまり、aes(y = ..count..)となっています。..count..以外にも次のものが計算されています。
-
..count..:ビンごとのカウント数 -
..density..:確率密度(=..count.. / ビン幅 / sum(..count..)) -
..ncount..:..count..の正規化(=..count.. / max(..count..)) -
..ndensity..:..density..の正規化(=..density.. / max(..density..))
ggplot(data = iris, aes(x = Sepal.Length)) +
  stat_bin(binwidth = 0.5)
ggplot(data = iris, aes(x = Sepal.Length)) +
  stat_bin(binwidth = 0.5, aes(y = ..count..))
ggplot(data = iris, aes(x = Sepal.Length)) +
  stat_bin(binwidth = 0.5, aes(y = stat(count)))
ggplot(data = iris, aes(x = Sepal.Length)) +
  stat_bin(binwidth = 0.5, aes(y = after_stat(count)))

ggplot(data = iris, aes(x = Sepal.Length)) +
  stat_bin(binwidth = 0.5, aes(y = ..density..))
ggplot(data = iris, aes(x = Sepal.Length)) +
  stat_bin(binwidth = 0.5, aes(y = stat(density)))
ggplot(data = iris, aes(x = Sepal.Length)) +
  stat_bin(binwidth = 0.5, aes(y = after_stat(density)))
# これは次と同じ
ggplot(data = iris, aes(x = Sepal.Length)) +
  stat_bin(binwidth = 0.5, aes(y = ..count.. / 0.5 / sum(..count..)))
ggplot(data = iris, aes(x = Sepal.Length)) +
  stat_bin(binwidth = 0.5, aes(y = after_stat(count / 0.5 / sum(count))))

ggplot(data = iris, aes(x = Sepal.Length)) +
  stat_bin(binwidth = 0.5, aes(y = ..ncount..))
ggplot(data = iris, aes(x = Sepal.Length)) +
  stat_bin(binwidth = 0.5, aes(y = stat(ncount)))
ggplot(data = iris, aes(x = Sepal.Length)) +
  stat_bin(binwidth = 0.5, aes(y = after_stat(ncount)))
# これは次と同じ
ggplot(data = iris, aes(x = Sepal.Length)) +
  stat_bin(binwidth = 0.5, aes(y = ..count.. / max(..count..)))
ggplot(data = iris, aes(x = Sepal.Length)) +
  stat_bin(binwidth = 0.5, aes(y = after_stat(count / max(count))))

ggplot(data = iris, aes(x = Sepal.Length)) +
  stat_bin(binwidth = 0.5, aes(y = ..ndensity..))
ggplot(data = iris, aes(x = Sepal.Length)) +
  stat_bin(binwidth = 0.5, aes(y = stat(ndensity)))
ggplot(data = iris, aes(x = Sepal.Length)) +
  stat_bin(binwidth = 0.5, aes(y = after_stat(ndensity)))
# これは次と同じ
ggplot(data = iris, aes(x = Sepal.Length)) +
  stat_bin(binwidth = 0.5, aes(y = after_stat(density / max(density))))
ggplot(data = iris, aes(x = Sepal.Length)) +
  stat_bin(binwidth = 0.5, aes(y = ..density.. / max(..density..)))
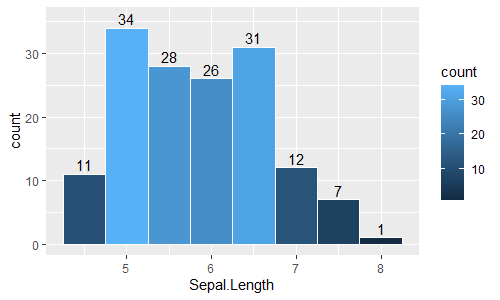
これを利用して次のようなグラフも描けます。
ggplot(data = iris, aes(x = Sepal.Length)) +
  stat_bin(binwidth = 0.5, geom = "bar", aes(y = ..count..), color = "white") +
  stat_bin(binwidth = 0.5, geom = "text", aes(label = ..count.., y = ..count.. + 1.5))

ggplot(data = iris, aes(x = Sepal.Length)) +
  stat_bin(binwidth = 0.5, geom = "bar", aes(y = ..count.., fill = ..count..), color = "white") +
  stat_bin(binwidth = 0.5, geom = "text", aes(label = ..count.., y = ..count.. + 1.5))
内部的に計算されている値を確認しておきます。
p <- ggplot(data = iris, aes(x = Sepal.Length)) +
  stat_bin(binwidth = 0.5)
ggplot_build(p)

layer_data(p)
#    y count   x xmin xmax    density     ncount   ndensity flipped_aes PANEL group ymin ymax colour   fill size linetype alpha
# 1 11    11 4.5 4.25 4.75 0.14666667 0.32352941 0.32352941       FALSE     1    -1    0   11     NA grey35  0.5        1    NA
# 2 34    34 5.0 4.75 5.25 0.45333333 1.00000000 1.00000000       FALSE     1    -1    0   34     NA grey35  0.5        1    NA
# 3 28    28 5.5 5.25 5.75 0.37333333 0.82352941 0.82352941       FALSE     1    -1    0   28     NA grey35  0.5        1    NA
# 4 26    26 6.0 5.75 6.25 0.34666667 0.76470588 0.76470588       FALSE     1    -1    0   26     NA grey35  0.5        1    NA
# 5 31    31 6.5 6.25 6.75 0.41333333 0.91176471 0.91176471       FALSE     1    -1    0   31     NA grey35  0.5        1    NA
# 6 12    12 7.0 6.75 7.25 0.16000000 0.35294118 0.35294118       FALSE     1    -1    0   12     NA grey35  0.5        1    NA
# 7  7     7 7.5 7.25 7.75 0.09333333 0.20588235 0.20588235       FALSE     1    -1    0    7     NA grey35  0.5        1    NA
# 8  1     1 8.0 7.75 8.25 0.01333333 0.02941176 0.02941176       FALSE     1    -1    0    1     NA grey35  0.5        1    NA

layer_scales(p)
# $x
# <ScaleContinuousPosition>
#  Range:  4.25 -- 8.25
#  Limits: 4.25 -- 8.25
#
# $y
# <ScaleContinuousPosition>
#  Range:     0 --   34
#  Limits:    0 --   34
#

layer_grob(p)
# $`1`
# rect[geom_rect.rect.****]
#

names(layer_data(p))
#  [1] "y"           "count"       "x"           "xmin"        "xmax"
#  [6] "density"     "ncount"      "ndensity"    "flipped_aes" "PANEL"
# [11] "group"       "ymin"        "ymax"        "colour"      "fill"
# [16] "size"        "linetype"    "alpha"
引数boundary
ビンの境界を指定できます。
ggplot(data = iris, aes(x = Sepal.Length)) +
  stat_bin(binwidth = 0.5, color = "white")
ggplot(data = iris, aes(x = Sepal.Length)) +
  stat_bin(binwidth = 0.5, boundary = 4.25, color = "white")

ggplot(data = iris, aes(x = Sepal.Length)) +
  stat_bin(binwidth = 0.5, boundary = 4.0, color = "white")

ggplot(data = iris, aes(x = Sepal.Length)) +
  stat_bin(binwidth = 0.5, boundary = 4.1, color = "white")

ggplot(data = iris, aes(x = Sepal.Length)) +
  stat_bin(binwidth = 0.5, boundary = 4.2, color = "white")

ggplot(data = iris, aes(x = Sepal.Length)) +
  stat_bin(binwidth = 0.5, boundary = 4.3, color = "white")

ggplot(data = iris, aes(x = Sepal.Length)) +
  stat_bin(binwidth = 0.5, boundary = 4.4, color = "white")
グラフの色分け
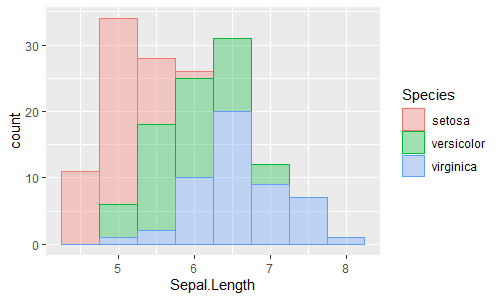
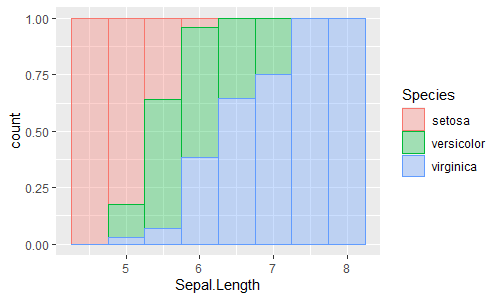
stat_count()と同様にstat_bin()でもcolor軸, fill軸を加えて色分けしたヒストグラムを描くこともできます。ただしこれもデフォルトでは積み上げになっています。
ggplot(data = iris, aes(x = Sepal.Length, color = Species, fill = Species)) +
  stat_bin(binwidth = 0.5, geom = "bar", alpha = 1/3)
ggplot(data = iris, aes(x = Sepal.Length, color = Species, fill = Species)) +
  stat_bin(binwidth = 0.5, geom = "bar", position = "stack", alpha = 1/3)
ggplot(data = iris, aes(x = Sepal.Length, color = Species, fill = Species)) +
  geom_histogram(stat = "bin", binwidth = 0.5, position = "stack", alpha = 1/3)
ggplot(data = iris, aes(x = Sepal.Length, color = Species, fill = Species)) +
  geom_histogram(stat = "bin", binwidth = 0.5, alpha = 1/3)

ggplot(data = iris, aes(x = Sepal.Length, color = Species, fill = Species)) +
  stat_bin(binwidth = 0.5, geom = "bar", position = "fill", alpha = 1/3)
ggplot(data = iris, aes(x = Sepal.Length, color = Species, fill = Species)) +
  geom_histogram(stat = "bin", binwidth = 0.5, position = "fill", alpha = 1/3)

ggplot(data = iris, aes(x = Sepal.Length, color = Species, fill = Species)) +
  stat_bin(binwidth = 0.5, geom = "bar", position = "identity", alpha = 1/3)
ggplot(data = iris, aes(x = Sepal.Length, color = Species, fill = Species)) +
  geom_histogram(stat = "bin", binwidth = 0.5, position = "identity", alpha = 1/3)

ggplot(data = iris, aes(x = Sepal.Length, color = Species, fill = Species)) +
  stat_bin(binwidth = 0.5, geom = "bar", position = "dodge", alpha = 1/3)
ggplot(data = iris, aes(x = Sepal.Length, color = Species, fill = Species)) +
  geom_histogram(stat = "bin", binwidth = 0.5, position = "dodge", alpha = 1/3)

ggplot(data = iris, aes(x = Sepal.Length, color = Species, fill = Species)) +
  stat_bin(binwidth = 0.5, geom = "bar", position = "dodge2", alpha = 1/3)
ggplot(data = iris, aes(x = Sepal.Length, color = Species, fill = Species)) +
  geom_histogram(stat = "bin", binwidth = 0.5, position = "dodge2", alpha = 1/3)
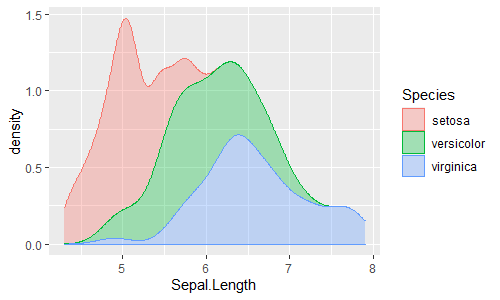
stat_density()
stat_density()は(データの実際の度数分布ではなく)データから密度推定された滑らかな曲線を計算します。デフォルトでgeom = "area"(面グラフ)で、これはgeom_area(stat = "density")と同じです。
ggplot(data = iris, aes(x = Sepal.Length)) +
  stat_density()
ggplot(data = iris, aes(x = Sepal.Length)) +
  stat_density(geom = "area")
ggplot(data = iris, aes(x = Sepal.Length)) +
  geom_area(stat = "density")
geom
ggplot(data = iris, aes(x = Sepal.Length)) +
  stat_density(geom = "line")
ggplot(data = iris, aes(x = Sepal.Length)) +
  stat_density(geom = "path")
ggplot(data = iris, aes(x = Sepal.Length)) +
  geom_density(stat = "density")
ggplot(data = iris, aes(x = Sepal.Length)) +
  geom_density()
ggplot(data = iris, aes(x = Sepal.Length)) +
  stat_density(geom = "point", n = 512) # n = 512 (default)

ggplot(data = iris, aes(x = Sepal.Length)) +
  stat_density(geom = "point", n = 50)

ggplot(data = iris, aes(x = Sepal.Length)) +
  stat_density(geom = "step", n = 50)
..count..等
-
..density..:推定された密度 -
..count..:密度から逆算されたカウント数(=..density.. * データ数) -
..ndensity..:..density..の正規化(=..density.. / (max(..density..))) -
..scaled..:..count..の正規化(=..count.. / (max(..count..)))
ggplot(data = iris, aes(x = Sepal.Length)) +
  stat_density(geom = "line")
ggplot(data = iris, aes(x = Sepal.Length)) +
  stat_density(geom = "line", aes(y = ..density..))

ggplot(data = iris, aes(x = Sepal.Length)) +
  stat_density(geom = "line", aes(y = ..count..))
# これは次と同じ
ggplot(data = iris, aes(x = Sepal.Length)) +
  stat_density(geom = "line", aes(y = ..density.. * 150))

ggplot(data = iris, aes(x = Sepal.Length)) +
  stat_density(geom = "line", aes(y = ..ndensity..))
# これは次と同じ
ggplot(data = iris, aes(x = Sepal.Length)) +
  stat_density(geom = "line", aes(y = ..density..  / (max(..density..))))

ggplot(data = iris, aes(x = Sepal.Length)) +
  stat_density(geom = "line", aes(y = ..scaled..))
# これは次と同じ
ggplot(data = iris, aes(x = Sepal.Length)) +
  stat_density(geom = "line", aes(y = ..count.. / (max(..count..))))
これを利用して次のようなグラフも描けます。
ggplot(data = iris, aes(x = Sepal.Length)) +
  stat_density(geom = "line", aes(color = ..count..))

ggplot(data = iris, aes(x = Sepal.Length)) +
  stat_density(geom = "point", n = 50, aes(color = ..count..))

ggplot(data = iris, aes(x = Sepal.Length)) +
  stat_density(geom = "point", aes(color = ..count..))

ggplot(data = iris, aes(x = Sepal.Length)) +
  stat_density(geom = "segment", aes(xend = ..x.., yend = 0, color = ..count..))
内部的に計算されている値を確認しておきます。
p <- ggplot(data = iris, aes(x = Sepal.Length)) +
  stat_density()
ggplot_build(p)

layer_data(p) %>% head()
#            y        x    density    scaled  ndensity    count   n flipped_aes PANEL group ymin       ymax     xmin     xmax colour   fill size linetype alpha
# 1 0.09211271 4.300000 0.09211271 0.2321279 0.2321279 13.81691 150       FALSE     1    -1    0 0.09211271 4.300000 4.300000     NA grey20  0.5        1    NA
# 2 0.09445896 4.307045 0.09445896 0.2380405 0.2380405 14.16884 150       FALSE     1    -1    0 0.09445896 4.307045 4.307045     NA grey20  0.5        1    NA
# 3 0.09683810 4.314090 0.09683810 0.2440360 0.2440360 14.52571 150       FALSE     1    -1    0 0.09683810 4.314090 4.314090     NA grey20  0.5        1    NA
# 4 0.09925590 4.321135 0.09925590 0.2501290 0.2501290 14.88839 150       FALSE     1    -1    0 0.09925590 4.321135 4.321135     NA grey20  0.5        1    NA
# 5 0.10169377 4.328180 0.10169377 0.2562725 0.2562725 15.25406 150       FALSE     1    -1    0 0.10169377 4.328180 4.328180     NA grey20  0.5        1    NA
# 6 0.10417516 4.335225 0.10417516 0.2625257 0.2625257 15.62627 150       FALSE     1    -1    0 0.10417516 4.335225 4.335225     NA grey20  0.5        1    NA

layer_scales(p)
# $x
# <ScaleContinuousPosition>
#  Range:   4.3 --  7.9
#  Limits:  4.3 --  7.9
#
# $y
# <ScaleContinuousPosition>
#  Range:     0 -- 0.397
#  Limits:    0 -- 0.397
#

layer_grob(p)
# $`1`
# gTree[geom_area.gTree.****]
#
引数kernel
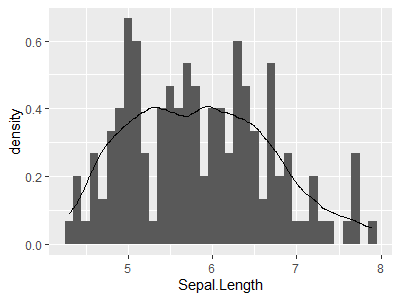
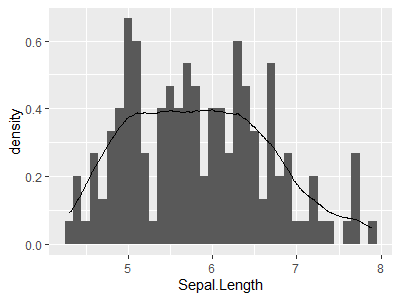
密度推定のカーネルとして次が使えます。
-
kernel = "gaussian":デフォルト kernel = "epanechnikov"kernel = "rectangular"kernel = "triangular"kernel = "biweight"kernel = "cosine"kernel = "optcosine"
ggplot(data = iris, aes(x = Sepal.Length)) +
  stat_bin(binwidth = 0.1, aes(y = ..density..)) +
  stat_density(geom = "line", kernel = "gaussian")
ggplot(data = iris, aes(x = Sepal.Length)) +
  stat_bin(binwidth = 0.1, aes(y = ..density..)) +
  stat_density(geom = "line")

ggplot(data = iris, aes(x = Sepal.Length)) +
  stat_bin(binwidth = 0.1, aes(y = ..density..)) +
  stat_density(geom = "line", kernel = "epanechnikov")

ggplot(data = iris, aes(x = Sepal.Length)) +
  stat_bin(binwidth = 0.1, aes(y = ..density..)) +
  stat_density(geom = "line", kernel = "rectangular")

ggplot(data = iris, aes(x = Sepal.Length)) +
  stat_bin(binwidth = 0.1, aes(y = ..density..)) +
  stat_density(geom = "line", kernel = "triangular")

ggplot(data = iris, aes(x = Sepal.Length)) +
  stat_bin(binwidth = 0.1, aes(y = ..density..)) +
  stat_density(geom = "line", kernel = "biweight")

ggplot(data = iris, aes(x = Sepal.Length)) +
  stat_bin(binwidth = 0.1, aes(y = ..density..)) +
  stat_density(geom = "line", kernel = "cosine")

ggplot(data = iris, aes(x = Sepal.Length)) +
  stat_bin(binwidth = 0.1, aes(y = ..density..)) +
  stat_density(geom = "line", kernel = "optcosine")
グラフの色分け
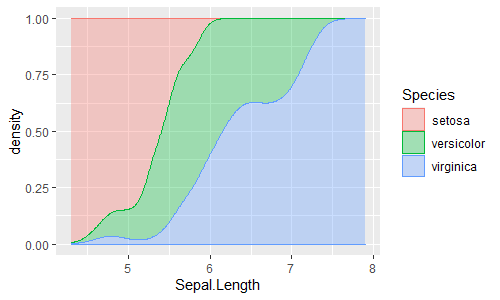
これもcolor軸, fill軸を加えて色分けできます。ただしデフォルトではposition = "identity"になっています。
ggplot(data = iris, aes(x = Sepal.Length, color = Species, fill = Species)) +
  stat_density(geom = "area", alpha = 1/3)
ggplot(data = iris, aes(x = Sepal.Length, color = Species, fill = Species)) +
  stat_density(geom = "area", position = "identity", alpha = 1/3)
ggplot(data = iris, aes(x = Sepal.Length, color = Species, fill = Species)) +
  geom_area(stat = "density", alpha = 1/3)
ggplot(data = iris, aes(x = Sepal.Length, color = Species, fill = Species)) +
  geom_area(stat = "density", position = "identity", alpha = 1/3)

ggplot(data = iris, aes(x = Sepal.Length, color = Species, fill = Species)) +
  stat_density(geom = "area", position = "stack", alpha = 1/3)
ggplot(data = iris, aes(x = Sepal.Length, color = Species, fill = Species)) +
  geom_area(stat = "density", position = "stack", alpha = 1/3)

ggplot(data = iris, aes(x = Sepal.Length, color = Species, fill = Species)) +
  stat_density(geom = "area", position = "fill", alpha = 1/3)
ggplot(data = iris, aes(x = Sepal.Length, color = Species, fill = Species)) +
  geom_area(stat = "density", position = "fill", alpha = 1/3)
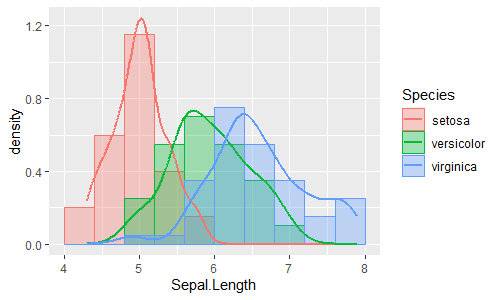
ggplot(data = iris, aes(x = Sepal.Length, color = Species, fill = Species)) +
  stat_bin(binwidth = 0.4, boundary = 0, geom = "bar", aes(y = ..density..),
           position = "identity", alpha = 1/3) +
  stat_density(geom = "line", position = "identity", size = 1)

ggplot(data = iris, aes(x = Sepal.Length, y = ..density..)) +
  stat_bin(binwidth = 0.4, boundary = 0, geom = "bar", aes(fill = Species),
           position = "identity", alpha = 1/3) +
  stat_density(geom = "line", aes(color = Species),
               position = "identity", size = 1, show.legend = FALSE)
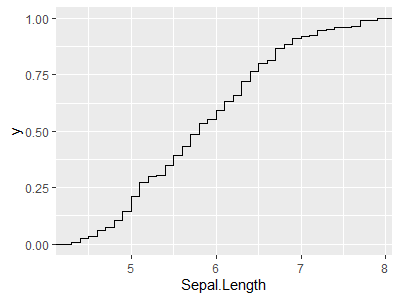
stat_ecdf()
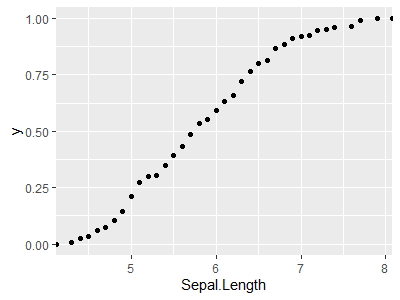
stat_ecdf()は経験累積密度関数(empirical cumulative distribution function (ECDF) )を計算します。
デフォルトでgeom = "step"(階段関数)で、これはgeom_step(stat = "ecdf")と同じです。
ggplot(data = iris, aes(x = Sepal.Length)) +
  stat_ecdf()
ggplot(data = iris, aes(x = Sepal.Length)) +
  stat_ecdf(geom = "step")
ggplot(data = iris, aes(x = Sepal.Length)) +
  geom_step(stat = "ecdf")
geom
ggplot(data = iris, aes(x = Sepal.Length)) +
  stat_ecdf(geom = "step")
ggplot(data = iris, aes(x = Sepal.Length)) +
  geom_step(stat = "ecdf")

ggplot(data = iris, aes(x = Sepal.Length)) +
  stat_ecdf(geom = "line")
ggplot(data = iris, aes(x = Sepal.Length)) +
  geom_line(stat = "ecdf")

ggplot(data = iris, aes(x = Sepal.Length)) +
  stat_ecdf(geom = "point")
ggplot(data = iris, aes(x = Sepal.Length)) +
  geom_point(stat = "ecdf")

ggplot(data = iris, aes(x = Sepal.Length)) +
  stat_ecdf(geom = "area", alpha = 0.5)
..y..等
-
..y..:経験累積密度関数の値 -
..x..:経験累積密度関数のx座標
ggplot(data = iris, aes(x = Sepal.Length)) +
  stat_ecdf(geom = "step", aes(y = ..y..))
ggplot(data = iris, aes(x = Sepal.Length)) +
  stat_ecdf(geom = "step")

ggplot(data = iris, aes(x = Sepal.Length)) +
  stat_ecdf(geom = "step", aes(y = 1 - ..y..))

ggplot(data = iris, aes(x = Sepal.Length)) +
  stat_ecdf(geom = "step", aes(y = ..y..)) +
  stat_ecdf(geom = "segment", aes(xend = ..x.., yend = 0, color = ..y..))

ggplot(data = iris, aes(x = Sepal.Length)) +
  stat_ecdf(geom = "step", aes(y = ..y..)) +
  stat_ecdf(geom = "segment", aes(xend = 8, yend = ..y.., color = ..y..))
内部的に計算されている値を確認しておきます。
p <- ggplot(data = iris, aes(x = Sepal.Length)) +
  stat_ecdf()
ggplot_build(p)

layer_data(p) %>% head()
#            y    x PANEL group colour size linetype alpha
# 1 0.00000000 -Inf     1    -1  black  0.5        1    NA
# 2 0.27333333  5.1     1    -1  black  0.5        1    NA
# 3 0.14666667  4.9     1    -1  black  0.5        1    NA
# 4 0.07333333  4.7     1    -1  black  0.5        1    NA
# 5 0.06000000  4.6     1    -1  black  0.5        1    NA
# 6 0.21333333  5.0     1    -1  black  0.5        1    NA

layer_scales(p)
# $x
# <ScaleContinuousPosition>
#  Range:   4.3 --  7.9
#  Limits:  4.3 --  7.9
#
# $y
# <ScaleContinuousPosition>
#  Range:     0 --    1
#  Limits:    0 --    1
#

layer_grob(p)
# $`1`
# polyline[GRID.polyline.****]
#
ヒストグラムと重ね描きしておきます。
ggplot(iris, aes(Sepal.Length)) +
  stat_bin(binwidth = 0.1, geom = "bar", aes(y = ..density..)) +
  stat_ecdf()
ggplot(iris, aes(Sepal.Length)) +
  stat_count(geom = "bar", aes(y = ..prop.. / 0.1), width = 0.1) +
  stat_ecdf()
グラフの色分け
これもcolor軸を入れて色分けができます。デフォルトでposition = "identity"です。
ggplot(data = iris, aes(x = Sepal.Length, color = Species)) +
  stat_ecdf()
ggplot(data = iris, aes(x = Sepal.Length, color = Species)) +
  stat_ecdf(geom = "step")
ggplot(data = iris, aes(x = Sepal.Length, color = Species)) +
  stat_ecdf(geom = "step", position = "identity")
ggplot(data = iris, aes(x = Sepal.Length, color = Species)) +
  geom_step(stat = "ecdf")
ggplot(data = iris, aes(x = Sepal.Length, color = Species)) +
  geom_step(stat = "ecdf", position = "identity")
stat_qq()
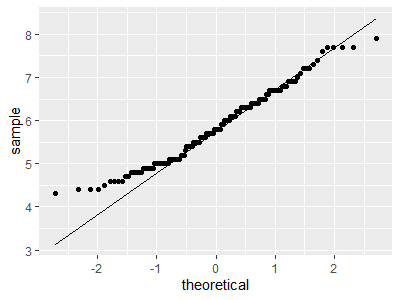
stat_qq()はQ-Qプロット(Quantile-Quantile Plot)のもとになる値を計算します。デフォルトでgeom = "point"で、これはgeom_qq(geom = "point")と同じです。
stat_qq_line()はQ-Qプロットにデータの上四分位点と下四分位点を結ぶ直線を計算します。デフォルトでgeom = "path"で、これはgeom_qq_line(geom = "path")と同じです。
ggplot(data = iris, aes(sample = Sepal.Length)) +
  stat_qq() +
  stat_qq_line()
ggplot(data = iris, aes(sample = Sepal.Length)) +
  stat_qq(geom = "point") +
  stat_qq_line(geom = "path")
ggplot(data = iris, aes(sample = Sepal.Length)) +
  geom_qq() +
  geom_qq_line()
ggplot(data = iris, aes(sample = Sepal.Length)) +
  geom_qq(geom = "point") +
  geom_qq_line(geom = "path")
..sample..等
-
..sample..:観測値 -
..theoretical..:理論値
ggplot(data = iris, aes(sample = Sepal.Length)) +
  stat_qq() +
  stat_qq_line()
ggplot(data = iris, aes(sample = Sepal.Length)) +
  stat_qq(geom = "point", aes(x = ..theoretical.., y = ..sample..)) +
  stat_qq_line(geom = "path", aes(x = ..x.., y = ..y..))

ggplot(data = iris, aes(sample = Sepal.Length)) +
  stat_qq(geom = "point", aes(x = ..theoretical.., y = ..sample..)) +
  stat_qq_line(geom = "path", aes(x = ..x.., y = ..y..)) +
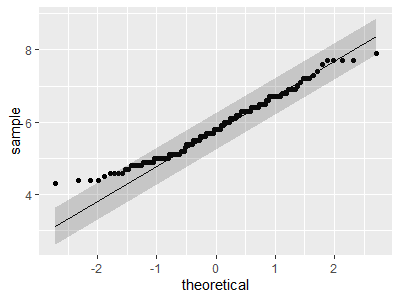
  stat_qq_line(geom = "ribbon",
               aes(x = ..x.., ymin = ..y..-0.5, ymax = ..y..+0.5), alpha = 0.3)

ggplot(data = iris, aes(sample = Sepal.Length)) +
  stat_qq(geom = "point", aes(x = ..sample.., y = ..theoretical..)) +
  stat_qq_line(geom = "path", aes(x = ..y.., y = ..x..))

ggplot(data = iris, aes(sample = Sepal.Length)) +
  stat_qq_line(geom = "path", aes(x = ..x.., y = ..y..)) +
  stat_qq(geom = "text", aes(x = ..theoretical.., y = ..sample..), label="+")
内部的に計算されている値を確認しておきます。
p <- ggplot(data = iris, aes(sample = Sepal.Length)) +
  stat_qq() +
  stat_qq_line()
ggplot_build(p)

layer_data(p, 1) %>% head()
#           x   y sample theoretical PANEL group shape colour size fill alpha stroke
# 1 -2.713052 4.3    4.3   -2.713052     1    -1    19  black  1.5   NA    NA    0.5
# 2 -2.326348 4.4    4.4   -2.326348     1    -1    19  black  1.5   NA    NA    0.5
# 3 -2.128045 4.4    4.4   -2.128045     1    -1    19  black  1.5   NA    NA    0.5
# 4 -1.989313 4.4    4.4   -1.989313     1    -1    19  black  1.5   NA    NA    0.5
# 5 -1.880794 4.5    4.5   -1.880794     1    -1    19  black  1.5   NA    NA    0.5
# 6 -1.790751 4.6    4.6   -1.790751     1    -1    19  black  1.5   NA    NA    0.5
layer_data(p, 2) %>% head()
#           x        y PANEL group colour size linetype alpha
# 1 -2.713052 3.135455     1    -1  black  0.5        1    NA
# 2  2.713052 8.364545     1    -1  black  0.5        1    NA

layer_scales(p)
# $x
# <ScaleContinuousPosition>
#  Range:  -2.71 -- 2.71
#  Limits: -2.71 -- 2.71
#
# $y
# <ScaleContinuousPosition>
#  Range:  3.14 -- 8.36
#  Limits: 3.14 -- 8.36
#

layer_grob(p, 1)
# $`1`
# points[geom_point.points.****]
#
layer_grob(p, 2)
# $`1`
# polyline[GRID.polyline.****]
#
引数distribution, dparams
デフォルトはdistribution = stats::qnorm(正規分布)です。
distribution = stats::qt, dparams = list(df = 10)とすると、自由度10のt分布となります。
ggplot(data = iris, aes(sample = Sepal.Length)) +
  stat_qq() +
  stat_qq_line()
ggplot(data = iris, aes(sample = Sepal.Length)) +
  stat_qq(distribution = stats::qnorm) +
  stat_qq_line(distribution = stats::qnorm)

ggplot(data = iris, aes(sample = Sepal.Length)) +
  stat_qq(distribution = stats::qt, dparams = list(df = 10)) +
  stat_qq_line(distribution = stats::qt, dparams = list(df = 10))
set.seed(0)
df_norm <- data.frame(x = rnorm(1000, 0, 1))

ggplot(data = df_norm, aes(sample = x)) +
  stat_qq() +
  stat_qq_line()
ggplot(data = df_norm, aes(sample = x)) +
  stat_qq(distribution = stats::qnorm) +
  stat_qq_line(distribution = stats::qnorm)
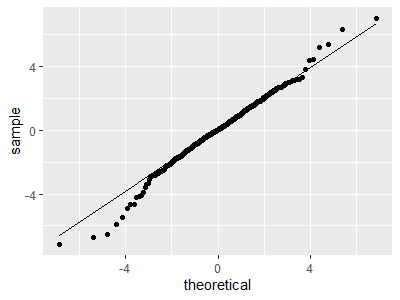
set.seed(0)
df_t5 <- data.frame(x = rt(1000, df = 5))

ggplot(data = df_t5, aes(sample = x)) +
  stat_qq() +
  stat_qq_line()

ggplot(data = df_t5, aes(sample = x)) +
  stat_qq(distribution = stats::qt, dparams = list(df = 10)) +
  stat_qq_line(distribution = stats::qt, dparams = list(df = 10))

ggplot(data = df_t5, aes(sample = x)) +
  stat_qq(distribution = stats::qt, dparams = list(df = 5)) +
  stat_qq_line(distribution = stats::qt, dparams = list(df = 5))
グラフの色分け
これもcolor軸を入れて色分けができます。デフォルトでposition = "identity"です。
ggplot(data = iris, aes(sample = Sepal.Length, color = Species)) +
  stat_qq() +
  stat_qq_line()
ggplot(data = iris, aes(sample = Sepal.Length, color = Species)) +
  stat_qq(geom = "point", position = "identity") +
  stat_qq_line(geom = "path", position = "identity")
ggplot(data = iris, aes(sample = Sepal.Length, color = Species)) +
  geom_qq() +
  geom_qq_line()
ggplot(data = iris, aes(sample = Sepal.Length, color = Species)) +
  geom_qq(geom = "point", position = "identity") +
  geom_qq_line(geom = "path", position = "identity")
2変数(x:離散,y:離散)
stat_sum()
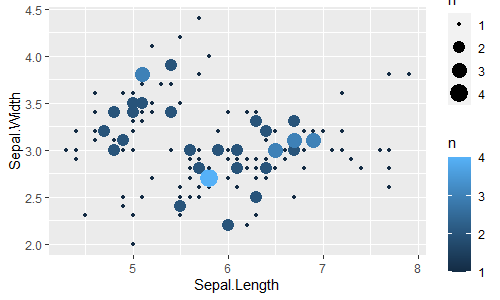
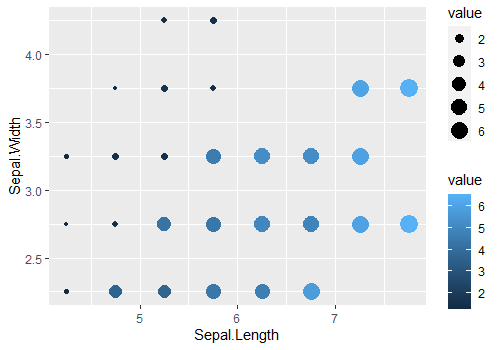
stat_sum()はstat_count()の2次元版で、2次元の離散×離散のセルごとにカウント集計します。デフォルトでgeom = "point"(散布図、ただしカウント集計の結果を点の大きさで表すバブルチャート)で、これはgeom_count(stat = "sum")と同じです。
ggplot(data = iris, aes(factor(round(Sepal.Length)), y = factor(round(Sepal.Width)))) +
  stat_sum()
ggplot(data = iris, aes(factor(round(Sepal.Length)), y = factor(round(Sepal.Width)))) +
  stat_sum(geom = "point")
ggplot(data = iris, aes(factor(round(Sepal.Length)), y = factor(round(Sepal.Width)))) +
  geom_count()
ggplot(data = iris, aes(factor(round(Sepal.Length)), y = factor(round(Sepal.Width)))) +
  geom_count(stat = "sum")
ggplot(data = iris, aes(x = Sepal.Length, y = Sepal.Width)) +
  stat_sum()
ggplot(data = iris, aes(x = Sepal.Length, y = Sepal.Width)) +
  stat_sum(geom = "point")
ggplot(data = iris, aes(x = Sepal.Length, y = Sepal.Width)) +
  geom_count()
ggplot(data = iris, aes(x = Sepal.Length, y = Sepal.Width)) +
  geom_count(stat = "sum")
..n..等
-
..n..:カウント数 -
..prop..:割合(=..n.. / 全体の数)
ggplot(data = iris, aes(x = Sepal.Length, y = Sepal.Width)) +
  stat_sum()
ggplot(data = iris, aes(x = Sepal.Length, y = Sepal.Width)) +
  stat_sum(aes(size = ..n..))
ggplot(data = iris, aes(x = Sepal.Length, y = Sepal.Width)) +
  stat_sum(aes(size = ..n..), geom = "point")
ggplot(data = iris, aes(x = Sepal.Length, y = Sepal.Width)) +
  geom_point(stat = "sum", aes(size = ..n..))
ggplot(data = iris, aes(x = Sepal.Length, y = Sepal.Width)) +
  geom_point(stat = "sum")

ggplot(data = iris, aes(x = Sepal.Length, y = Sepal.Width)) +
  stat_sum(aes(size = ..prop..))
# これはこれと同じ
ggplot(data = iris, aes(x = Sepal.Length, y = Sepal.Width)) +
  stat_sum(aes(size = ..n.. / 150))
ggplot(data = iris, aes(x = Sepal.Length, y = Sepal.Width)) +
  stat_sum(aes(size = after_stat(n / 150)))

ggplot(data = iris, aes(x = Sepal.Length, y = Sepal.Width)) +
  stat_sum(aes(color = ..n..), geom = "point")
ggplot(data = iris, aes(x = Sepal.Length, y = Sepal.Width)) +
  stat_sum(aes(size = ..n.., color = ..n..), geom = "point")
これを利用して次のようなグラフも描けます。
ggplot(data = iris, aes(factor(round(Sepal.Length)), y = factor(round(Sepal.Width)))) +
  stat_sum(geom = "point", aes(size = ..n.., color = ..n..)) +
  stat_sum(geom = "text", aes(label = ..n..),
           position = position_nudge(x = 0.2, y = 0.2), size = 4)
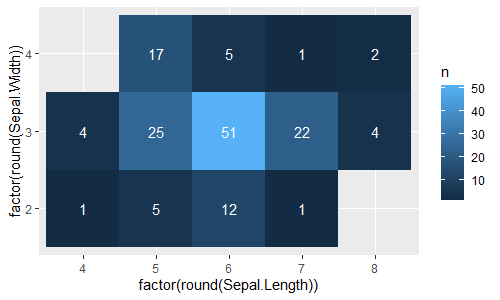
特に、ヒートマップも描けます。
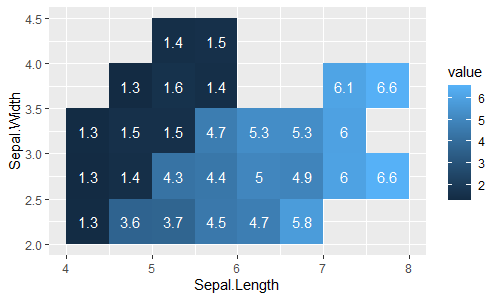
ggplot(data = iris, aes(factor(round(Sepal.Length)), y = factor(round(Sepal.Width)))) +
  stat_sum(geom = "tile", aes(fill = ..n..)) +
  guides(size = "none")
ggplot(data = iris, aes(factor(round(Sepal.Length)), y = factor(round(Sepal.Width)))) +
  geom_tile(stat="sum", aes(fill = ..n..)) +
  guides(size = "none")

ggplot(data = iris, aes(factor(round(Sepal.Length)), y = factor(round(Sepal.Width)))) +
  stat_sum(geom = "tile", aes(fill = ..n..)) +
  stat_sum(geom = "text", aes(label = ..n..), color = "white", size = 4) +
  guides(size = "none")
ggplot(data = iris, aes(factor(round(Sepal.Length)), y = factor(round(Sepal.Width)))) +
  stat_sum(geom = "rect",
           aes(xmin = ..x.. - 0.5, xmax = ..x.. + 0.5,
               ymin = ..y.. - 0.5, ymax = ..y.. + 0.5, fill = ..n..)) +
  stat_sum(geom = "text", aes(label = ..n..), color = "white", size = 4) +
  guides(size = "none")
ヒートマップを色ではなく透明度で描くこともできます。2021/07/04追記
ggplot(data = iris, aes(factor(round(Sepal.Length)), y = factor(round(Sepal.Width)))) +
  stat_sum(geom = "tile", aes(alpha = ..n..)) +
  guides(size = "none")
ggplot(data = iris, aes(factor(round(Sepal.Length)), y = factor(round(Sepal.Width)))) +
  geom_tile(stat = "sum", aes(alpha = ..n..)) +
  guides(size = "none")

ggplot(data = iris, aes(x = Sepal.Length, y = Sepal.Width)) +
  stat_sum(geom = "tile", aes(alpha = ..n..)) +
  guides(size = "none")
ggplot(data = iris, aes(x = Sepal.Length, y = Sepal.Width)) +
  geom_tile(stat = "sum", aes(alpha = ..n..)) +
  guides(size = "none")
内部的に計算されている値を確認しておきます。
p <- ggplot(data = iris, aes(factor(round(Sepal.Length)), y = factor(round(Sepal.Width)))) +
  stat_sum()
ggplot_build(p)

layer_data(p) %>% head()
#       size PANEL x y group  n prop shape colour fill alpha stroke
# 1 1.000000     1 1 1     1  1    1    19  black   NA    NA    0.5
# 2 2.224745     1 1 2     2  4    1    19  black   NA    NA    0.5
# 3 2.414214     1 2 1     3  5    1    19  black   NA    NA    0.5
# 4 4.464102     1 2 2     4 25    1    19  black   NA    NA    0.5
# 5 3.828427     1 2 3     5 17    1    19  black   NA    NA    0.5
# 6 3.345208     1 3 1     6 12    1    19  black   NA    NA    0.5

layer_scales(p)

layer_grob(p)
# $`1`
# points[geom_point.points.****]
#
引数group
-
aes(size = ..prop.., group = 1):全体に対する割合 -
aes(size = ..prop.., group = x軸の変数):x軸の値ごとのy軸方向の割合 -
aes(size = ..prop.., group = y軸の変数):y軸の値ごとのx軸方向の割合
ggplot(data = iris, aes(factor(round(Sepal.Length)), y = factor(round(Sepal.Width)))) +
  stat_sum()
ggplot(data = iris, aes(factor(round(Sepal.Length)), y = factor(round(Sepal.Width)))) +
  stat_sum(aes(size = ..n..))

ggplot(data = iris, aes(factor(round(Sepal.Length)), y = factor(round(Sepal.Width)))) +
  stat_sum(aes(size = ..prop..))

ggplot(data = iris, aes(factor(round(Sepal.Length)), y = factor(round(Sepal.Width)))) +
  stat_sum(aes(size = ..prop.., group = 1)) # 全体を1つのグループ
# これと同じ
ggplot(data = iris, aes(factor(round(Sepal.Length)), y = factor(round(Sepal.Width)))) +
  stat_sum(aes(size = ..n../150))

ggplot(data = iris, aes(factor(round(Sepal.Length)), y = factor(round(Sepal.Width)))) +
  stat_sum(aes(size = ..prop.., group = factor(round(Sepal.Length))))

ggplot(data = iris, aes(factor(round(Sepal.Length)), y = factor(round(Sepal.Width)))) +
  stat_sum(aes(size = ..prop.., group = factor(round(Sepal.Width))))
グラフの色分け
これもcolor軸を入れて色分けができます。デフォルトでposition = "identity"です。
-
position_identity():点を重ねる -
position_dodge():点をずらす -
position_jitter():点をランダムにばらけさせる
ggplot(data = iris, aes(factor(round(Sepal.Length)), y = factor(round(Sepal.Width)), color = Species)) +
  stat_sum(alpha = 2/3)
ggplot(data = iris, aes(factor(round(Sepal.Length)), y = factor(round(Sepal.Width)), color = Species)) +
  stat_sum(position = "identity", alpha = 2/3)
ggplot(data = iris, aes(factor(round(Sepal.Length)), y = factor(round(Sepal.Width)), color = Species)) +
  stat_sum(position = position_identity(), alpha = 2/3)

ggplot(data = iris, aes(factor(round(Sepal.Length)), y = factor(round(Sepal.Width)), color = Species)) +
  stat_sum(position = position_dodge(width = 0.7), alpha = 2/3)

ggplot(data = iris, aes(factor(round(Sepal.Length)), y = factor(round(Sepal.Width)), color = Species)) +
  stat_sum(position = position_jitter(width = 0.1, height = 0.1, seed = 0), alpha = 2/3)
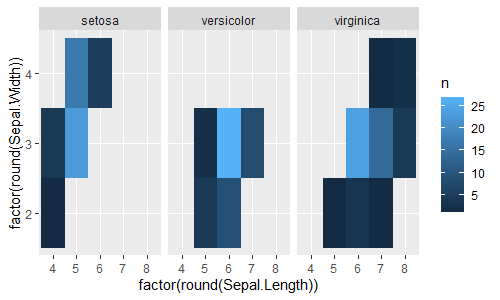
ヒートマップ表示などそもそも色で値の違いを表現するものについては、別の色の軸を入れることができません。このような場合は、ファセット(facet)するのが便利です。
ggplot(data = iris, aes(factor(round(Sepal.Length)), y = factor(round(Sepal.Width)))) +
  stat_sum(geom = "tile", aes(fill = ..n..)) +
  guides(size = "none") +
  facet_grid(cols = vars(Species))
ggplot(data = iris, aes(factor(round(Sepal.Length)), y = factor(round(Sepal.Width)))) +
  geom_tile(stat="sum", aes(fill = ..n..)) +
  guides(size = "none") +
  facet_grid(cols = vars(Species))

ggplot(data = iris, aes(x = Sepal.Length, y = Sepal.Width)) +
  stat_sum(aes(color = ..n..), geom = "point") +
  facet_grid(cols = vars(Species))
ggplot(data = iris, aes(x = Sepal.Length, y = Sepal.Width)) +
  stat_sum(aes(size = ..n.., color = ..n..), geom = "point") +
  facet_grid(cols = vars(Species))
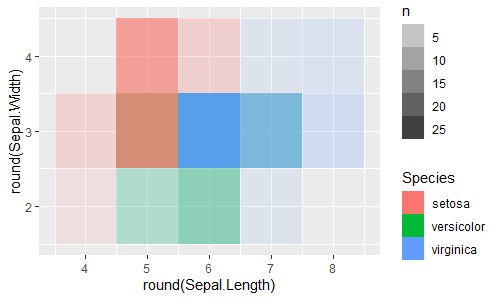
ヒートマップ表示でも、色ではなく透明度で値の違いを表現するようにすれば、別の色の軸を入れることができます。2021/07/04追記
ggplot(data = iris, aes(round(Sepal.Length), y = round(Sepal.Width))) +
  stat_sum(geom = "tile", aes(alpha = ..n.., fill = Species)) +
  guides(size = "none")

ggplot(data = iris, aes(x = Sepal.Length, y = Sepal.Width)) +
  stat_sum(geom = "tile", aes(alpha = ..n.., fill = Species)) +
  guides(size = "none")
2変数(x:離散,y:連続)
stat_boxplot()
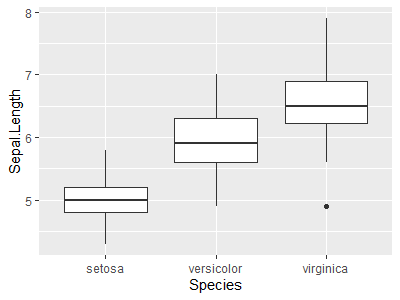
stat_boxplot()は箱ひげ図(ボックスプロット)を描くもとになる値を計算します。デフォルトでgeom = "boxplot"(箱ひげ図)で、これはgeom_boxplot(stat = "boxplot")と同じです。
ggplot(data = iris, aes(x = Species, y = Sepal.Length)) +
  stat_boxplot()
ggplot(data = iris, aes(x = Species, y = Sepal.Length)) +
  stat_boxplot(geom = "boxplot")
ggplot(data = iris, aes(x = Species, y = Sepal.Length)) +
  geom_boxplot()
ggplot(data = iris, aes(x = Species, y = Sepal.Length)) +
  geom_boxplot(stat = "boxplot")
..lower..等
-
..lower..,..upper..:箱の上下 -
..ymin..,..ymax..:ひげの上下
ggplot(data = iris, aes(x = Species, y = Sepal.Length)) +
  stat_boxplot(geom = "errorbar", aes(ymin = ..lower.., ymax = ..upper..)) +
  stat_boxplot(geom = "errorbar", aes(ymin = ..ymin.., ymax = ..ymax..), width = 0.2)
内部的に計算されている値を確認しておきます。
p <- ggplot(data = iris, aes(x = Species, Sepal.Length)) +
  stat_boxplot()
ggplot_build(p)

layer_data(p)
#   ymin lower middle upper ymax outliers notchupper notchlower x flipped_aes PANEL group ymin_final ymax_final
# 1  4.3 4.800    5.0   5.2  5.8            5.089378   4.910622 1       FALSE     1     1        4.3        5.8
# 2  4.9 5.600    5.9   6.3  7.0            6.056412   5.743588 2       FALSE     1     2        4.9        7.0
# 3  5.6 6.225    6.5   6.9  7.9      4.9   6.650826   6.349174 3       FALSE     1     3        4.9        7.9
#    xmin  xmax xid newx new_width weight colour  fill size alpha shape linetype
# 1 0.625 1.375   1    1      0.75      1 grey20 white  0.5    NA    19    solid
# 2 1.625 2.375   2    2      0.75      1 grey20 white  0.5    NA    19    solid
# 3 2.625 3.375   3    3      0.75      1 grey20 white  0.5    NA    19    solid
#       size PANEL x y group  n prop shape colour fill alpha stroke
# 1 1.000000     1 1 1     1  1    1    19  black   NA    NA    0.5
# 2 2.224745     1 1 2     2  4    1    19  black   NA    NA    0.5
# 3 2.414214     1 2 1     3  5    1    19  black   NA    NA    0.5
# 4 4.464102     1 2 2     4 25    1    19  black   NA    NA    0.5
# 5 3.828427     1 2 3     5 17    1    19  black   NA    NA    0.5
# 6 3.345208     1 3 1     6 12    1    19  black   NA    NA    0.5

layer_scales(p)

layer_grob(p)
# $`1`
# points[geom_point.points.****]
#
グラフの色分け
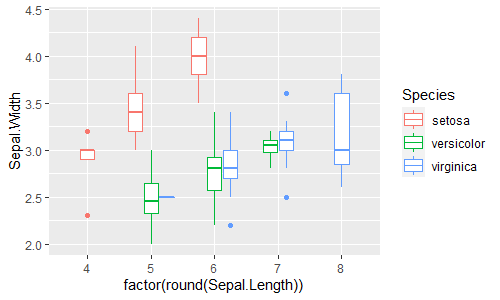
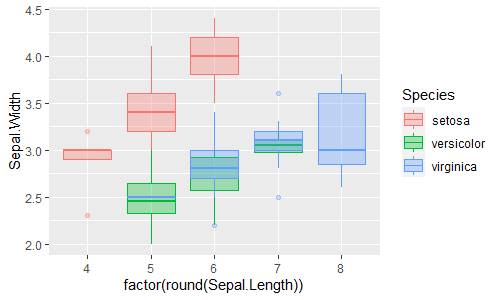
これもcolor軸, fill軸を入れて色分けができます。デフォルトではposition = "dodge2"です。
ggplot(data = iris, aes(x = factor(round(Sepal.Length)), y = Sepal.Width, color = Species)) +
  stat_boxplot(geom = "boxplot")
ggplot(data = iris, aes(x = factor(round(Sepal.Length)), y = Sepal.Width, color = Species)) +
  stat_boxplot(geom = "boxplot", position = "dodge2")
ggplot(data = iris, aes(x = factor(round(Sepal.Length)), y = Sepal.Width, color = Species)) +
  stat_boxplot(geom = "boxplot", position = position_dodge2(preserve = "total"))

ggplot(data = iris, aes(x = factor(round(Sepal.Length)), y = Sepal.Width, color = Species)) +
  stat_boxplot(geom = "boxplot", position = position_dodge2(preserve = "single"))

ggplot(data = iris, aes(x = factor(round(Sepal.Length)), y = Sepal.Width, color = Species)) +
  stat_boxplot(geom = "boxplot", position = position_dodge(preserve = "single"))

ggplot(data = iris, aes(x = factor(round(Sepal.Length)), y = Sepal.Width, color = Species)) +
  stat_boxplot(geom = "boxplot", position = "identity")

ggplot(data = iris, aes(x = factor(round(Sepal.Length)), y = Sepal.Width,
                        color = Species, fill = Species)) +
  stat_boxplot(geom = "boxplot", position = "identity", alpha = 1/3)
stat_ydensity()
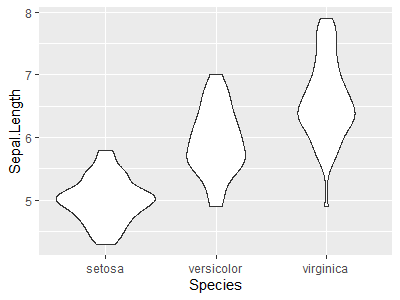
stat_ydensity()はバイオリンプロットを描くもとになる値を計算します。デフォルトでgeom = "violin"(バイオリンプロット)で、これはgeom_violin(stat = "ydensity")と同じです。
ggplot(data = iris, aes(x = Species, y = Sepal.Length)) +
  stat_ydensity()
ggplot(data = iris, aes(x = Species, y = Sepal.Length)) +
  stat_ydensity(geom = "violin")
ggplot(data = iris, aes(x = Species, y = Sepal.Length)) +
  geom_violin()
ggplot(data = iris, aes(x = Species, y = Sepal.Length)) +
  geom_violin(stat = "ydensity")
内部的に計算されている値を確認しておきます。
p <- ggplot(data = iris, aes(x = Species, y = Sepal.Length)) +
  stat_ydensity()
ggplot_build(p)

layer_data(p) %>% head()
#   x   density    scaled  ndensity    count  n        y PANEL group violinwidth
# 1 1 0.2362248 0.1905121 0.1905121 11.81124 50 4.300000     1     1   0.1905121
# 2 1 0.2404396 0.1939112 0.1939112 12.02198 50 4.302935     1     1   0.1939112
# 3 1 0.2446457 0.1973034 0.1973034 12.23228 50 4.305871     1     1   0.1973034
# 4 1 0.2488454 0.2006904 0.2006904 12.44227 50 4.308806     1     1   0.2006904
# 5 1 0.2530259 0.2040619 0.2040619 12.65129 50 4.311742     1     1   0.2040619
# 6 1 0.2571977 0.2074264 0.2074264 12.85989 50 4.314677     1     1   0.2074264
#   flipped_aes width xmin xmax     ymax weight colour  fill size alpha linetype
# 1       FALSE   0.9 0.55 1.45 4.300000      1 grey20 white  0.5    NA    solid
# 2       FALSE   0.9 0.55 1.45 4.302935      1 grey20 white  0.5    NA    solid
# 3       FALSE   0.9 0.55 1.45 4.305871      1 grey20 white  0.5    NA    solid
# 4       FALSE   0.9 0.55 1.45 4.308806      1 grey20 white  0.5    NA    solid
# 5       FALSE   0.9 0.55 1.45 4.311742      1 grey20 white  0.5    NA    solid
# 6       FALSE   0.9 0.55 1.45 4.314677      1 grey20 white  0.5    NA    solid

layer_scales(p)

layer_grob(p)
# $`1`
# gTree[geom_violin.gTree.****]
#
引数kernel
バイオリンプロットは、離散データxの値ごとに、y方向に密度推定を計算しているのと同じなので、stat_density()と同じカーネルが使えます。
デフォルトはkernel = "gaussian"(ガウシアンカーネル)です。
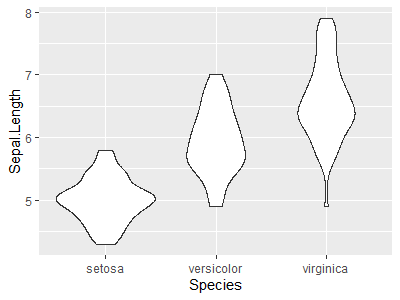
ggplot(data = iris, aes(x = Species, y = Sepal.Length)) +
  stat_ydensity()
ggplot(data = iris, aes(x = Species, y = Sepal.Length)) +
  stat_ydensity(kernel = "gaussian")
引数draw_quantiles
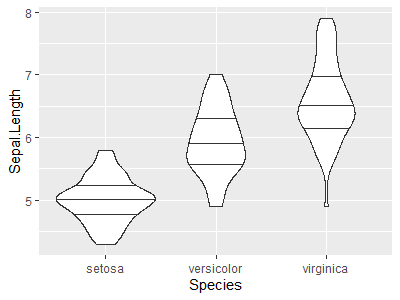
draw_quantiles = c(0.25, 0.5, 0.75)とすると、四分位数に線を引きます。
ggplot(data = iris, aes(x = Species, y = Sepal.Length)) +
  stat_ydensity(draw_quantiles = c(0.25, 0.5, 0.75))
引数scale
描かれる各バイオリンの幅のスケーリングを指定できます。
-
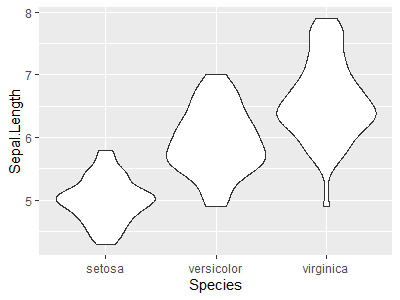
scale = "area":各バイオリンの面積を同じに(デフォルト) -
scale = "count":各バイオリンの面積を観測数に比例した面積に -
scale = "width":各バイオリンの最大幅を同じに
ggplot(data = iris, aes(x = Species, y = Sepal.Length)) +
  stat_ydensity(geom = "violin")
ggplot(data = iris, aes(x = Species, y = Sepal.Length)) +
  stat_ydensity(geom = "violin", scale = "area")
ggplot(data = iris, aes(x = Species, y = Sepal.Length)) +
  geom_violin(stat = "ydensity")
ggplot(data = iris, aes(x = Species, y = Sepal.Length)) +
  geom_violin(stat = "ydensity", scale = "area")

ggplot(data = iris, aes(x = Species, y = Sepal.Length)) +
  stat_ydensity(geom = "violin", scale = "count")
ggplot(data = iris, aes(x = Species, y = Sepal.Length)) +
  geom_violin(stat = "ydensity", scale = "count")

ggplot(data = iris, aes(x = Species, y = Sepal.Length)) +
  stat_ydensity(geom = "violin", scale = "width")
ggplot(data = iris, aes(x = Species, y = Sepal.Length)) +
  geom_violin(stat = "ydensity", scale = "width")
グラフの色分け
これもcolor軸, fill軸を入れて色分けができます。デフォルトではposition = "dodge"です。
ggplot(data = iris, aes(factor(round(Sepal.Length)), y = Sepal.Width, color = Species)) +
  stat_ydensity(geom = "violin")
ggplot(data = iris, aes(factor(round(Sepal.Length)), y = Sepal.Width, color = Species)) +
  stat_ydensity(geom = "violin", position = "dodge")
ggplot(data = iris, aes(factor(round(Sepal.Length)), y = Sepal.Width, color = Species)) +
  stat_ydensity(geom = "violin", position = position_dodge(preserve = "total"))

ggplot(data = iris, aes(factor(round(Sepal.Length)), y = Sepal.Width,
                        color = Species, fill = Species)) +
  stat_ydensity(geom = "violin", position = "identity", alpha = 1/3)
ggplot(data = iris, aes(factor(round(Sepal.Length)), y = Sepal.Width, color = Species)) +
  stat_ydensity(geom = "violin", position = "dodge")
ggplot(data = iris, aes(factor(round(Sepal.Length)), y = Sepal.Width, color = Species)) +
  stat_ydensity(geom = "violin", position = "dodge", scale = "area")

ggplot(data = iris, aes(factor(round(Sepal.Length)), y = Sepal.Width, color = Species)) +
  stat_ydensity(geom = "violin", position = "dodge", scale = "count")

ggplot(data = iris, aes(factor(round(Sepal.Length)), y = Sepal.Width, color = Species)) +
  stat_ydensity(geom = "violin", position = "dodge", scale = "width")
2変数(x:連続,y:連続)
stat_identity()
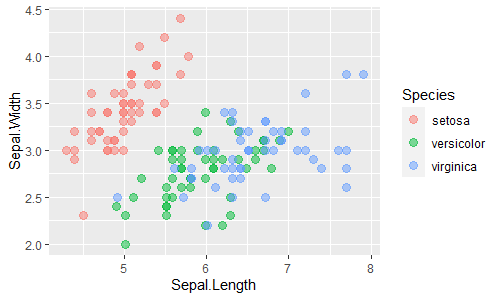
stat_identity()は2次元の値そのまま(何も計算しない)です。デフォルトでgeom = "point"(散布図)で、これはgeom_point(stat = "identity")と同じです。
ggplot(data = iris, aes(x = Sepal.Length, y = Sepal.Width)) +
  stat_identity()
ggplot(data = iris, aes(x = Sepal.Length, y = Sepal.Width)) +
  stat_identity(geom = "point")
ggplot(data = iris, aes(x = Sepal.Length, y = Sepal.Width)) +
  geom_point()
ggplot(data = iris, aes(x = Sepal.Length, y = Sepal.Width)) +
  geom_point(stat = "identity")
geom
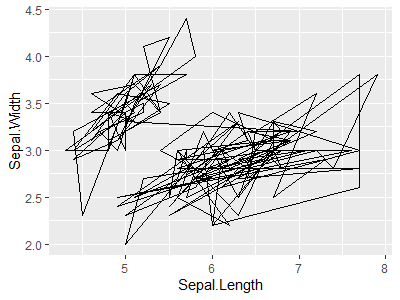
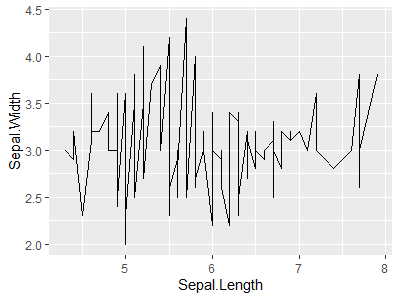
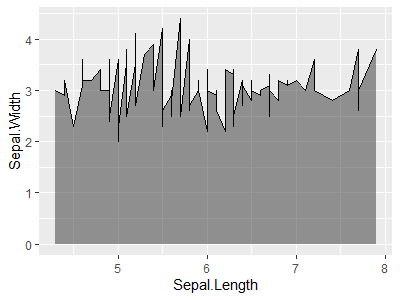
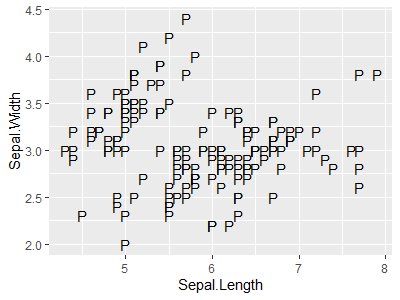
ggplot(data = iris, aes(x = Sepal.Length, y = Sepal.Width)) +
  stat_identity(geom = "path")

ggplot(data = iris, aes(x = Sepal.Length, y = Sepal.Width)) +
  stat_identity(geom = "line")

ggplot(data = iris, aes(x = Sepal.Length, y = Sepal.Width)) +
  stat_identity(geom = "area", alpha = 0.5) +
  stat_identity(geom = "line")

ggplot(data = iris, aes(x = Sepal.Length, y = Sepal.Width)) +
  stat_identity(geom = "step")

ggplot(data = iris, aes(x = Sepal.Length, y = Sepal.Width)) +
  stat_identity(geom = "text", label = "P")

ggplot(data = iris, aes(x = Sepal.Length, y = Sepal.Width)) +
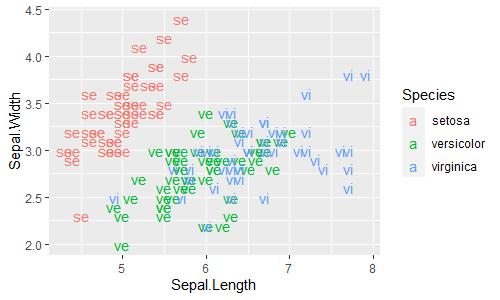
  stat_identity(geom = "text", aes(label = str_sub(Species, 1, 2), color = Species))
内部的に計算されている値を確認しておきます。
p <- ggplot(data = iris, aes(x = Species, y = Sepal.Length)) +
  stat_identity()
ggplot_build(p)

layer_data(p) %>% head()
#   x   y PANEL group shape colour size fill alpha stroke
# 1 1 5.1     1     1    19  black  1.5   NA    NA    0.5
# 2 1 4.9     1     1    19  black  1.5   NA    NA    0.5
# 3 1 4.7     1     1    19  black  1.5   NA    NA    0.5
# 4 1 4.6     1     1    19  black  1.5   NA    NA    0.5
# 5 1 5.0     1     1    19  black  1.5   NA    NA    0.5
# 6 1 5.4     1     1    19  black  1.5   NA    NA    0.5

layer_scales(p)

layer_grob(p)
# $`1`
# points[geom_point.points.****]
#
グラフの色分け
これもcolor軸を入れて色分けができます。デフォルトではposition = "identity"です。
ggplot(data = iris, aes(x = Sepal.Length, y = Sepal.Width, color = Species)) +
  stat_identity(geom = "point", alpha = 1/2, size = 3)
ggplot(data = iris, aes(x = Sepal.Length, y = Sepal.Width, color = Species)) +
  stat_identity(geom = "point", position = "identity", alpha = 1/2, size = 3)
ggplot(data = iris, aes(x = Sepal.Length, y = Sepal.Width, color = Species)) +
  geom_point(stat = "identity", alpha = 1/2, size = 3)
ggplot(data = iris, aes(x = Sepal.Length, y = Sepal.Width, color = Species)) +
  geom_point(stat = "identity", position = "identity", alpha = 1/2, size = 3)

ggplot(data = iris, aes(x = Sepal.Length, y = Sepal.Width, color = Species)) +
  stat_identity(geom = "point", position = position_dodge(width = 0.05),
                alpha = 1/2, size=3)
ggplot(data = iris, aes(x = Sepal.Length, y = Sepal.Width, color = Species)) +
  geom_point(stat = "identity", position = position_dodge(width = 0.05),
             alpha = 1/2, size = 3)

ggplot(data = iris, aes(x = Sepal.Length, y = Sepal.Width, color = Species)) +
  stat_identity(geom = "point",
                position = position_jitter(width = 0.05, height = 0.05, seed = 0),
                alpha = 1/2, size = 3)
ggplot(data = iris, aes(x = Sepal.Length, y = Sepal.Width, color = Species)) +
  geom_point(stat = "identity",
             position = position_jitter(width = 0.05, height = 0.05, seed = 0),
             alpha = 1/2, size = 3)
ggplot(data = iris, aes(x = Sepal.Length, y = Sepal.Width, color = Species)) +
  stat_identity(geom = "text", aes(label = str_sub(Species, 1, 2)))
stat_unique()
stat_unique()は2次元の値そのまま(ただし重複を削除)です。デフォルトでgeom = "point"(散布図)で、これはgeom_point(stat = "unique")と同じです。
ggplot(data = iris, aes(x = Sepal.Length, y = Sepal.Width)) +
  stat_unique()
ggplot(data = iris, aes(x = Sepal.Length, y = Sepal.Width)) +
  stat_unique(geom = "point")
ggplot(data = iris, aes(x = Sepal.Length, y = Sepal.Width)) +
  geom_point(stat = "unique")
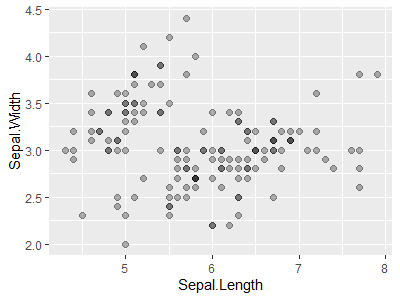
stat_identity()と違って、stat_unique()は重複を削除します。
ggplot(data = iris, aes(x = Sepal.Length, y = Sepal.Width)) +
  stat_identity(geom = "point", alpha = 0.3, size = 2)

ggplot(data = iris, aes(x = Sepal.Length, y = Sepal.Width)) +
  stat_unique(geom = "point", alpha = 0.3, size = 2)
内部的に計算されている値を確認しておきます。
p <- ggplot(data = iris, aes(x = Species, y = Sepal.Length)) +
  stat_unique()
ggplot_build(p)

layer_data(p) %>% head()
#   x   y PANEL group shape colour size fill alpha stroke
# 1 1 5.1     1     1    19  black  1.5   NA    NA    0.5
# 2 1 4.9     1     1    19  black  1.5   NA    NA    0.5
# 3 1 4.7     1     1    19  black  1.5   NA    NA    0.5
# 4 1 4.6     1     1    19  black  1.5   NA    NA    0.5
# 5 1 5.0     1     1    19  black  1.5   NA    NA    0.5
# 6 1 5.4     1     1    19  black  1.5   NA    NA    0.5

layer_scales(p)

layer_grob(p)
# $`1`
# points[geom_point.points.****]
#
グラフの色分け
これもcolor軸を入れて色分けができます。デフォルトではposition = "identity"です。
ggplot(data = iris, aes(x = Sepal.Length, y = Sepal.Width, color = Species)) +
  stat_unique(geom = "point", alpha = 1/2, size = 3)
ggplot(data = iris, aes(x = Sepal.Length, y = Sepal.Width, color = Species)) +
  stat_unique(geom = "point", position = "identity", alpha = 1/2, size = 3)

ggplot(data = iris, aes(x = Sepal.Length, y = Sepal.Width, color = Species)) +
  stat_unique(geom = "point", position = position_dodge(width = 0.05),
              alpha = 1/2, size = 3)

ggplot(data = iris, aes(x = Sepal.Length, y = Sepal.Width, color = Species)) +
  stat_unique(geom = "point",
              position = position_jitter(width = 0.05, height = 0.05, seed = 0),
              alpha = 1/2, size = 3)
stat_bin_2d()
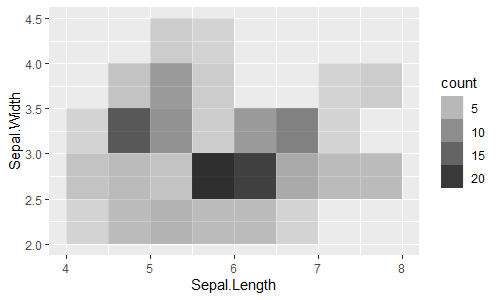
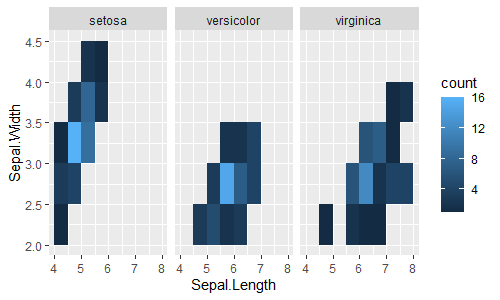
stat_bin_2d()はstat_bin_2d()の2次元版で、2次元の区間分割したタイル(2次元のビン)上でカウント集計します。デフォルトでgeom = "tile"(タイル、ヒートマップ)で、これはgeom_bin2d(stat = "bin2d")と同じです。
1次元のstat_bin()がgeom_bar(stat = "bin")と同じだったように、stat_bin_2d()はタイルのグラフなのでgeom_tile(stat = "bin2d")とも同じです。
ggplot(data = iris, aes(x = Sepal.Length, y = Sepal.Width)) +
  stat_bin_2d(binwidth = 0.5)
ggplot(data = iris, aes(x = Sepal.Length, y = Sepal.Width)) +
  stat_bin_2d(binwidth = 0.5, geom = "tile")
ggplot(data = iris, aes(x = Sepal.Length, y = Sepal.Width)) +
  geom_bin2d(binwidth = 0.5)
ggplot(data = iris, aes(x = Sepal.Length, y = Sepal.Width)) +
  geom_bin2d(stat = "bin2d", binwidth = 0.5)
ggplot(data = iris, aes(x = Sepal.Length, y = Sepal.Width)) +
  geom_tile(stat = "bin2d", binwidth = 0.5)
geom
ggplot(data = iris, aes(x = Sepal.Length, y = Sepal.Width)) +
  stat_bin_2d(binwidth = 0.5, geom = "point", aes(color = ..count..), size = 3)

ggplot(data = iris, aes(x = Sepal.Length, y = Sepal.Width)) +
  stat_bin_2d(binwidth = 0.5, geom = "point", aes(color = ..count.., size = ..count..))
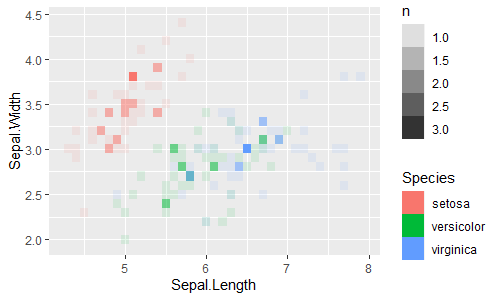
ヒートマップを色ではなく透明度で描くこともできます。2021/07/04追記
ggplot(data = iris, aes(x = Sepal.Length, y = Sepal.Width)) +
  stat_bin_2d(binwidth = 0.5, aes(alpha = ..count..), fill = "black") +
  scale_alpha_continuous(range = c(0.1, 0.8))
ggplot(data = iris, aes(x = Sepal.Length, y = Sepal.Width)) +
  stat_bin_2d(binwidth = 0.5, geom = "tile", aes(alpha = ..count..), fill = "black") +
  scale_alpha_continuous(range = c(0.1, 0.8))
ggplot(data = iris, aes(x = Sepal.Length, y = Sepal.Width)) +
  geom_bin2d(stat = "bin2d", binwidth = 0.5, aes(alpha = ..count..), fill = "black") +
  scale_alpha_continuous(range = c(0.1, 0.8))
ggplot(data = iris, aes(x = Sepal.Length, y = Sepal.Width)) +
  geom_tile(stat = "bin2d", binwidth = 0.5, aes(alpha = ..count..), fill = "black") +
  scale_alpha_continuous(range = c(0.1, 0.8))
..count..等
1次元のstat_bin()と同様に、..count.., ..density.., ..ncount.., ..ndensity..があります。
-
..count..:2次元のビン(タイル)ごとのカウント数 -
..density..:確率密度(=..count.. / ビン幅 / sum(..count..)) -
..ncount..:..count..の正規化(=..count.. / max(..count..)) -
..ndensity..:..density..の正規化(=..density.. / max(..density..))
ggplot(data = iris, aes(x = Sepal.Length, y = Sepal.Width)) +
  stat_bin_2d(binwidth = 0.5)
ggplot(data = iris, aes(x = Sepal.Length, y = Sepal.Width)) +
  stat_bin_2d(binwidth = 0.5, aes(fill = ..count..))

ggplot(data = iris, aes(x = Sepal.Length, y = Sepal.Width)) +
  stat_bin_2d(binwidth = 0.5, aes(fill = ..density..))

ggplot(data = iris, aes(x = Sepal.Length, y = Sepal.Width)) +
  stat_bin_2d(binwidth = 0.5, aes(fill = ..ncount..))

ggplot(data = iris, aes(x = Sepal.Length, y = Sepal.Width)) +
  stat_bin_2d(binwidth = 0.5, aes(fill = ..ndensity..))
グラフの形状としては長方形なのでもgeom = "rect"としても同じものが描けます。
ggplot(data = iris, aes(x = Sepal.Length, y = Sepal.Width)) +
  stat_bin_2d(binwidth = 0.5, geom = "rect",
              aes(xmin = ..x.. - 0.25, xmax = ..x.. + 0.25,
                  ymin = ..y.. - 0.25, ymax = ..y.. + 0.25, fill = ..count..))

ggplot(data = iris, aes(x = Sepal.Length, y = Sepal.Width)) +
  stat_bin_2d(binwidth = 0.5, geom = "rect",
              aes(xmin = ..x.. - 0.25, xmax = ..x.. + 0.25,
                  ymin = ..y.. - 0.25, ymax = ..y.. + 0.25, fill = ..density..))
ggplot(data = iris, aes(x = Sepal.Length, y = Sepal.Width)) +
  stat_bin_2d(binwidth = 0.5, geom = "tile", aes(fill = ..count..)) +
  stat_bin_2d(binwidth = 0.5, geom = "text", aes(label = ..count..), color = "white")
内部的に計算されている値を確認しておきます。
p <- ggplot(data = iris, aes(x = Sepal.Length, y = Sepal.Width)) +
  stat_bin_2d(binwidth = 0.5)
ggplot_build(p)

layer_data(p) %>% head()
#      fill xbin ybin value    x    y count     ncount     density   ndensity PANEL
# 1 #132B43    1    1     1 4.25 2.25     1 0.04761905 0.006666667 0.04761905     1
# 2 #1C3D5B    2    1     4 4.75 2.25     4 0.19047619 0.026666667 0.19047619     1
# 3 #1F4364    3    1     5 5.25 2.25     5 0.23809524 0.033333333 0.23809524     1
# 4 #1C3D5B    4    1     4 5.75 2.25     4 0.19047619 0.026666667 0.19047619     1
# 5 #1C3D5B    5    1     4 6.25 2.25     4 0.19047619 0.026666667 0.19047619     1
# 6 #132B43    6    1     1 6.75 2.25     1 0.04761905 0.006666667 0.04761905     1
#   group xmin xmax ymin ymax colour size linetype alpha width height
# 1    -1  4.0  4.5    2  2.5     NA  0.1        1    NA    NA     NA
# 2    -1  4.5  5.0    2  2.5     NA  0.1        1    NA    NA     NA
# 3    -1  5.0  5.5    2  2.5     NA  0.1        1    NA    NA     NA
# 4    -1  5.5  6.0    2  2.5     NA  0.1        1    NA    NA     NA
# 5    -1  6.0  6.5    2  2.5     NA  0.1        1    NA    NA     NA
# 6    -1  6.5  7.0    2  2.5     NA  0.1        1    NA    NA     NA

layer_scales(p)
# $x
# <ScaleContinuousPosition>
#  Range:     4 --    8
#  Limits:    4 --    8
#
# $y
# <ScaleContinuousPosition>
#  Range:     2 --  4.5
#  Limits:    2 --  4.5
#

layer_grob(p)
# $`1`
# rect[geom_rect.rect.****]
#
グラフの色分け
この場合も、色分けするよりファセット(facet)するのが便利です。
ggplot(data = iris, aes(x = Sepal.Length, y = Sepal.Width)) +
  stat_bin_2d(binwidth = 0.5, geom = "tile") +
  facet_grid(cols = vars(Species))
ggplot(data = iris, aes(x = Sepal.Length, y = Sepal.Width)) +
  geom_tile(stat = "bin2d", binwidth = 0.5) +
  facet_grid(cols = vars(Species))
ヒートマップ表示でも、色ではなく透明度で値の違いを表現するようにすれば、別の色の軸を入れることができます。2021/07/04追記
ggplot(data = iris, aes(x = Sepal.Length, y = Sepal.Width, fill = Species)) +
  stat_bin_2d(binwidth = 0.5, geom = "tile", aes(alpha = ..count..))
ggplot(data = iris, aes(x = Sepal.Length, y = Sepal.Width, fill = Species)) +
  geom_bin2d(stat = "bin2d", binwidth = 0.5, aes(alpha = ..count..))
ggplot(data = iris, aes(x = Sepal.Length, y = Sepal.Width, fill = Species)) +
  geom_tile(stat = "bin2d", binwidth = 0.5, aes(alpha = ..count..))

ggplot(data = iris, aes(x = Sepal.Length, y = Sepal.Width, fill = Species)) +
  stat_bin_2d(binwidth = 0.5, geom = "tile", aes(alpha = ..count..)) +
  scale_alpha_continuous(range = c(0.1, 0.8)) +
  stat_identity(geom = "point", aes(color = Species))
ggplot(data = iris, aes(x = Sepal.Length, y = Sepal.Width, fill = Species)) +
  geom_bin2d(stat = "bin2d", binwidth = 0.5, aes(alpha = ..count..)) +
  scale_alpha_continuous(range = c(0.1, 0.8)) +
  geom_point(aes(color = Species))
ggplot(data = iris, aes(x = Sepal.Length, y = Sepal.Width, fill = Species)) +
  geom_tile(stat = "bin2d", binwidth = 0.5, aes(alpha = ..count..)) +
  scale_alpha_continuous(range = c(0.1, 0.8)) +
  geom_point(aes(color = Species))
stat_bin_hex()
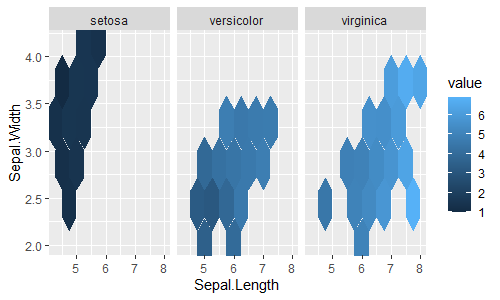
stat_bin_hex()は、stat_bin_2d()の六角形版で、六角形のタイル上でカウント集計します。デフォルトでgeom = "hex"(六角形のタイル貼り)で、これはgeom_hex(stat = "binhex")と同じです。
ggplot(data = iris, aes(x = Sepal.Length, y = Sepal.Width)) +
  stat_bin_hex(binwidth = 0.5)
ggplot(data = iris, aes(x = Sepal.Length, y = Sepal.Width)) +
  stat_bin_hex(binwidth = 0.5, geom = "hex")
ggplot(data = iris, aes(x = Sepal.Length, y = Sepal.Width)) +
  geom_hex(binwidth = 0.5)
ggplot(data = iris, aes(x = Sepal.Length, y = Sepal.Width)) +
  geom_hex(stat = "binhex", binwidth = 0.5)
ヒートマップを色ではなく透明度で描くこともできます。2021/07/04追記
ggplot(data = iris, aes(x = Sepal.Length, y = Sepal.Width)) +
  stat_bin_hex(binwidth = 0.5, aes(alpha = ..count..), fill = "black") +
  scale_alpha_continuous(range = c(0.1, 0.8))
ggplot(data = iris, aes(x = Sepal.Length, y = Sepal.Width)) +
  stat_bin_hex(binwidth = 0.5, geom = "hex", aes(alpha = ..count..), fill = "black") +
  scale_alpha_continuous(range = c(0.1, 0.8))
ggplot(data = iris, aes(x = Sepal.Length, y = Sepal.Width)) +
  geom_hex(binwidth = 0.5, aes(alpha = ..count..), fill = "black") +
  scale_alpha_continuous(range = c(0.1, 0.8))
ggplot(data = iris, aes(x = Sepal.Length, y = Sepal.Width)) +
  geom_hex(stat = "binhex", binwidth = 0.5, aes(alpha = ..count..), fill = "black") +
  scale_alpha_continuous(range = c(0.1, 0.8))
..count..等
-
..count..:六角形のタイルごとのカウント数 -
..density..:確率密度(=..count.. / ビン幅 / sum(..count..)) -
..ncount..:..count..の正規化(=..count.. / max(..count..)) -
..ndensity..:..density..の正規化(=..density.. / max(..density..))
ggplot(data = iris, aes(x = Sepal.Length, y = Sepal.Width)) +
  stat_bin_hex(binwidth = 0.5)
ggplot(data = iris, aes(x = Sepal.Length, y = Sepal.Width)) +
  stat_bin_hex(binwidth = 0.5, aes(fill = ..count..))

ggplot(data = iris, aes(x = Sepal.Length, y = Sepal.Width)) +
  stat_bin_hex(binwidth = 0.5, aes(fill = ..density..))

ggplot(data = iris, aes(x = Sepal.Length, y = Sepal.Width)) +
  stat_bin_hex(binwidth = 0.5, aes(fill = ..ncount..))

ggplot(data = iris, aes(x = Sepal.Length, y = Sepal.Width)) +
  stat_bin_hex(binwidth = 0.5, aes(fill = ..ndensity..))
ggplot(data = iris, aes(x = Sepal.Length, y = Sepal.Width)) +
  stat_bin_hex(binwidth = 0.5, geom = "hex", aes(fill = ..count..)) +
  stat_bin_hex(binwidth = 0.5, geom = "text", aes(label = ..count..), color = "white")
内部的に計算されている値を確認しておきます。
p <- ggplot(data = iris, aes(x = Sepal.Length, y = Sepal.Width)) +
  stat_bin_hex(binwidth = 0.5)
ggplot_build(p)

layer_data(p) %>% head()
#      fill        x        y     density   ndensity count     ncount PANEL group colour size linetype alpha
# 1 #132B43 4.999999 1.999999 0.006666667 0.05882353     1 0.05882353     1    -1     NA  0.5        1    NA
# 2 #17324D 5.999999 1.999999 0.013333333 0.11764706     2 0.11764706     1    -1     NA  0.5        1    NA
# 3 #1B3A57 4.749999 2.433012 0.020000000 0.17647059     3 0.17647059     1    -1     NA  0.5        1    NA
# 4 #17324D 5.249999 2.433012 0.013333333 0.11764706     2 0.11764706     1    -1     NA  0.5        1    NA
# 5 #2F628D 5.749999 2.433012 0.053333333 0.47058824     8 0.47058824     1    -1     NA  0.5        1    NA
# 6 #22496C 6.249999 2.433012 0.033333333 0.29411765     5 0.29411765     1    -1     NA  0.5        1    NA

layer_scales(p)
# $x
# <ScaleContinuousPosition>
#  Range:  4.25 --    8
#  Limits: 4.25 --    8
#
# $y
# <ScaleContinuousPosition>
#  Range:     2 -- 4.17
#  Limits:    2 -- 4.17
#

layer_grob(p)
# $`1`
# gTree[geom_hex.gTree.****]
#
グラフの色分け
この場合も、色分けするよりファセット(facet)するのが便利です。
ggplot(data = iris, aes(x = Sepal.Length, y = Sepal.Width)) +
  stat_bin_hex(binwidth = 0.5, geom = "hex") +
  facet_grid(cols = vars(Species))
ggplot(data = iris, aes(x = Sepal.Length, y = Sepal.Width)) +
  geom_hex(stat = "binhex", binwidth = 0.5) +
  facet_grid(cols = vars(Species))
ヒートマップ表示でも、色ではなく透明度で値の違いを表現するようにすれば、別の色の軸を入れることができます。2021/07/04追記
ggplot(data = iris, aes(x = Sepal.Length, y = Sepal.Width, fill = Species)) +
  stat_bin_hex(binwidth = 0.5, geom = "hex", aes(alpha = ..count..))
ggplot(data = iris, aes(x = Sepal.Length, y = Sepal.Width, fill = Species)) +
  geom_hex(stat = "binhex", binwidth = 0.5, aes(alpha = ..count..))

ggplot(data = iris, aes(x = Sepal.Length, y = Sepal.Width, fill = Species)) +
  stat_bin_hex(binwidth = 0.5, geom = "hex", aes(alpha = ..count..)) +
  scale_alpha_continuous(range = c(0.1, 0.8)) +
  stat_identity(geom = "point", aes(color = Species))
ggplot(data = iris, aes(x = Sepal.Length, y = Sepal.Width, fill = Species)) +
  geom_hex(stat = "binhex", binwidth = 0.5, aes(alpha = ..count..)) +
  scale_alpha_continuous(range = c(0.1, 0.8)) +
  geom_point(aes(color = Species))
stat_density_2d()
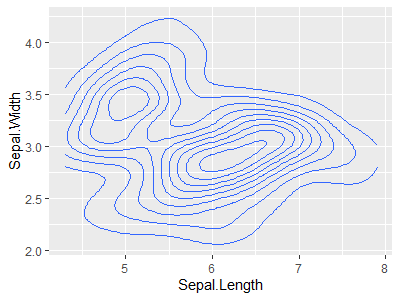
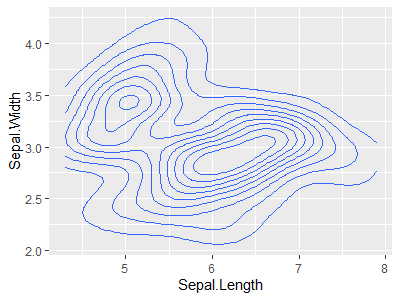
stat_density_2d()は1次元のstat_density()の2次元版で、2次元の密度推定を計算します。デフォルトでgeom = "density_2d"(2次元の密度の等高線プロット)で、これはgeom_area(stat = "density")と同じです。
グラフの形状としては等高線プロットなのでgeom = "contour"(等高線プロット)としても同じです。
ggplot(data = iris, aes(x = Sepal.Length, y = Sepal.Width)) +
  stat_density_2d()
ggplot(data = iris, aes(x = Sepal.Length, y = Sepal.Width)) +
  stat_density_2d(geom = "density_2d")
ggplot(data = iris, aes(x = Sepal.Length, y = Sepal.Width)) +
  geom_density_2d()
ggplot(data = iris, aes(x = Sepal.Length, y = Sepal.Width)) +
  geom_density_2d(stat = "density_2d")
ggplot(data = iris, aes(x = Sepal.Length, y = Sepal.Width)) +
  stat_density_2d(geom = "contour")
ggplot(data = iris, aes(x = Sepal.Length, y = Sepal.Width)) +
  stat_density_2d(geom = "contour", contour = TRUE)
ggplot(data = iris, aes(x = Sepal.Length, y = Sepal.Width)) +
  geom_contour(stat = "density_2d", contour = TRUE)
geom
ggplot(data = iris, aes(x = Sepal.Length, y = Sepal.Width)) +
  stat_density_2d(geom = "path")

ggplot(data = iris, aes(x = Sepal.Length, y = Sepal.Width)) +
  stat_density_2d(geom = "polygon", alpha = 0.2)
引数n
等高線を描く際の点の取り方の緻密さを指定できます。デフォルトはn = 100です。
ggplot(data = iris, aes(x = Sepal.Length, y = Sepal.Width)) +
  stat_density_2d(geom = "density_2d", n = 5) +
  stat_density_2d(geom = "point", n = 5)

ggplot(data = iris, aes(x = Sepal.Length, y = Sepal.Width)) +
  stat_density_2d(geom = "density_2d", n = 10) +
  stat_density_2d(geom = "point", n = 10)

ggplot(data = iris, aes(x = Sepal.Length, y = Sepal.Width)) +
  stat_density_2d(geom = "density_2d", n = 50) +
  stat_density_2d(geom = "point", n = 50, size = 1)
引数contour_var
等高線を引く対象を指定します。デフォルトは"density"です。
ggplot(data = iris, aes(x = Sepal.Length, y = Sepal.Width)) +
  geom_density_2d()
ggplot(data = iris, aes(x = Sepal.Length, y = Sepal.Width)) +
  geom_density_2d(contour_var = "density")

ggplot(data = iris, aes(x = Sepal.Length, y = Sepal.Width)) +
  geom_density_2d(contour_var = "count")

ggplot(data = iris, aes(x = Sepal.Length, y = Sepal.Width)) +
  geom_density_2d(contour_var = "ndensity")
違いが分かりにくいですが、次の..level..のカラー軸を表示してみると違いが分かります。..level..はcontour_varに指定したもののレベルになります。
ggplot(data = iris, aes(x = Sepal.Length, y = Sepal.Width)) +
  stat_density_2d(contour_var = "density", aes(color = ..level..))

ggplot(data = iris, aes(x = Sepal.Length, y = Sepal.Width)) +
  stat_density_2d(contour_var = "count", aes(color = ..level..))

ggplot(data = iris, aes(x = Sepal.Length, y = Sepal.Width)) +
  stat_density_2d(contour_var = "ndensity", aes(color = ..level..))
..level..
-
..level..:contour_varに指定したもののレベル(等高線の高さの水準)
ggplot(data = iris, aes(x = Sepal.Length, y = Sepal.Width)) +
  stat_density_2d(geom = "density_2d", aes(color = ..level..))
ggplot(data = iris, aes(x = Sepal.Length, y = Sepal.Width)) +
  stat_density_2d(geom = "path", aes(color = ..level..))
ggplot(data = iris, aes(x = Sepal.Length, y = Sepal.Width)) +
  stat_density_2d(geom = "contour", aes(color = ..level..))

ggplot(data = iris, aes(x = Sepal.Length, y = Sepal.Width)) +
  stat_density_2d(geom = "polygon", aes(fill = ..level..))
内部的に計算されている値を確認しておきます。
p <- ggplot(data = iris, aes(x = Sepal.Length, y = Sepal.Width)) +
  stat_density_2d()
ggplot_build(p)

layer_data(p) %>% head()
#   level        x        y piece      group    nlevel   n PANEL  colour size linetype alpha
# 1  0.05 7.900000 3.015595     1 -1-002-001 0.1111111 150     1 #3366FF  0.5        1    NA
# 2  0.05 7.898191 3.018182     1 -1-002-001 0.1111111 150     1 #3366FF  0.5        1    NA
# 3  0.05 7.875798 3.042424     1 -1-002-001 0.1111111 150     1 #3366FF  0.5        1    NA
# 4  0.05 7.863636 3.052823     1 -1-002-001 0.1111111 150     1 #3366FF  0.5        1    NA
# 5  0.05 7.847076 3.066667     1 -1-002-001 0.1111111 150     1 #3366FF  0.5        1    NA
# 6  0.05 7.827273 3.080522     1 -1-002-001 0.1111111 150     1 #3366FF  0.5        1    NA

layer_scales(p)
# $x
# <ScaleContinuousPosition>
#  Range:   4.3 --  7.9
#  Limits:  4.3 --  7.9
#
# $y
# <ScaleContinuousPosition>
#  Range:  2.07 -- 4.23
#  Limits: 2.07 -- 4.23
#

layer_grob(p)
# $`1`
# polyline[GRID.polyline.****]
#
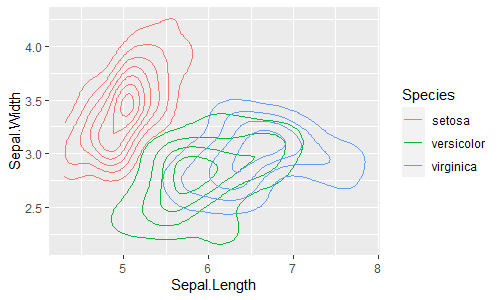
グラフの色分け
これもcolor軸を入れて色分けができます。デフォルトでposition = "identity"です。
ggplot(data = iris, aes(x = Sepal.Length, y = Sepal.Width, color = Species)) +
  stat_density_2d(geom = "path")

ggplot(data = iris, aes(x = Sepal.Length, y = Sepal.Width)) +
  stat_density_2d(geom = "polygon", aes(color = Species, fill = Species), alpha = 0.2)

ggplot(data = iris, aes(x = Sepal.Length, y = Sepal.Width)) +
  stat_density_2d(bins = 20, geom = "polygon", aes(fill = Species), alpha = 1/10)
引数contour = FALSE
デフォルトではcontour = TRUEで、等高線が描かれますが、contour = FALSEとすると、例えば、n = 20なら縦横(x軸方向、y軸方向)それぞれ20区分メッシュの区間における密度の情報になります。
-
density:密度推定された密度 -
ndensity:密度の正規化 -
count:密度推定された密度から推定されるカウント数
ggplot(data = iris, aes(x = Sepal.Length, y = Sepal.Width)) +
  stat_density_2d(contour = FALSE, n = 20)

ggplot(data = iris, aes(x = Sepal.Length, y = Sepal.Width)) +
  stat_density_2d(contour = FALSE, n = 20, geom = "point", aes(size = ..density..))

ggplot(data = iris, aes(x = Sepal.Length, y = Sepal.Width)) +
  stat_density_2d(contour = FALSE, n = 20, geom = "point", aes(alpha = ..density..), size = 3)

ggplot(data = iris, aes(x = Sepal.Length, y = Sepal.Width)) +
  stat_density_2d(contour = FALSE, n = 20, geom = "point", aes(color = ..density..), size = 3)

ggplot(data = iris, aes(x = Sepal.Length, y = Sepal.Width)) +
  stat_density_2d(contour = FALSE, n = 20, geom = "tile", aes(alpha = ..density..))

ggplot(data = iris, aes(x = Sepal.Length, y = Sepal.Width)) +
  stat_density_2d(contour = FALSE, n = 20, geom = "tile", aes(fill = ..density..))

ggplot(data = iris, aes(x = Sepal.Length, y = Sepal.Width)) +
  stat_density_2d(contour = FALSE, n = 20, geom = "raster", aes(fill = ..density..))
stat_density_2d(contour = FALSE, geom = "tile")はgeom_tile(stat = "density_2d")と同じです。2021/07/04追記
ggplot(data = iris, aes(x = Sepal.Length, y = Sepal.Width)) +
  stat_density_2d(contour = FALSE, geom = "tile", aes(fill = ..density..))
ggplot(data = iris, aes(x = Sepal.Length, y = Sepal.Width)) +
  geom_tile(stat = "density_2d", aes(fill = ..density..))
ggplot(data = iris, aes(x = Sepal.Length, y = Sepal.Width)) +
  geom_tile(stat = "density_2d", contour = FALSE, aes(fill = ..density..))

ggplot(data = iris, aes(x = Sepal.Length, y = Sepal.Width)) +
  stat_density_2d(contour = FALSE, geom = "tile", aes(alpha = ..density..))
ggplot(data = iris, aes(x = Sepal.Length, y = Sepal.Width)) +
  geom_tile(stat = "density_2d", aes(alpha = ..density..))
ggplot(data = iris, aes(x = Sepal.Length, y = Sepal.Width)) +
  geom_tile(stat = "density_2d", contour = FALSE, aes(alpha = ..density..))
内部的に計算されている値を確認しておきます。
p <- ggplot(data = iris, aes(x = Sepal.Length, y = Sepal.Width)) +
  stat_density_2d(contour = FALSE, n = 8, geom = "tile", aes(fill = ..density..))
ggplot_build(p)

layer_data(p) %>% head()
#          x y    density group    ndensity     count   n level piece PANEL  colour size linetype alpha
# 1 4.300000 2 0.00471535    -1 0.009855004 0.7073024 150     1     1     1 #3366FF  0.5        1    NA
# 2 4.489474 2 0.01020173    -1 0.021321442 1.5302590 150     1     1     1 #3366FF  0.5        1    NA
# 3 4.678947 2 0.01836657    -1 0.038385823 2.7549849 150     1     1     1 #3366FF  0.5        1    NA
# 4 4.868421 2 0.02594039    -1 0.054214995 3.8910587 150     1     1     1 #3366FF  0.5        1    NA
# 5 5.057895 2 0.02787737    -1 0.058263249 4.1816056 150     1     1     1 #3366FF  0.5        1    NA
# 6 5.247368 2 0.02354638    -1 0.049211548 3.5319569 150     1     1     1 #3366FF  0.5        1    NA

layer_scales(p)
# $x
# <ScaleContinuousPosition>
#  Range:   4.3 --  7.9
#  Limits:  4.3 --  7.9
#
# $y
# <ScaleContinuousPosition>
#  Range:     2 --  4.4
#  Limits:    2 --  4.4
#

layer_grob(p)
# $`1`
# polyline[GRID.polyline.****]
#
グラフの色分け
これもcolor軸を入れて色分けができます。デフォルトでposition = "identity"です。
ggplot(data = iris, aes(x = Sepal.Length, y = Sepal.Width, color = Species)) +
  stat_density_2d(contour = FALSE, n = 20, geom = "point", aes(size = ..density..),
                  position = "identity", alpha = 1/2)

ggplot(data = iris, aes(x = Sepal.Length, y = Sepal.Width, color = Species)) +
  stat_density_2d(contour = FALSE, n = 20, geom = "point", aes(size = ..density..),
                  position = position_dodge(width = 0.05), alpha = 1/2)
この場合も、ファセット(facet)するのが便利です。
ggplot(data = iris, aes(x = Sepal.Length, y = Sepal.Width)) +
  stat_density_2d(contour = FALSE, n = 20,
                  geom = "point", aes(color = ..density..), size = 3) +
  facet_grid(cols = vars(Species))

ggplot(data = iris, aes(x = Sepal.Length, y = Sepal.Width)) +
  stat_density_2d(contour = FALSE, n = 20, geom = "tile", aes(fill = ..density..)) +
  facet_grid(cols = vars(Species))
ヒートマップ表示でも、色ではなく透明度で値の違いを表現するようにすれば、別の色の軸を入れることができます。2021/07/04追記
ggplot(data = iris, aes(x = Sepal.Length, y = Sepal.Width, fill = Species)) +
  stat_density_2d(contour = FALSE, geom = "tile", aes(alpha = ..density..))
ggplot(data = iris, aes(x = Sepal.Length, y = Sepal.Width, fill = Species)) +
  geom_tile(stat = "density_2d", aes(alpha = ..density..))

ggplot(data = iris, aes(x = Sepal.Length, y = Sepal.Width, fill = Species)) +
  stat_density_2d(contour = FALSE, geom = "tile", aes(alpha = ..density..)) +
  scale_alpha_continuous(range = c(0, 0.8))
ggplot(data = iris, aes(x = Sepal.Length, y = Sepal.Width, fill = Species)) +
  geom_tile(stat = "density_2d", aes(alpha = ..density..)) +
  scale_alpha_continuous(range = c(0, 0.8))
# density=0の位置を無色(alpha=0)とするためrangeを指定

ggplot(data = iris, aes(x = Sepal.Length, y = Sepal.Width, fill = Species)) +
  stat_density_2d(contour = FALSE, geom = "tile", aes(alpha = ..density..)) +
  scale_alpha_continuous(range = c(0, 0.8)) +
  stat_identity(geom = "point", aes(color = Species), show.legend = FALSE) + guides(color = "none")
ggplot(data = iris, aes(x = Sepal.Length, y = Sepal.Width, fill = Species)) +
  geom_tile(stat = "density_2d", aes(alpha = ..density..)) +
  scale_alpha_continuous(range = c(0, 0.8)) +
  geom_point(aes(color = Species), show.legend = FALSE) + guides(color = "none")
contour = TRUEとcontour = FALSEを両方重ねて描いておきます。
ggplot(data = iris, aes(x = Sepal.Length, y = Sepal.Width)) +
  stat_density_2d(contour = FALSE, geom = "raster", aes(fill = ..density..), alpha = 0.8) +
  stat_density_2d(contour = TRUE, geom = "density_2d", aes(color = ..level..))
ggplot(data = iris, aes(x = Sepal.Length, y = Sepal.Width)) +
  stat_density_2d(contour = FALSE, geom = "raster", aes(fill = ..density..), alpha = 0.8) +
  stat_density_2d(contour = TRUE, geom = "contour", aes(color = ..level..))
ggplot(data = iris, aes(x = Sepal.Length, y = Sepal.Width)) +
  geom_raster(stat = "density_2d", contour = FALSE, aes(fill = ..density..), alpha = 0.8) +
  geom_contour(stat = "density_2d", contour = TRUE, aes(color = ..level..))
ggplot(data = iris, aes(x = Sepal.Length, y = Sepal.Width)) +
  geom_raster(stat = "density_2d", contour = FALSE, aes(fill = ..density..), alpha = 0.8) +
  geom_path(stat = "density_2d", contour = TRUE, aes(color = ..level..))
stat_density2d_filled()
stat_density2d_filled()はstat_density2d()の等高線の間を塗りつぶした版です。デフォルトでgeom = "density_2d_filled"(2次元の密度の等高線プロットの塗りつぶし)で、これはgeom_density_2d_filled(stat = "density_2d_filled")と同じです。
ggplot(data = iris, aes(x = Sepal.Length, y = Sepal.Width)) +
  stat_density2d_filled()
ggplot(data = iris, aes(x = Sepal.Length, y = Sepal.Width)) +
  stat_density2d_filled(geom = "density_2d_filled")
ggplot(data = iris, aes(x = Sepal.Length, y = Sepal.Width)) +
  geom_density_2d_filled()
ggplot(data = iris, aes(x = Sepal.Length, y = Sepal.Width)) +
  geom_density_2d_filled(stat = "density_2d_filled")
ggplot(data = iris, aes(x = Sepal.Length, y = Sepal.Width)) +
  stat_density_2d_filled(geom = "contour_filled")
内部的に計算されている値を確認しておきます。
p <- ggplot(data = iris, aes(x = Sepal.Length, y = Sepal.Width)) +
  stat_density2d_filled()
ggplot_build(p)

layer_data(p) %>% head()
#        fill        level        x   y piece  group subgroup level_low level_high level_mid nlevel   n PANEL colour size linetype alpha
# 1 #440154FF (0.00, 0.05] 7.900000 4.4     1 -1-001        1         0       0.05     0.025    0.1 150     1     NA  0.5        1    NA
# 2 #440154FF (0.00, 0.05] 7.863636 4.4     1 -1-001        1         0       0.05     0.025    0.1 150     1     NA  0.5        1    NA
# 3 #440154FF (0.00, 0.05] 7.827273 4.4     1 -1-001        1         0       0.05     0.025    0.1 150     1     NA  0.5        1    NA
# 4 #440154FF (0.00, 0.05] 7.790909 4.4     1 -1-001        1         0       0.05     0.025    0.1 150     1     NA  0.5        1    NA
# 5 #440154FF (0.00, 0.05] 7.754545 4.4     1 -1-001        1         0       0.05     0.025    0.1 150     1     NA  0.5        1    NA
# 6 #440154FF (0.00, 0.05] 7.718182 4.4     1 -1-001        1         0       0.05     0.025    0.1 150     1     NA  0.5        1    NA

layer_scales(p)
# $x
# <ScaleContinuousPosition>
#  Range:   4.3 --  7.9
#  Limits:  4.3 --  7.9
#
# $y
# <ScaleContinuousPosition>
#  Range:     2 --  4.4
#  Limits:    2 --  4.4
#

layer_grob(p)
# $`1`
# pathgrob[geom_polygon.pathgrob.****]
#
引数contour_var
ggplot(data = iris, aes(x = Sepal.Length, y = Sepal.Width)) +
  stat_density2d_filled(geom = "density_2d_filled")
ggplot(data = iris, aes(x = Sepal.Length, y = Sepal.Width)) +
  stat_density2d_filled(geom = "density_2d_filled", contour_var = "density")
ggplot(data = iris, aes(x = Sepal.Length, y = Sepal.Width)) +
  geom_density_2d_filled(stat = "density_2d_filled")
ggplot(data = iris, aes(x = Sepal.Length, y = Sepal.Width)) +
  geom_density_2d_filled(stat = "density_2d_filled", contour_var = "density")

ggplot(data = iris, aes(x = Sepal.Length, y = Sepal.Width)) +
  stat_density2d_filled(geom = "density_2d_filled", contour_var = "count")
ggplot(data = iris, aes(x = Sepal.Length, y = Sepal.Width)) +
  geom_density_2d_filled(stat = "density_2d_filled", contour_var = "count")

ggplot(data = iris, aes(x = Sepal.Length, y = Sepal.Width)) +
  stat_density2d_filled(geom = "density_2d_filled", contour_var = "ndensity")
ggplot(data = iris, aes(x = Sepal.Length, y = Sepal.Width)) +
  geom_density_2d_filled(stat = "density_2d_filled", contour_var = "ndensity")
グラフの色分け
stat_density2d_filled()はstat_density2d()の等高線の間を色分けするものなので、Species軸を分けたい場合は色分けする代わりにファセット(facet)するのが便利です。
ggplot(data = iris, aes(x = Sepal.Length, y = Sepal.Width)) +
  stat_density2d_filled(geom = "density_2d_filled", contour_var = "density") +
  facet_grid(cols = vars(Species))
ggplot(data = iris, aes(x = Sepal.Length, y = Sepal.Width)) +
  geom_density_2d_filled(stat = "density_2d_filled", contour_var = "density") +
  facet_grid(cols = vars(Species))

ggplot(data = iris, aes(x = Sepal.Length, y = Sepal.Width)) +
  stat_density2d_filled(geom = "density_2d_filled", contour_var = "count") +
  facet_grid(cols = vars(Species))
ggplot(data = iris, aes(x = Sepal.Length, y = Sepal.Width)) +
  geom_density_2d_filled(stat = "density_2d_filled", contour_var = "count") +
  facet_grid(cols = vars(Species))

ggplot(data = iris, aes(x = Sepal.Length, y = Sepal.Width)) +
  stat_density2d_filled(geom = "density_2d_filled", contour_var = "ndensity") +
  facet_grid(cols = vars(Species))
ggplot(data = iris, aes(x = Sepal.Length, y = Sepal.Width)) +
  geom_density_2d_filled(stat = "density_2d_filled", contour_var = "ndensity") +
  facet_grid(cols = vars(Species))
stat_ellipse()
stat_ellipse()は確率楕円(信頼楕円)を計算します。デフォルトでstat_ellipse(geom = "path")で、これはgeom_path(stat = "ellipse")と同じす。
ggplot(data = iris, aes(x = Sepal.Length, y = Sepal.Width)) +
  geom_point() +
  stat_ellipse(color = "red")
ggplot(data = iris, aes(x = Sepal.Length, y = Sepal.Width)) +
  geom_point() +
  stat_ellipse(geom = "path", color = "red")
ggplot(data = iris, aes(x = Sepal.Length, y = Sepal.Width)) +
  geom_point() +
  geom_path(stat = "ellipse", color = "red")
geom
ggplot(data = iris, aes(x = Sepal.Length, y = Sepal.Width)) +
  geom_point() +
  stat_ellipse(geom = "line", color = "red")

ggplot(data = iris, aes(x = Sepal.Length, y = Sepal.Width)) +
  geom_point() +
  stat_ellipse(geom = "point", color = "red")

ggplot(data = iris, aes(x = Sepal.Length, y = Sepal.Width)) +
  geom_point() +
  stat_ellipse(geom = "polygon", color = "red", fill = "red", alpha = 0.2)
内部的に計算されている値を確認しておきます。
p <- ggplot(data = iris, aes(x = Sepal.Length, y = Sepal.Width)) +
  stat_ellipse()
ggplot_build(p)

layer_data(p) %>% head()
#          x        y PANEL group colour size linetype alpha
# 1 7.721630 2.870889     1    -1  black  0.5        1    NA
# 2 7.707468 2.985016     1    -1  black  0.5        1    NA
# 3 7.665196 3.099898     1    -1  black  0.5        1    NA
# 4 7.595454 3.213794     1    -1  black  0.5        1    NA
# 5 7.499300 3.324978     1    -1  black  0.5        1    NA
# 6 7.378192 3.431765     1    -1  black  0.5        1    NA

layer_scales(p)
# $x
# <ScaleContinuousPosition>
#  Range:  3.99 -- 7.72
#  Limits: 3.99 -- 7.72
#
# $y
# <ScaleContinuousPosition>
#  Range:   2.1 -- 3.97
#  Limits:  2.1 -- 3.97
#

layer_grob(p)
# $`1`
# polyline[GRID.polyline.****]
#
引数segments
ggplot(data = iris, aes(x = Sepal.Length, y = Sepal.Width)) +
  geom_point() +
  stat_ellipse(geom = "path", segments = 5, color = "red")

ggplot(data = iris, aes(x = Sepal.Length, y = Sepal.Width)) +
  geom_point() +
  stat_ellipse(geom = "path", segments = 10, color = "red")

ggplot(data = iris, aes(x = Sepal.Length, y = Sepal.Width)) +
  geom_point() +
  stat_ellipse(geom = "path", segments = 20, color = "red")
引数level
デフォルトではlevel = 0.95で、95%信頼楕円(95%等確率偏差楕円)です。
ggplot(data = iris, aes(x = Sepal.Length, y = Sepal.Width)) +
  geom_point() +
  stat_ellipse()
ggplot(data = iris, aes(x = Sepal.Length, y = Sepal.Width)) +
  geom_point() +
  stat_ellipse(level = 0.95)

ggplot(data = iris, aes(x = Sepal.Length, y = Sepal.Width)) +
  geom_point() +
  stat_ellipse(level = 0.1) +
  stat_ellipse(level = 0.2) +
  stat_ellipse(level = 0.3) +
  stat_ellipse(level = 0.4) +
  stat_ellipse(level = 0.5) +
  stat_ellipse(level = 0.6) +
  stat_ellipse(level = 0.7) +
  stat_ellipse(level = 0.8) +
  stat_ellipse(level = 0.9) +
  stat_ellipse(level = 1.0)
# グラフの外枠は stat_ellipse(level = 1.0) 部分から出力

ggplot(data = iris, aes(x = Sepal.Length, y = Sepal.Width)) +
  geom_point() +
  stat_ellipse(level = 0.1, geom = "polygon", alpha = 0.2) +
  stat_ellipse(level = 0.2, geom = "polygon", alpha = 0.2) +
  stat_ellipse(level = 0.3, geom = "polygon", alpha = 0.2) +
  stat_ellipse(level = 0.4, geom = "polygon", alpha = 0.2) +
  stat_ellipse(level = 0.5, geom = "polygon", alpha = 0.2) +
  stat_ellipse(level = 0.6, geom = "polygon", alpha = 0.2) +
  stat_ellipse(level = 0.7, geom = "polygon", alpha = 0.2) +
  stat_ellipse(level = 0.8, geom = "polygon", alpha = 0.2) +
  stat_ellipse(level = 0.9, geom = "polygon", alpha = 0.2)
引数type
ggplot(data = iris, aes(x = Sepal.Length, y = Sepal.Width)) +
  geom_point() +
  stat_ellipse(type = "t", linetype = 1) +
  stat_ellipse(type = "norm", linetype = 2) +
  stat_ellipse(type = "euclid", linetype = 3)

ggplot(data = iris, aes(x = Sepal.Length, y = Sepal.Width)) +
  geom_point() +
  stat_ellipse(type = "euclid") +
  coord_fixed()
グラフの色分け
これもcolor軸, fill軸を入れて色分けができます。デフォルトでposition = "identity"です。
ggplot(data = iris, aes(x = Sepal.Length, y = Sepal.Width, fill = Species)) +
  geom_point(aes(color = Species)) +
  stat_ellipse(level = 0.1, geom = "polygon", alpha = 0.1) +
  stat_ellipse(level = 0.2, geom = "polygon", alpha = 0.1) +
  stat_ellipse(level = 0.3, geom = "polygon", alpha = 0.1) +
  stat_ellipse(level = 0.4, geom = "polygon", alpha = 0.1) +
  stat_ellipse(level = 0.5, geom = "polygon", alpha = 0.1) +
  stat_ellipse(level = 0.6, geom = "polygon", alpha = 0.1) +
  stat_ellipse(level = 0.7, geom = "polygon", alpha = 0.1) +
  stat_ellipse(level = 0.8, geom = "polygon", alpha = 0.1) +
  stat_ellipse(level = 0.9, geom = "polygon", alpha = 0.1)

ggplot(data = iris, aes(x = Sepal.Length, y = Sepal.Width, color = Species)) +
  geom_point() +
  stat_ellipse(type = "t", linetype = 1) +
  stat_ellipse(type = "norm", linetype = 2) +
  stat_ellipse(type = "euclid", linetype = 3)
ggplot(data = iris, aes(x = Sepal.Length, y = Sepal.Width, color = Petal.Length > 4)) +
  geom_point() +
  stat_ellipse()

ggplot(data = iris, aes(x = Sepal.Length, y = Sepal.Width,
                        color = Petal.Length > 4, fill = Petal.Length > 4)) +
  geom_point() +
  stat_ellipse(geom = "polygon", alpha = 0.3)

ggplot(data = iris, aes(x = Sepal.Length, y = Sepal.Width)) +
  geom_point(aes(color = Species)) +
  stat_ellipse(aes(color = Species)) +
  stat_ellipse()
stat_smooth()
stat_smooth()は平滑化曲線を計算します。デフォルトでgeom = "smooth"(平滑化曲線のプロット)で、これはgeom_smooth(stat = "smooth")と同じです。
ggplot(data = iris, aes(x = Sepal.Length, y = Sepal.Width)) +
  geom_point() +
  stat_smooth()
ggplot(data = iris, aes(x = Sepal.Length, y = Sepal.Width)) +
  geom_point() +
  stat_smooth(geom = "smooth")
ggplot(data = iris, aes(x = Sepal.Length, y = Sepal.Width)) +
  geom_point() +
  geom_smooth()
ggplot(data = iris, aes(x = Sepal.Length, y = Sepal.Width)) +
  geom_point() +
  geom_smooth(stat = "smooth")
geom
ggplot(data = iris, aes(x = Sepal.Length, y = Sepal.Width)) +
  geom_point() +
  stat_smooth(geom = "line")
..se..等
-
..y..:予測値(計算された平滑化曲線のy座標) -
..ymin..:信頼区間の下限 -
..ymax..:信頼区間の上限 -
..se..:標準誤差
ggplot(data = iris, aes(x = Sepal.Length, y = Sepal.Width)) +
  geom_point() +
  stat_smooth(geom = "line") +
  stat_smooth(geom = "ribbon", aes(ymin = ..ymin.., ymax = ..ymax..), alpha = 0.2)
ggplot(data = iris, aes(x = Sepal.Length, y = Sepal.Width)) +
  geom_point() +
  stat_smooth(geom = "line") +
  stat_smooth(geom = "ribbon", aes(ymin = after_stat(ymin),
                                   ymax = after_stat(ymax)), alpha = 0.2)
ggplot(data = iris, aes(x = Sepal.Length, y = Sepal.Width)) +
  geom_point() +
  stat_smooth(geom = "line") +
  stat_smooth(geom = "ribbon", aes(ymin = ..y.. - ..se.. * 1.96,
                                   ymax = ..y.. + ..se.. * 1.96), alpha = 0.2)
ggplot(data = iris, aes(x = Sepal.Length, y = Sepal.Width)) +
  geom_point() +
  stat_smooth(geom = "line") +
  stat_smooth(geom = "ribbon", aes(ymin = after_stat(y - se * 1.96),
                                   ymax = after_stat(y + se * 1.96)), alpha = 0.2)
内部的に計算されている値を確認しておきます。
p <- ggplot(data = iris, aes(x = Sepal.Length, y = Sepal.Width)) +
  stat_smooth()
ggplot_build(p)

layer_data(p) %>% head()
#          x        y     ymin     ymax        se flipped_aes PANEL group  colour   fill size linetype weight alpha
# 1 4.300000 2.866438 2.502397 3.230479 0.1841853       FALSE     1    -1 #3366FF grey60    1        1      1   0.4
# 2 4.345570 2.909308 2.579890 3.238726 0.1666678       FALSE     1    -1 #3366FF grey60    1        1      1   0.4
# 3 4.391139 2.949679 2.652595 3.246763 0.1503085       FALSE     1    -1 #3366FF grey60    1        1      1   0.4
# 4 4.436709 2.987547 2.720418 3.254676 0.1351530       FALSE     1    -1 #3366FF grey60    1        1      1   0.4
# 5 4.482278 3.022906 2.783246 3.262566 0.1212551       FALSE     1    -1 #3366FF grey60    1        1      1   0.4
# 6 4.527848 3.055751 2.840952 3.270551 0.1086769       FALSE     1    -1 #3366FF grey60    1        1      1   0.4

layer_scales(p)
# $x
# <ScaleContinuousPosition>
#  Range:   4.3 --  7.9
#  Limits:  4.3 --  7.9
#
# $y
# <ScaleContinuousPosition>
#  Range:   2.5 -- 3.66
#  Limits:  2.5 -- 3.66
#

layer_grob(p)
# $`1`
# gTree[geom_smooth.gTree.****]
#
引数se
デフォルトではse = TRUEで、信頼区間(confidence interval)が表示されます。se = FALSEとすると表示されなくなります。
ggplot(data = iris, aes(x = Sepal.Length, y = Sepal.Width)) +
  geom_point() +
  stat_smooth(se = FALSE)
引数method
観測値の数が1,000未満の場合は、デフォルトではmethod = loess(局所多項回帰, loess, lowess(locally-weighted scatterplot smoother)(局所重み付き散布図平滑化))になります。
-
method = "loess":局所多項回帰, loess, lowess(locally-weighted scatterplot smoother)(局所重み付き散布図平滑化)) -
method = "lm":線形回帰 -
method = "glm":一般化線形回帰
ggplot(data = iris, aes(x = Sepal.Length, y = Sepal.Width)) +
  geom_point() +
  stat_smooth()
ggplot(data = iris, aes(x = Sepal.Length, y = Sepal.Width)) +
  geom_point() +
  stat_smooth(method = "loess")
ggplot(data = iris, aes(x = Sepal.Length, y = Sepal.Width)) +
  geom_point() +
  stat_smooth(method = "loess", formula = y ~ x)
ggplot(data = iris, aes(x = Sepal.Length, y = Sepal.Width)) +
  geom_point() +
  stat_smooth(method = loess, formula = y ~ x)

ggplot(data = iris, aes(x = Sepal.Length, y = Sepal.Width)) +
  geom_point() +
  stat_smooth(method = "lm")
ggplot(data = iris, aes(x = Sepal.Length, y = Sepal.Width)) +
  geom_point() +
  stat_smooth(method = "lm", formula = y ~ x)
ggplot(data = iris, aes(x = Sepal.Length, y = Sepal.Width)) +
  geom_point() +
  stat_smooth(method = lm, formula = y ~ x)
ggplot(data = iris, aes(x = Sepal.Length, y = Sepal.Width)) +
  geom_point() +
  geom_smooth(method = "glm",
              method.args = list(family = gaussian(link = identity)), formula = y ~ x)

ggplot(data = iris, aes(x = Sepal.Length, y = Sepal.Width)) +
  geom_point() +
  geom_smooth(method = "glm",
              method.args = list(family = Gamma(link = "inverse")), formula = y ~ x)
ggplot(data = iris, aes(x = Sepal.Length, y = Sepal.Width)) +
  geom_point() +
  geom_smooth(method = glm,
              method.args = list(family = Gamma(link = "inverse")), formula = y ~ x)
ggplot(data = iris, aes(x = Sepal.Length, y = Sepal.Width)) +
  geom_point() +
  stat_smooth(method = lm, formula = y ~ splines::bs(x, df = 3), se = FALSE)

ggplot(data = iris, aes(x = Sepal.Length, y = Sepal.Width)) +
  geom_point() +
  stat_smooth(method = lm, formula = y ~ splines::bs(x, df = 4), se = FALSE)

ggplot(data = iris, aes(x = Sepal.Length, y = Sepal.Width)) +
  geom_point() +
  stat_smooth(method = lm, formula = y ~ splines::bs(x, df = 5), se = FALSE)

ggplot(data = iris, aes(x = Sepal.Length, y = Sepal.Width)) +
  geom_point() +
  stat_smooth(method = lm, formula = y ~ splines::bs(x, df = 6), se = FALSE)

ggplot(data = iris, aes(x = Sepal.Length, y = Sepal.Width)) +
  geom_point() +
  stat_smooth(method = lm, formula = y ~ splines::bs(x, df = 7), se = FALSE)

ggplot(data = iris, aes(x = Sepal.Length, y = Sepal.Width)) +
  geom_point() +
  stat_smooth(method = lm, formula = y ~ splines::bs(x, df = 3),
              geom = "line", aes(color = "df = 3")) +
  stat_smooth(method = lm, formula = y ~ splines::bs(x, df = 4),
              geom = "line", aes(color = "df = 4")) +
  stat_smooth(method = lm, formula = y ~ splines::bs(x, df = 5),
              geom = "line", aes(color = "df = 5")) +
  stat_smooth(method = lm, formula = y ~ splines::bs(x, df = 7),
              geom = "line", aes(color = "df = 7")) +
  stat_smooth(method = lm, formula = y ~ splines::bs(x, df = 9),
              geom = "line", aes(color = "df = 9"))
gplot(data = iris, aes(x = Sepal.Length, y = Sepal.Width)) +
  geom_point() +
  stat_smooth(method = lm, formula = y ~ splines::ns(x, df = 1))

ggplot(data = iris, aes(x = Sepal.Length, y = Sepal.Width)) +
  geom_point() +
  stat_smooth(method = lm, formula = y ~ splines::ns(x, df = 2))

ggplot(data = iris, aes(x = Sepal.Length, y = Sepal.Width)) +
  geom_point() +
  stat_smooth(method = lm, formula = y ~ splines::ns(x, df = 3))

ggplot(data = iris, aes(x = Sepal.Length, y = Sepal.Width)) +
  geom_point() +
  stat_smooth(method = lm, formula = y ~ splines::ns(x, df = 4))

ggplot(data = iris, aes(x = Sepal.Length, y = Sepal.Width)) +
  geom_point() +
  stat_smooth(method = lm, formula = y ~ splines::ns(x, df = 5))

ggplot(data = iris, aes(x = Sepal.Length, y = Sepal.Width)) +
  geom_point() +
  stat_smooth(method = lm, formula = y ~ splines::ns(x, df = 6))

ggplot(data = iris, aes(x = Sepal.Length, y = Sepal.Width)) +
  geom_point() +
  stat_smooth(method = lm, formula = y ~ splines::ns(x, df = 7))

ggplot(data = iris, aes(x = Sepal.Length, y = Sepal.Width)) +
  geom_point() +
  stat_smooth(method = lm, formula = y ~ splines::ns(x, df = 1),
              geom = "line", aes(color = "df = 1")) +
  stat_smooth(method = lm, formula = y ~ splines::ns(x, df = 2),
              geom = "line", aes(color = "df = 2")) +
  stat_smooth(method = lm, formula = y ~ splines::ns(x, df = 3),
              geom = "line", aes(color = "df = 3")) +
  stat_smooth(method = lm, formula = y ~ splines::ns(x, df = 5),
              geom = "line", aes(color = "df = 5")) +
  stat_smooth(method = lm, formula = y ~ splines::ns(x, df = 9),
              geom = "line", aes(color = "df = 9"))
引数span
ggplot(data = iris, aes(x = Sepal.Length, y = Sepal.Width)) +
  geom_point() +
  stat_smooth(method = loess)
ggplot(data = iris, aes(x = Sepal.Length, y = Sepal.Width)) +
  geom_point() +
  stat_smooth(method = loess, span = 0.75)

ggplot(data = iris, aes(x = Sepal.Length, y = Sepal.Width)) +
  geom_point() +
  # stat_smooth(method = loess, span = 0.2, se = FALSE, aes(color = "span = 0.2")) +
  stat_smooth(method = loess, span = 0.3, se = FALSE, aes(color = "span = 0.3")) +
  stat_smooth(method = loess, span = 0.4, se = FALSE, aes(color = "span = 0.4")) +
  stat_smooth(method = loess, span = 0.5, se = FALSE, aes(color = "span = 0.5")) +
  stat_smooth(method = loess, span = 0.6, se = FALSE, aes(color = "span = 0.6")) +
  stat_smooth(method = loess, span = 0.7, se = FALSE, aes(color = "span = 0.7")) +
  stat_smooth(method = loess, span = 0.8, se = FALSE, aes(color = "span = 0.8")) +
  stat_smooth(method = loess, span = 0.9, se = FALSE, aes(color = "span = 0.9")) +
  stat_smooth(method = loess, span = 1.0, se = FALSE, aes(color = "span = 1.0"))
グラフの色分け
これもcolor軸, fill軸を入れて色分けができます。デフォルトでposition = "identity"です。
ggplot(data = iris, aes(x = Sepal.Length, y = Sepal.Width, color = Species)) +
  geom_point() +
  stat_smooth(method = "lm", formula = y ~ x)

ggplot(data = iris, aes(x = Sepal.Length, y = Sepal.Width, color = Species, fill = Species)) +
  geom_point() +
  stat_smooth(method = "lm", formula = y ~ x)
引数fullrange
ggplot(data = iris, aes(x = Sepal.Length, y = Sepal.Width, color = Species)) +
  geom_point() +
  stat_smooth(method = "lm", formula = y ~ x, fullrange = TRUE)

ggplot(data = iris, aes(x = Sepal.Length, y = Sepal.Width, color = Species)) +
  geom_point() +
  stat_smooth(method = "lm", formula = y ~ x, fullrange = TRUE) +
  facet_grid(cols = vars(Species))
stat_quantile()
stat_quantile()は分位点回帰を計算します。デフォルトでgeom = "quantile"(分位点回帰曲線のプロット)で、これはgeom_quantile(stat = "quantile")と同じです。
ggplot(data = iris, aes(x = Sepal.Length, y = Sepal.Width)) +
  geom_point() +
  stat_quantile()
ggplot(data = iris, aes(x = Sepal.Length, y = Sepal.Width)) +
  geom_point() +
  stat_quantile(geom = "quantile")
ggplot(data = iris, aes(x = Sepal.Length, y = Sepal.Width)) +
  geom_point() +
  geom_quantile()
ggplot(data = iris, aes(x = Sepal.Length, y = Sepal.Width)) +
  geom_point() +
  geom_quantile(stat = "quantile")
geom
ggplot(data = iris, aes(x = Sepal.Length, y = Sepal.Width)) +
  geom_point() +
  stat_quantile(geom = "line")
ggplot(data = iris, aes(x = Sepal.Length, y = Sepal.Width)) +
  geom_point() +
  stat_quantile(geom = "path")
..quantile..等
-
..quantile..:分位
ggplot(data = iris, aes(x = Sepal.Length, y = Sepal.Width)) +
  geom_point() +
  stat_quantile(geom = "line", aes(color = factor(..quantile..)))

q10 <- seq(0.1, 0.9, by = 0.1)
ggplot(data = iris, aes(x = Sepal.Length, y = Sepal.Width)) +
  geom_point() +
  stat_quantile(quantiles = q10, geom = "line", aes(color = factor(..quantile..)))
内部的に計算されている値を確認しておきます。
p <- ggplot(data = iris, aes(x = Sepal.Length, y = Sepal.Width)) +
  stat_quantile()
ggplot_build(p)

layer_data(p) %>% head()
#          x   y quantile   group PANEL weight  colour size linetype alpha
# 1 4.300000 2.8     0.25 -1-0.25     1      1 #3366FF  0.5        1    NA
# 2 4.336364 2.8     0.25 -1-0.25     1      1 #3366FF  0.5        1    NA
# 3 4.372727 2.8     0.25 -1-0.25     1      1 #3366FF  0.5        1    NA
# 4 4.409091 2.8     0.25 -1-0.25     1      1 #3366FF  0.5        1    NA
# 5 4.445455 2.8     0.25 -1-0.25     1      1 #3366FF  0.5        1    NA
# 6 4.481818 2.8     0.25 -1-0.25     1      1 #3366FF  0.5        1    NA

layer_scales(p)
# $x
# <ScaleContinuousPosition>
#  Range:   4.3 --  7.9
#  Limits:  4.3 --  7.9
#
# $y
# <ScaleContinuousPosition>
#  Range:   2.8 -- 3.59
#  Limits:  2.8 -- 3.59
#

layer_grob(p)
# $`1`
# polyline[GRID.polyline.****]
#
引数quantiles
分位点を指定します。デフォルトではquantiles = c(0.25, 0.5, 0.75)です。
ggplot(data = iris, aes(x = Sepal.Length, y = Sepal.Width)) +
  geom_point() +
  stat_quantile()
ggplot(data = iris, aes(x = Sepal.Length, y = Sepal.Width)) +
  geom_point() +
  stat_quantile(quantiles = c(0.25, 0.5, 0.75))

ggplot(data = iris, aes(x = Sepal.Length, y = Sepal.Width)) +
  geom_point() +
  stat_quantile(quantiles = c(0.1, 0.5, 0.9))

q10 <- seq(0.1, 0.9, by = 0.1)
ggplot(data = iris, aes(x = Sepal.Length, y = Sepal.Width)) +
  geom_point() +
  stat_quantile(quantiles = q10)
引数method
ggplot(data = iris, aes(x = Sepal.Length, y = Sepal.Width)) +
  geom_point() +
  stat_quantile()
ggplot(data = iris, aes(x = Sepal.Length, y = Sepal.Width)) +
  geom_point() +
  stat_quantile(method = "rq")

ggplot(data = iris, aes(x = Sepal.Length, y = Sepal.Width)) +
  geom_point() +
  stat_quantile(method = "rqss")
グラフの色分け
これもcolor軸を入れて色分けができます。デフォルトでposition = "identity"です。
ggplot(data = iris, aes(x = Sepal.Length, y = Sepal.Width, color = Species)) +
  geom_point() +
  stat_quantile(method = "rq")

ggplot(data = iris, aes(x = Sepal.Length, y = Sepal.Width, color = Species)) +
  geom_point() +
  stat_quantile(method = "rqss")
3変数(x:連続,y:連続,z:連続)
stat_contour()
stat_contour()はz軸の値に応じて等高線を計算します。デフォルトでgeom = "contour"(等高線プロット)で、これはgeom_contour(stat = "contour")と同じです。
library(mvtnorm)
mu <- c(0, 0)
sigma <- matrix(c(4, 2, 2, 3), ncol = 2)
x <- seq(-4, 4, by = 0.5)
y <- seq(-4, 4, by = 0.5)
xy <- expand.grid(x, y)
names(xy) <- c("x", "y")
z <- dmvnorm(xy, mean = mu, sigma = sigma)
df <- cbind(xy, z)

ggplot(df, aes(x = x, y = y, z = z)) +
  stat_contour()
ggplot(df, aes(x = x, y = y, z = z)) +
  stat_contour(geom = "contour")
ggplot(df, aes(x = x, y = y, z = z)) +
  geom_contour()
ggplot(df, aes(x = x, y = y, z = z)) +
  geom_contour(stat = "contour")
geom
ggplot(df, aes(x = x, y = y, z = z)) +
  stat_contour(geom = "path")

ggplot(df, aes(x = x, y = y, z = z)) +
  stat_contour(geom = "line")

ggplot(df, aes(x = x, y = y, z = z)) +
  stat_contour(geom = "point")

ggplot(df, aes(x = x, y = y, z = z)) +
  stat_contour(geom = "polygon", alpha = 0.2)
..level..等
-
..level..:等高線を描くz方向の水準を区分した値 -
..nlevel..:等高線を描くz方向の水準を区分した値(最大を1にしたもの)
ggplot(df, aes(x = x, y = y, z = z)) +
  stat_contour(geom = "polygon", aes(fill = ..level..))

ggplot(df, aes(x = x, y = y, z = z)) +
  stat_contour(geom = "polygon", aes(fill = ..nlevel..))
内部的に計算されている値を確認しておきます。
p <- ggplot(df, aes(x = x, y = y, z = z)) +
  stat_contour()
ggplot_build(p)

layer_data(p) %>% head()
#   order level       x        y piece      group     nlevel PANEL weight  colour size linetype alpha
# 1 0.005 0.005 4.00000 3.292383     1 -1-002-001 0.09090909     1      1 #3366FF  0.5        1    NA
# 2 0.005 0.005 3.74967 3.500000     1 -1-002-001 0.09090909     1      1 #3366FF  0.5        1    NA
# 3 0.005 0.005 3.50000 3.648020     1 -1-002-001 0.09090909     1      1 #3366FF  0.5        1    NA
# 4 0.005 0.005 3.00000 3.797529     1 -1-002-001 0.09090909     1      1 #3366FF  0.5        1    NA
# 5 0.005 0.005 2.50000 3.835582     1 -1-002-001 0.09090909     1      1 #3366FF  0.5        1    NA
# 6 0.005 0.005 2.00000 3.802795     1 -1-002-001 0.09090909     1      1 #3366FF  0.5        1    NA

layer_scales(p)
# $x
# <ScaleContinuousPosition>
#  Range:    -4 --    4
#  Limits:   -4 --    4
#
# $y
# <ScaleContinuousPosition>
#  Range:  -3.84 -- 3.84
#  Limits: -3.84 -- 3.84
#

layer_grob(p)
# $`1`
# polyline[GRID.polyline.****]
#
stat_contour_filled()
stat_contour_filledはstat_contour()の等高線の間を塗りつぶした版です。デフォルトでgeom = "contour_filled"で、これはgeom_contour_filled(stat = "contour_filled")と同じです。
ggplot(df, aes(x = x, y = y, z = z)) +
  stat_contour_filled()
ggplot(df, aes(x = x, y = y, z = z)) +
  stat_contour_filled(geom = "contour_filled")
ggplot(df, aes(x = x, y = y, z = z)) +
  geom_contour_filled()
ggplot(df, aes(x = x, y = y, z = z)) +
  geom_contour_filled(stat = "contour_filled")
..level..等
-
..level..:等高線を描くz方向の水準をcutしてカテゴリー化したもの -
..nlevel..:等高線を描くz方向の水準を区分した値
ggplot(df, aes(x = x, y = y, z = z)) +
  stat_contour_filled(geom = "polygon", aes(fill = ..level..))

ggplot(df, aes(x = x, y = y, z = z)) +
  stat_contour_filled(geom = "polygon", aes(fill = ..nlevel..))
内部的に計算されている値を確認しておきます。
p <- ggplot(df, aes(x = x, y = y, z = z)) +
  stat_contour_filled()
ggplot_build(p)

layer_data(p) %>% head()
#        fill          order          level   x y piece  group subgroup level_low level_high level_mid     nlevel PANEL colour size linetype alpha
# 1 #440154FF (0.000, 0.005] (0.000, 0.005] 3.0 4     1 -1-001        1         0      0.005    0.0025 0.08333333     1     NA  0.5        1    NA
# 2 #440154FF (0.000, 0.005] (0.000, 0.005] 2.5 4     1 -1-001        1         0      0.005    0.0025 0.08333333     1     NA  0.5        1    NA
# 3 #440154FF (0.000, 0.005] (0.000, 0.005] 2.0 4     1 -1-001        1         0      0.005    0.0025 0.08333333     1     NA  0.5        1    NA
# 4 #440154FF (0.000, 0.005] (0.000, 0.005] 1.5 4     1 -1-001        1         0      0.005    0.0025 0.08333333     1     NA  0.5        1    NA
# 5 #440154FF (0.000, 0.005] (0.000, 0.005] 1.0 4     1 -1-001        1         0      0.005    0.0025 0.08333333     1     NA  0.5        1    NA
# 6 #440154FF (0.000, 0.005] (0.000, 0.005] 0.5 4     1 -1-001        1         0      0.005    0.0025 0.08333333     1     NA  0.5        1    NA

layer_scales(p)
# $x
# <ScaleContinuousPosition>
#  Range:    -4 --    4
#  Limits:   -4 --    4
#
# $y
# <ScaleContinuousPosition>
#  Range:    -4 --    4
#  Limits:   -4 --    4
#

layer_grob(p)
# $`1`
# pathgrob[geom_polygon.pathgrob.****]
#
2変数(x:離散,y:連続・集計)
stat_summary()
stat_summary()は離散値xごとに連続値yの統計量を集計します。デフォルトでgeom = "pointrange"(エラーバープロット (pointrange))(yの統計量が3つ必要です。)で、これはgeom_pointrange(stat = "summary")と同じです。
統計量はfun,fun.max,fun.min,fun.dataで指定します。
ggplot(data = iris, aes(x = Species, y = Sepal.Length)) +
  stat_summary(fun = "mean", fun.max = "max", fun.min = "min")
ggplot(data = iris, aes(x = Species, y = Sepal.Length)) +
  stat_summary(fun = "mean", fun.max = "max", fun.min = "min", geom = "pointrange")
ggplot(data = iris, aes(x = Species, y = Sepal.Length)) +
  geom_pointrange(stat = "summary", fun = "mean", fun.max = "max", fun.min = "min")
geom
ggplot(data = iris, aes(x = Species, y = Sepal.Length)) +
  stat_summary(fun = "mean", geom = "point")
ggplot(data = iris, aes(x = Species, y = Sepal.Length)) +
  geom_point(stat = "summary", fun = "mean")

ggplot(data = iris, aes(x = Species, y = Sepal.Length)) +
  stat_summary(fun = "mean", geom = "bar")
ggplot(data = iris, aes(x = Species, y = Sepal.Length)) +
  geom_bar(stat = "summary", fun = "mean")
引数fun
ggplot(data = iris, aes(x = Species, y = Sepal.Length)) +
  stat_summary(fun = "mean", geom = "bar") +
  stat_summary(fun = "max", geom = "point", color = "red") +
  stat_summary(fun = "min", geom = "point", color = "blue") +
  stat_summary(fun = "median", geom = "point", color = "green")
ggplot(data = iris, aes(x = Species, y = Sepal.Length)) +
  geom_bar(stat = "summary", fun = "mean") +
  geom_point(stat = "summary", fun = "max", color = "red") +
  geom_point(stat = "summary", fun = "min", color = "blue") +
  geom_point(stat = "summary", fun = "median", color = "green")

ggplot(data = iris, aes(x = as.integer(Species), y = Sepal.Length)) +
  stat_summary(fun = "mean", geom = "bar") +
  stat_summary(fun = "max", geom = "line", aes(color = "max")) +
  stat_summary(fun = "min", geom = "line", aes(color = "min")) +
  stat_summary(fun = "median", geom = "line", aes(color = "median"))
ggplot(data = iris, aes(x = as.integer(Species), y = Sepal.Length)) +
  geom_bar(stat = "summary", fun = "mean") +
  geom_line(stat = "summary", fun = "max", aes(color = "max")) +
  geom_line(stat = "summary", fun = "min", aes(color = "min")) +
  geom_line(stat = "summary", fun = "median", aes(color = "median"))
y軸を1として"sum"を計算すれば、stat_count(geom = "bar"), geom_bar(stat = "count")と同じになります。
ggplot(data = iris, aes(x = round(Sepal.Length), y = 1)) +
  stat_summary(fun = "sum", geom = "bar")
# これは次と同じ
ggplot(data = iris, aes(x = round(Sepal.Length))) +
  stat_count(geom = "bar")
ggplot(data = iris, aes(x = round(Sepal.Length))) +
  geom_bar(stat = "count")
引数fun.min, fun.max
ggplot(data = iris, aes(x = Species, y = Sepal.Length)) +
  stat_summary(fun = "mean", fun.max = "max", fun.min = "min")
ggplot(data = iris, aes(x = Species, y = Sepal.Length)) +
  stat_summary(fun = "mean", fun.max = "max", fun.min = "min", geom = "pointrange")
ggplot(data = iris, aes(x = Species, y = Sepal.Length)) +
  geom_pointrange(stat = "summary", fun = "mean", fun.max = "max", fun.min = "min")

ggplot(data = iris, aes(x = Species, y = Sepal.Length)) +
  stat_summary(fun.max = "max", fun.min = "min", geom = "linerange")
ggplot(data = iris, aes(x = Species, y = Sepal.Length)) +
  geom_linerange(stat = "summary", fun.max = "max", fun.min = "min")

ggplot(data = iris, aes(x = Species, y = Sepal.Length)) +
  stat_summary(fun.max = "max", fun.min = "min", geom = "errorbar")
ggplot(data = iris, aes(x = Species, y = Sepal.Length)) +
  geom_errorbar(stat = "summary", fun.max = "max", fun.min = "min")

ggplot(data = iris, aes(x = Species, y = Sepal.Length)) +
  stat_summary(fun = "mean", fun.max = "max", fun.min = "min", geom = "crossbar")
ggplot(data = iris, aes(x = Species, y = Sepal.Length)) +
  geom_crossbar(stat = "summary", fun = "mean", fun.max = "max", fun.min = "min")

ggplot(data = iris, aes(x = Species, y = Sepal.Length)) +
  stat_summary(fun = "mean", geom = "bar") +
  stat_summary(fun = "mean", fun.max = "max", fun.min = "min", geom = "errorbar",
               width = 0.2)
ggplot(data = iris, aes(x = Species, y = Sepal.Length)) +
  geom_bar(stat = "summary", fun = "mean") +
  geom_errorbar(stat = "summary", fun = "mean", fun.max = "max", fun.min = "min",
                width = 0.2)
引数fun.data
fun.dataには、fun, fun.max, fun.minそれぞれに関数を指定する代わりに、それらの組(データフレーム)を返す関数を指定できます。
例えば、fun, fun.max, fun.minそれぞれに平均, 平均-標準誤差, 平均+標準誤差を指定する代わりに、それらの組(データフレーム)を返す関数mean_seをfun.dataに指定できます。
ggplot(data = iris, aes(x = Species, y = Sepal.Length)) +
  stat_summary(fun.data = "mean_se", geom = "pointrange")
# これは次と同じ
se <- function(x) sd(x) / sqrt(length(x)) # 標準誤差
mean_m_se <- function(x) mean(x) - se(x)  # 平均 - 標準誤差
mean_p_se <- function(x) mean(x) + se(x)  # 平均 + 標準誤差
ggplot(data = iris, aes(x = Species, y = Sepal.Length)) +
  stat_summary(fun = "mean", fun.min = "mean_m_se", fun.max = "mean_p_se", geom = "pointrange")
ggplot(data = iris, aes(x = Species, y = Sepal.Length)) +
  stat_summary(fun = "mean",
               fun.min = function(x) mean(x) - sd(x) / sqrt(length(x)),
               fun.max = function(x) mean(x) + sd(x) / sqrt(length(x)),
               geom = "pointrange")
fun.dataに指定できる関数には次があります。
-
mean_se:平均と平均±標準誤差SEの定数倍(定数はデフォルトでmult = 1) -
mean_sdl:平均と平均±標準偏差SDの定数倍(定数はデフォルトでmult = 2(1ではない)) -
mean_cl_normal:平均とt分布(t(n-1))の信頼区間(デフォルトでconf.int = 0.95(95%信頼区間)) -
mean_cl_boot:平均とノンパラメトリックブートストラップによる信頼区間(デフォルトでconf.int = 0.95(95%信頼区間)) -
median_hilow:中央値と分位点(デフォルトでconf.int = 0.95(2.5, 97.5パーセンタイル))
なお、mean_sdl, mean_cl_normal, mean_cl_boot, median_hilowはそれぞれHmiscライブラリの関数に相当します。
-
Hmisc::smean.sdl(x, mult=2, na.rm=TRUE):the mean plus or minus a constant times the standard deviation -
Hmisc::smean.cl.normal(x, mult=qt((1+conf.int)/2,n-1), conf.int=.95, na.rm=TRUE):the sample mean and lower and upper Gaussian confidence limits based on the t-distribution -
Hmisc::smean.cl.boot(x, conf.int=.95, B=1000, na.rm=TRUE, reps=FALSE):a very fast implementation of the basic nonparametric bootstrap for obtaining confidence limits for the population mean without assuming normality -
Hmisc::smedian.hilow(x, conf.int=.95, na.rm=TRUE):the sample median and a selected pair of outer quantiles having equal tail areas
x <- iris$Sepal.Length
mean(x) # 平均
# [1] 5.843333
sd(x)   # 標準偏差(不偏標準偏差)SD
# [1] 0.8280661
se <- function(x) sd(x) / sqrt(length(x)) # 標準誤差
se(x)   # 標準誤差 SE = SD/√n
# [1] 0.06761132
sd(x) / sqrt(length(x))
# [1] 0.06761132

# 平均と平均±標準誤差SE
mean_se(x)
#          y     ymin     ymax
# 1 5.843333 5.775722 5.910945
c(mean(x), mean(x) - se(x), mean(x) + se(x))
c(mean(x), mean(x) - sd(x) / sqrt(length(x)), mean(x) + sd(x) / sqrt(length(x)))
# [1] 5.843333 5.775722 5.910945

# 平均と平均±標準偏差SD
mean_sdl(x, mult = 1)
#          y     ymin     ymax
# 1 5.843333 5.015267 6.671399
library(Hmisc)
smean.sdl(x, mult = 1)
#     Mean    Lower    Upper
# 5.843333 5.015267 6.671399
c(mean(x), mean(x) - sd(x), mean(x) + sd(x))
# [1] 5.843333 5.015267 6.671399

# 平均と平均±標準偏差の2倍
mean_sdl(x, mult = 2)
#          y     ymin     ymax
# 1 5.843333 4.187201 7.499466
library(Hmisc)
smean.sdl(x, mult = 2)
#     Mean    Lower    Upper
# 5.843333 4.187201 7.499466
c(mean(x), mean(x) - 2*sd(x), mean(x) + 2*sd(x))
# [1] 5.843333 4.187201 7.499466

# 平均とt分布(t(n-1))の95%信頼区間
mean_cl_normal(x, conf.int = 0.95)
#          y     ymin     ymax
# 1 5.843333 5.709732 5.976934
library(Hmisc)
smean.cl.normal(x, conf.int = 0.95)
#     Mean    Lower    Upper
# 5.843333 5.709732 5.976934
c(mean(x), mean(x) - 1.962341*SE, mean(x) + 1.962341*SE)
c(mean(x), mean(x) - qt(p = 1-(1-0.95)/2, df = length(x)-1)*SE, mean(x) + qt(p = 1-(1-0.95)/2, df = length(x)-1)*SE)
# [1] 5.843333 5.709732 5.976934

# 平均と正規分布の95%信頼区間
c(mean(x), mean(x) - 1.96*SE, mean(x) + 1.96*SE)
c(mean(x), mean(x) - qnorm(p = 1-(1-0.95)/2, 0, 1)*SE, mean(x) + qnorm(p = 1-(1-0.95)/2, 0, 1)*SE)
# [1] 5.843333 5.710818 5.975849

qnorm(p = 1-(1-0.95)/2, mean = 0, sd = 1) # [1] 1.959964
qt(p = 1-(1-0.95)/2, df = length(x) -1)   # [1] 1.962341

# 正規性を仮定せずに母平均の信頼限界を求める基本的なノンパラメトリックブートストラップによる95%信頼区間
set.seed(0)
mean_cl_boot(x, conf.int = 0.95)
#          y   ymin     ymax
# 1 5.843333 5.7158 5.980017
library(Hmisc)
set.seed(0)
smean.cl.boot(x, conf.int = 0.95)
#     Mean    Lower    Upper
# 5.843333 5.715800 5.980017

# 中央値と2.5%、97.5%の分位点(2.5パーセンタイル, 97.5パーセンタイル)
median_hilow(x, conf.int = 0.95)
#     y   ymin ymax
# 1 5.8 4.4725  7.7
library(Hmisc)
smedian.hilow(x, conf.int = 0.95)
# Median  Lower  Upper
# 5.8000 4.4725 7.7000
c(median(x), quantile(x, 0.025), quantile(x, 0.975))
quantile(x, c(0.025, 0.5, 0.975))
#   2.5%    50%  97.5%
# 4.4725 5.8000 7.7000

# 中央値と第1四分位、第3四分位
median_hilow(x, conf.int = 0.5)
#     y ymin ymax
# 1 5.8  5.1  6.4
library(Hmisc)
smedian.hilow(x, conf.int = 0.5)
# Median  Lower  Upper
#    5.8    5.1    6.4
quantile(x, c(0.25, 0.5, 0.75))
# 25% 50% 75%
# 5.1 5.8 6.4
なお、Hmiscライブラリの関数mean_sdl等はベクトルを返しますが、ggplot2の関数mean_sdl等はデータフレームを返します。
class(mean_se(x))  # データフレームを返す
# [1] "data.frame"

class(mean_sdl(x, mult = 1))  # データフレームを返す
# [1] "data.frame"
class(smean.sdl(x, mult = 1)) # ベクトルを返す
# [1] "numeric"
..y..等
-
..y..:funで指定した統計量 -
..ymin..:fun.minで指定した統計量 -
..ymax..:fun.maxで指定した統計量
ggplot(data = iris, aes(x = Species, y = Sepal.Length)) +
  stat_summary(fun = "mean", geom = "bar") +
  stat_summary(fun = "mean", geom = "text",
               aes(label = ..y..), position = position_nudge(y = 0.3))

ggplot(data = iris, aes(x = Species, y = Sepal.Length)) +
  stat_summary(fun = "mean", geom = "bar", aes(fill = ..y..))

ggplot(data = iris, aes(x = Species, y = Sepal.Length)) +
  stat_summary(fun.data = "median_hilow", geom = "pointrange", aes(color = ..y..))

ggplot(data = iris, aes(x = Species, y = Sepal.Length)) +
  stat_summary(fun.data = "median_hilow", geom = "pointrange",
               aes(color = ..ymax.. - ..ymin..))
内部的に計算されている値を確認しておきます。
p <- ggplot(data = iris, aes(x = Species, y = Sepal.Length)) +
  stat_summary(fun = "mean", fun.max = "max", fun.min = "min")
ggplot_build(p)

layer_data(p)
#   x group     y ymin ymax PANEL flipped_aes colour size linetype shape fill alpha stroke
# 1 1     1 5.006  4.3  5.8     1       FALSE  black  0.5        1    19   NA    NA      1
# 2 2     2 5.936  4.9  7.0     1       FALSE  black  0.5        1    19   NA    NA      1
# 3 3     3 6.588  4.9  7.9     1       FALSE  black  0.5        1    19   NA    NA      1

layer_scales(p)

layer_grob(p)
# $`1`
# gTree[geom_pointrange.gTree.****]
#
グラフの色分け
これもcolor軸, fill軸を入れて色分けができます。デフォルトでposition = "identity"です。
ggplot(data = iris, aes(x = round(Sepal.Length), y = Sepal.Width, color = Species)) +
  stat_summary(fun = "mean", fun.max = "max", fun.min = "min", geom = "pointrange")
ggplot(data = iris, aes(x = round(Sepal.Length), y = Sepal.Width, color = Species)) +
  stat_summary(fun = "mean", fun.max = "max", fun.min = "min", geom = "pointrange",
               position = "identity")

ggplot(data = iris, aes(x = round(Sepal.Length), y = Sepal.Width, color = Species)) +
  stat_summary(fun = "mean", fun.max = "max", fun.min = "min", geom = "pointrange",
               position = position_dodge(width = 0.5))

ggplot(data = iris, aes(x = round(Sepal.Length), y = Sepal.Width, color = Species)) +
  stat_summary(fun = "mean", fun.max = "max", fun.min = "min", geom = "crossbar",
               position = position_dodge(width = 0.5))

ggplot(data = iris, aes(x = round(Sepal.Length), y = Sepal.Width, color = Species)) +
  stat_summary(fun = "mean", fun.max = "max", fun.min = "min", geom = "crossbar",
               position = position_dodge(preserve = "single"))
ggplot(data = iris, aes(x = round(Sepal.Length), y = Sepal.Width, color = Species)) +
  stat_summary(fun = "mean", geom = "point", position = "identity") +
  stat_summary(fun = "mean", geom = "line", position = "identity")
ggplot(data = iris, aes(x = round(Sepal.Length), y = Sepal.Width, color = Species)) +
  geom_point(stat = "summary", fun = "mean", position = "identity") +
  geom_line(stat = "summary", fun = "mean", position = "identity")

ggplot(data = iris, aes(x = round(Sepal.Length), y = Sepal.Width, color = Species, fill = Species)) +
  stat_summary(fun = "mean", geom = "point", position = "identity") +
  stat_summary(fun = "mean", geom = "line", position = "identity") +
  stat_summary(fun.data = "mean_se", geom = "ribbon", position = "identity", alpha = 0.2)
ggplot(data = iris, aes(x = round(Sepal.Length), y = Sepal.Width, color = Species, fill = Species)) +
  geom_point(stat = "summary", fun = "mean", position = "identity") +
  geom_line(stat = "summary", fun = "mean", position = "identity") +
  geom_ribbon(stat = "summary", fun.data = "mean_se", position = "identity", alpha = 0.2)

ggplot(data = iris, aes(x = round(Sepal.Length), y = Sepal.Width, color = Species, fill = Species)) +
  stat_identity(position = position_dodge(width = 0.3), alpha = 1/5) +
  stat_summary(fun = "mean", geom = "line", position = "identity", size = 1) +
  stat_summary(fun.data = "mean_se", geom = "ribbon", position = "identity", alpha = 0.2)
ggplot(data = iris, aes(x = round(Sepal.Length), y = Sepal.Width, color = Species, fill = Species)) +
  geom_point(stat = "identity", position = position_dodge(width = 0.3), alpha = 1/5) +
  geom_line(stat = "summary", fun = "mean", position = "identity", size = 1) +
  geom_ribbon(stat = "summary", fun.data = "mean_se", position = "identity", alpha = 0.2)

ggplot(data = iris, aes(x = round(Sepal.Length), y = Sepal.Width, color = Species, fill = Species)) +
  stat_identity(position = position_jitter(width = 0.2, seed = 0), alpha = 1/2) +
  stat_summary(fun = "mean", geom = "line", position = "identity", size = 1) +
  stat_summary(fun.data = "mean_se", geom = "ribbon", position = "identity", alpha = 0.2)
ggplot(data = iris, aes(x = round(Sepal.Length), y = Sepal.Width, color = Species, fill = Species)) +
  geom_point(stat = "identity", position = position_jitter(width = 0.2, seed = 0), alpha = 1/3) +
  geom_line(stat = "summary", fun = "mean", position = "identity", size = 1) +
  geom_ribbon(stat = "summary", fun.data = "mean_se", position = "identity", alpha = 0.2)
ggplot(data = iris, aes(x = round(Sepal.Length), y = Sepal.Width, color = Species, fill = Species)) +
  stat_summary(fun = "mean", geom = "bar", alpha = 1/3)
ggplot(data = iris, aes(x = round(Sepal.Length), y = Sepal.Width, color = Species, fill = Species)) +
  stat_summary(fun = "mean", geom = "bar",
               position = "identity", alpha = 1/3)

ggplot(data = iris, aes(x = round(Sepal.Length), y = Sepal.Width, color = Species, fill = Species)) +
  stat_summary(fun = "mean", geom = "bar",
               position = position_dodge(preserve = "single"), alpha = 1/3)

ggplot(data = iris, aes(x = round(Sepal.Length), y = Sepal.Width, color = Species, fill = Species)) +
  stat_summary(fun = "mean", geom = "bar",
               position = position_dodge2(preserve = "single"), alpha = 1/3)

ggplot(data = iris, aes(x = round(Sepal.Length), y = Sepal.Width, color = Species, fill = Species)) +
  stat_summary(fun = "mean", geom = "bar",
               position = position_dodge(preserve = "single", width = 0.9), alpha = 1/3) +
  stat_summary(fun = "mean", fun.max = "max", fun.min = "min", geom = "errorbar",
               position = position_dodge(preserve = "single", width = 0.9), width = 0.3)
2変数(x:連続,y:連続・集計)
stat_summary_bin()
stat_summary_bin()は連続値xを区間分割したビンごとに連続値yの統計量を集計します。デフォルトでgeom = "pointrange"(エラーバープロット (pointrange))(yの統計量が3つ必要です。)で、geom_pointrange(stat= "summary_bin")と同じです。
統計量はfun,fun.max,fun.min,fun.dataで指定します。
ggplot(data = iris, aes(x = Sepal.Length, y = Sepal.Width)) +
  stat_summary_bin(binwidth = 0.5, fun = "mean", fun.max = "max", fun.min = "min")
ggplot(data = iris, aes(x = Sepal.Length, y = Sepal.Width)) +
  stat_summary_bin(binwidth = 0.5, fun = "mean", fun.max = "max", fun.min = "min",
                   geom = "pointrange")
ggplot(data = iris, aes(x = Sepal.Length, y = Sepal.Width)) +
  geom_pointrange(stat= "summary_bin", binwidth = 0.5,
                  fun = "mean", fun.max = "max", fun.min = "min")
geom
stat_summary_bin(geom = "point")はgeom_point(stat = "summary_bin"), stat_summary_bin(geom = "bar")はgeom_bar(stat = "summary_bin")と同じです。
ggplot(data = iris, aes(x = Sepal.Length, y = Sepal.Width)) +
  stat_summary_bin(binwidth = 0.5, fun = "mean", geom = "point")
ggplot(data = iris, aes(x = Sepal.Length, y = Sepal.Width)) +
  geom_point(stat = "summary_bin", binwidth = 0.5, fun = "mean")

ggplot(data = iris, aes(x = Sepal.Length, y = Sepal.Width)) +
  stat_summary_bin(binwidth = 0.5, fun = "mean", geom = "bar")
ggplot(data = iris, aes(x = Sepal.Length, y = Sepal.Width)) +
  geom_bar(stat = "summary_bin", binwidth = 0.5, fun = "mean")
引数fun
ggplot(data = iris, aes(x = Sepal.Length, y = Sepal.Width)) +
  stat_summary_bin(binwidth = 0.5, fun = "mean", geom = "bar") +
  stat_summary_bin(binwidth = 0.5, fun = "max", geom = "line", aes(color = "max")) +
  stat_summary_bin(binwidth = 0.5, fun = "min", geom = "line", aes(color = "min")) +
  stat_summary_bin(binwidth = 0.5, fun = "median", geom = "line", aes(color = "median")) +
  stat_summary_bin(binwidth = 0.5, fun = "max", geom = "point", aes(color = "max")) +
  stat_summary_bin(binwidth = 0.5, fun = "min", geom = "point", aes(color = "min")) +
  stat_summary_bin(binwidth = 0.5, fun = "median", geom = "point", aes(color = "median"))

ggplot(data = iris, aes(x = Sepal.Length, y = Sepal.Width)) +
  stat_summary_bin(binwidth = 0.5, fun = "sum", geom = "bar")
y軸を1として"sum"を計算すれば、stat_bin(geom = "bar"), geom_histogram(stat = "bin")と同じになります。
ggplot(data = iris, aes(x = Sepal.Length, y = 1)) +
  stat_summary_bin(binwidth = 0.5, fun = "sum", geom = "bar")
# これは次と同じ
ggplot(data = iris, aes(x = Sepal.Length)) +
  stat_bin(binwidth = 0.5, boundary = 4.0, closed = "left", geom = "bar")
ggplot(data = iris, aes(x = Sepal.Length)) +
  stat_bin(binwidth = 0.5, boundary = 4.0, closed = "left")
ggplot(data = iris, aes(x = Sepal.Length)) +
  geom_histogram(stat = "bin", binwidth = 0.5, boundary = 4.0, closed = "left")
ggplot(data = iris, aes(x = Sepal.Length)) +
  geom_histogram(binwidth = 0.5, boundary = 4.0, closed = "left")
引数fun.min, fun.max
ggplot(data = iris, aes(x = Sepal.Length, y = Sepal.Width)) +
  stat_summary_bin(binwidth = 0.5, fun = "mean", fun.max = "max", fun.min = "min")
ggplot(data = iris, aes(x = Sepal.Length, y = Sepal.Width)) +
  stat_summary_bin(binwidth = 0.5, fun = "mean", fun.max = "max", fun.min = "min",
                   geom = "pointrange")
ggplot(data = iris, aes(x = Sepal.Length, y = Sepal.Width)) +
  geom_pointrange(stat= "summary_bin", binwidth = 0.5,
                  fun = "mean", fun.max = "max", fun.min = "min")

ggplot(data = iris, aes(x = Sepal.Length, y = Sepal.Width)) +
  stat_summary_bin(binwidth = 0.5, fun.max = "max", fun.min = "min",
                   geom = "linerange")
ggplot(data = iris, aes(x = Sepal.Length, y = Sepal.Width)) +
  geom_linerange(stat= "summary_bin", binwidth = 0.5,
                 fun.max = "max", fun.min = "min")

ggplot(data = iris, aes(x = Sepal.Length, y = Sepal.Width)) +
  stat_summary_bin(binwidth = 0.5, fun.max = "max", fun.min = "min",
                   geom = "errorbar")
ggplot(data = iris, aes(x = Sepal.Length, y = Sepal.Width)) +
  geom_errorbar(stat= "summary_bin", binwidth = 0.5,
                fun.max = "max", fun.min = "min")

ggplot(data = iris, aes(x = Sepal.Length, y = Sepal.Width)) +
  stat_summary_bin(binwidth = 0.5, fun = "mean", fun.max = "max", fun.min = "min",
                   geom = "crossbar")
ggplot(data = iris, aes(x = Sepal.Length, y = Sepal.Width)) +
  geom_crossbar(stat= "summary_bin", binwidth = 0.5,
                fun = "mean", fun.max = "max", fun.min = "min")

ggplot(data = iris, aes(x = Sepal.Length, y = Sepal.Width)) +
  stat_summary_bin(binwidth = 0.5, fun = "mean", geom = "bar") +
  stat_summary_bin(binwidth = 0.5, fun = "mean", fun.max = "max", fun.min = "min",
                   geom = "errorbar", width = 0.2)
ggplot(data = iris, aes(x = Sepal.Length, y = Sepal.Width)) +
  geom_bar(stat = "summary_bin", binwidth = 0.5, fun = "mean") +
  geom_errorbar(stat = "summary_bin", binwidth = 0.5,
                fun = "mean", fun.max = "max", fun.min = "min", width = 0.2)
引数fun.data
ggplot(data = iris, aes(x = Sepal.Length, y = Sepal.Width)) +
  stat_summary_bin(binwidth = 0.5, fun.data = "median_hilow",
                   geom = "crossbar")
ggplot(data = iris, aes(x = Sepal.Length, y = Sepal.Width)) +
  geom_crossbar(stat = "summary_bin", binwidth = 0.5, fun.data = "median_hilow")

ggplot(data = iris, aes(x = Sepal.Length, y = Sepal.Width)) +
  stat_summary_bin(binwidth = 0.5, fun = "median", geom = "bar") +
  stat_summary_bin(binwidth = 0.5, fun.data = "median_hilow",
                   geom = "pointrange")
ggplot(data = iris, aes(x = Sepal.Length, y = Sepal.Width)) +
  geom_bar(stat = "summary_bin", binwidth = 0.5, fun = "median") +
  geom_pointrange(stat = "summary_bin", binwidth = 0.5, fun.data = "median_hilow")

ggplot(data = iris, aes(x = Sepal.Length, y = Sepal.Width)) +
  stat_summary_bin(binwidth = 0.5, fun = "mean", geom = "bar") +
  stat_summary_bin(binwidth = 0.5, fun.data = "mean_se",
                   geom = "errorbar", width = 0.2)
ggplot(data = iris, aes(x = Sepal.Length, y = Sepal.Width)) +
  geom_bar(stat = "summary_bin", binwidth = 0.5, fun = "mean") +
  geom_errorbar(stat = "summary_bin", binwidth = 0.5, fun.data = "mean_se", width = 0.2)
..y..等
-
..y..:funで指定した統計量 -
..ymin..:fun.minで指定した統計量 -
..ymax..:fun.maxで指定した統計量
ggplot(data = iris, aes(x = Sepal.Length, y = Sepal.Width)) +
  stat_summary_bin(binwidth = 0.5, fun = "mean", geom = "bar", aes(fill = ..y..))

ggplot(data = iris, aes(x = Sepal.Length, y = Sepal.Width)) +
  stat_summary_bin(binwidth = 0.5, fun.data = "median_hilow",
                   geom = "pointrange", aes(color = ..y..))

ggplot(data = iris, aes(x = Sepal.Length, y = Sepal.Width)) +
  stat_summary_bin(binwidth = 0.5, fun.data = "median_hilow",
                   geom = "pointrange", aes(color = ..ymax.. - ..ymin..))

ggplot(data = iris, aes(x = Sepal.Length, y = Sepal.Width)) +
  stat_summary_bin(binwidth = 0.5, fun.data = "mean_se", geom = "pointrange") +
  stat_summary_bin(binwidth = 0.5, fun = "mean", geom = "line") +
  stat_summary_bin(binwidth = 0.5, fun.data = "mean_se",
                   geom = "ribbon", aes(ymin = ..ymin.., ymax =..ymax..), alpha = 0.2)
内部的に計算されている値を確認しておきます。
p <- ggplot(data = iris, aes(x = Sepal.Length, y = Sepal.Width)) +
  stat_summary_bin(binwidth = 0.5, fun = "mean", fun.max = "max", fun.min = "min")
ggplot_build(p)

layer_data(p) %>% head()
#   bin        y ymin ymax    x width flipped_aes PANEL group colour size linetype shape fill alpha stroke
# 1   1 3.025000  2.9  3.2 4.25   0.5       FALSE     1    -1  black  0.5        1    19   NA    NA      1
# 2   2 3.088889  2.3  3.6 4.75   0.5       FALSE     1    -1  black  0.5        1    19   NA    NA      1
# 3   3 3.373333  2.0  4.1 5.25   0.5       FALSE     1    -1  black  0.5        1    19   NA    NA      1
# 4   4 2.935484  2.3  4.4 5.75   0.5       FALSE     1    -1  black  0.5        1    19   NA    NA      1
# 5   5 2.850000  2.2  3.4 6.25   0.5       FALSE     1    -1  black  0.5        1    19   NA    NA      1
# 6   6 3.036364  2.5  3.3 6.75   0.5       FALSE     1    -1  black  0.5        1    19   NA    NA      1

layer_scales(p)
# $x
# <ScaleContinuousPosition>
#  Range:  4.25 -- 7.75
#  Limits: 4.25 -- 7.75
#
# $y
# <ScaleContinuousPosition>
#  Range:     2 --  4.4
#  Limits:    2 --  4.4
#

layer_grob(p)
# $`1`
# gTree[geom_pointrange.gTree.****]
#
グラフの色分け
これもcolor軸, fill軸を入れて色分けができます。デフォルトでposition = "identity"です。
ggplot(data = iris, aes(x = Sepal.Length, y = Sepal.Width, color = Species, fill = Species)) +
  stat_summary_bin(binwidth = 0.5, fun = "mean", fun.max = "max", fun.min = "min",
                   geom = "pointrange")
ggplot(data = iris, aes(x = Sepal.Length, y = Sepal.Width, color = Species, fill = Species)) +
  stat_summary_bin(binwidth = 0.5, fun = "mean", fun.max = "max", fun.min = "min",
                   geom = "pointrange", position = "identity")
ggplot(data = iris, aes(x = Sepal.Length, y = Sepal.Width, color = Species, fill = Species)) +
  geom_pointrange(stat = "summary_bin", binwidth = 0.5,
                  fun = "mean", fun.max = "max", fun.min = "min", position = "identity")

ggplot(data = iris, aes(x = Sepal.Length, y = Sepal.Width, color = Species, fill = Species)) +
  stat_summary_bin(binwidth = 0.5, fun = "mean", fun.max = "max", fun.min = "min",
                   geom = "pointrange", position = position_dodge(width = 0.3))
ggplot(data = iris, aes(x = Sepal.Length, y = Sepal.Width, color = Species, fill = Species)) +
  geom_pointrange(stat = "summary_bin", binwidth = 0.5,
                  fun = "mean", fun.max = "max", fun.min = "min",
                  position = position_dodge(width = 0.3))

ggplot(data = iris, aes(x = Sepal.Length, y = Sepal.Width, color = Species, fill = Species)) +
  stat_summary_bin(binwidth = 0.5, fun = "mean", fun.max = "max", fun.min = "min",
                   geom = "crossbar", position = "identity", alpha = 1/3)
ggplot(data = iris, aes(x = Sepal.Length, y = Sepal.Width, color = Species, fill = Species)) +
  geom_crossbar(stat = "summary_bin", binwidth = 0.5,
                fun = "mean", fun.max = "max", fun.min = "min",
                position = "identity", alpha = 1/3)

ggplot(data = iris, aes(x = Sepal.Length, y = Sepal.Width, color = Species, fill = Species)) +
  stat_summary_bin(binwidth = 0.5, fun = "mean", geom = "bar",
                   position = position_dodge2(preserve = "single", width = 0.9), alpha = 1/3) +
  stat_summary_bin(binwidth = 0.5, fun = "mean", fun.max = "max", fun.min = "min",
                   geom = "errorbar",
                   position = position_dodge2(preserve = "single", width = 0.9), width = 0.2)
ggplot(data = iris, aes(x = Sepal.Length, y = Sepal.Width, color = Species, fill = Species)) +
  geom_bar(stat = "summary_bin", binwidth = 0.5, fun = "mean",
                   position = position_dodge2(preserve = "single", width = 0.9), alpha = 1/3) +
  geom_errorbar(stat = "summary_bin", binwidth = 0.5, fun = "mean", fun.max = "max", fun.min = "min",
                   position = position_dodge2(preserve = "single", width = 0.9), width = 0.2)

ggplot(data = iris, aes(x = Sepal.Length, y = Sepal.Width, color = Species, fill = Species)) +
  stat_summary_bin(binwidth = 0.5, fun = "mean", geom = "point", position = "identity") +
  stat_summary_bin(binwidth = 0.5, fun = "mean", geom = "line", position = "identity", size = 1) +
  stat_summary_bin(binwidth = 0.5, fun.data = "mean_se",
                   geom = "ribbon", position = "identity", alpha = 0.2)
ggplot(data = iris, aes(x = Sepal.Length, y = Sepal.Width, color = Species, fill = Species)) +
  geom_point(stat = "summary_bin", binwidth = 0.5, fun = "mean", position = "identity") +
  geom_line(stat = "summary_bin", binwidth = 0.5, fun = "mean", position = "identity", size = 1) +
  geom_ribbon(stat = "summary_bin", binwidth = 0.5,
                  fun.data = "mean_se", position = "identity", alpha = 0.2)
3変数(x:連続,y:連続,z:連続・集計)
stat_summary_2d()
stat_summary_2d()は1次元のstat_summary()の2次元版で、2次元のビン(タイル)上で連続値zの統計量を集計します。デフォルトでgeom = "tile"(タイル、ヒートマップ)で、これはgeom_tile(stat = "summary_2d")と同じです。
統計量はfunで指定します。
ggplot(data = iris, aes(x = Sepal.Length, y = Sepal.Width, z = Petal.Length)) +
  stat_summary_2d(binwidth = 0.5, fun = mean)
ggplot(data = iris, aes(x = Sepal.Length, y = Sepal.Width, z = Petal.Length)) +
  stat_summary_2d(binwidth = 0.5, fun = mean, geom = "tile")
ggplot(data = iris, aes(x = Sepal.Length, y = Sepal.Width, z = Petal.Length)) +
  geom_tile(stat = "summary_2d", binwidth = 0.5, fun = mean)
引数fun
ggplot(data = iris, aes(x = Sepal.Length, y = Sepal.Width, z = Petal.Length)) +
  stat_summary_2d(binwidth = 0.5, fun = median)
ggplot(data = iris, aes(x = Sepal.Length, y = Sepal.Width, z = Petal.Length)) +
  geom_tile(stat = "summary_2d", binwidth = 0.5, fun = median)

ggplot(data = iris, aes(x = Sepal.Length, y = Sepal.Width, z = Petal.Length)) +
  stat_summary_2d(binwidth = 0.5, fun = sum)
ggplot(data = iris, aes(x = Sepal.Length, y = Sepal.Width, z = Petal.Length)) +
  geom_tile(stat = "summary_2d", binwidth = 0.5, fun = sum)
z軸を1として"sum"を計算すれば、stat_bin_hex(geom = "hex"), geom_hex(stat = "binhex")と同じになります。
ggplot(data = iris, aes(x = Sepal.Length, y = Sepal.Width, z = 1)) +
  stat_summary_2d(binwidth = 0.5, fun = sum)
# これは次と同じ
ggplot(data = iris, aes(x = Sepal.Length, y = Sepal.Width)) +
  stat_bin2d(binwidth = 0.5, geom = "tile")
ggplot(data = iris, aes(x = Sepal.Length, y = Sepal.Width)) +
  geom_bin2d(stat = "bin2d", binwidth = 0.5)
..value..等
-
..value..:2次元のビン(タイル)上のfunで指定した統計量
ggplot(data = iris, aes(x = Sepal.Length, y = Sepal.Width, z = Petal.Length)) +
  stat_summary_2d(binwidth = 0.5, fun = mean)
ggplot(data = iris, aes(x = Sepal.Length, y = Sepal.Width, z = Petal.Length)) +
  stat_summary_2d(binwidth = 0.5, fun = mean, geom = "tile")
ggplot(data = iris, aes(x = Sepal.Length, y = Sepal.Width, z = Petal.Length)) +
  stat_summary_2d(binwidth = 0.5, fun = mean,
                  geom = "tile", aes(fill = ..value..))

ggplot(data = iris, aes(x = Sepal.Length, y = Sepal.Width, z = Petal.Length)) +
  stat_summary_2d(binwidth = 0.5, fun = mean,
                  geom = "point", aes(color = ..value.., size = ..value..))

ggplot(data = iris, aes(x = Sepal.Length, y = Sepal.Width, z = Petal.Length)) +
  stat_summary_2d(binwidth = 0.5, fun = mean,
                  geom = "rect", aes(xmin = ..x.. - 0.25, xmax = ..x.. + 0.25,
                                     ymin = ..y.. - 0.25, ymax = ..y.. + 0.25,
                                     fill = ..value..))

ggplot(data = iris, aes(x = Sepal.Length, y = Sepal.Width, z = Petal.Length)) +
  stat_summary_2d(binwidth = 0.5, fun = mean,
                  geom = "tile", aes(fill = ..value..))

ggplot(data = iris, aes(x = Sepal.Length, y = Sepal.Width, z = Petal.Length)) +
  stat_summary_2d(binwidth = 0.5, fun = mean,
                  geom = "raster", aes(fill = ..value..))

ggplot(data = iris, aes(x = Sepal.Length, y = Sepal.Width, z = Petal.Length)) +
  stat_summary_2d(binwidth = 0.5, fun = mean,
                  geom = "tile", aes(fill = ..value..)) +
  stat_summary_2d(binwidth = 0.5, fun = mean,
                  geom = "text", aes(label = round(..value.., 1)), color = "white")
内部的に計算されている値を確認しておきます。
p <- ggplot(data = iris, aes(x = Sepal.Length, y = Sepal.Width, z = Petal.Length)) +
  stat_summary_2d(binwidth = 0.5, fun = mean)
ggplot_build(p)

layer_data(p) %>% head()
#      fill xbin ybin value    x    y PANEL group xmin xmax ymin ymax colour size linetype alpha width height
# 1 #132C44    1    1 1.300 4.25 2.25     1    -1  4.0  4.5    2  2.5     NA  0.1        1    NA    NA     NA
# 2 #2F638F    2    1 3.650 4.75 2.25     1    -1  4.5  5.0    2  2.5     NA  0.1        1    NA    NA     NA
# 3 #306590    3    1 3.700 5.25 2.25     1    -1  5.0  5.5    2  2.5     NA  0.1        1    NA    NA     NA
# 4 #3A78AB    4    1 4.475 5.75 2.25     1    -1  5.5  6.0    2  2.5     NA  0.1        1    NA    NA     NA
# 5 #3D7EB3    5    1 4.700 6.25 2.25     1    -1  6.0  6.5    2  2.5     NA  0.1        1    NA    NA     NA
# 6 #4B9CDA    6    1 5.800 6.75 2.25     1    -1  6.5  7.0    2  2.5     NA  0.1        1    NA    NA     NA

layer_scales(p)
# $x
# <ScaleContinuousPosition>
#  Range:     4 --    8
#  Limits:    4 --    8
#
# $y
# <ScaleContinuousPosition>
#  Range:     2 --  4.5
#  Limits:    2 --  4.5
#

layer_grob(p)
# $`1`
# rect[geom_rect.rect.****]
#
グラフの色分け
この場合も、色分けするよりファセット(facet)するのが便利です。
ggplot(data = iris, aes(x = Sepal.Length, y = Sepal.Width, z = Petal.Length)) +
  stat_summary_2d(binwidth = 0.5, fun = mean, geom = "tile") +
  facet_grid(cols = vars(Species))
ggplot(data = iris, aes(x = Sepal.Length, y = Sepal.Width, z = Petal.Length)) +
  geom_tile(stat = "summary_2d", binwidth = 0.5, fun = mean) +
  facet_grid(cols = vars(Species))
ヒートマップ表示でも、色ではなく透明度で値の違いを表現するようにすれば、別の色の軸を入れることができます。2021/07/04追記
ggplot(data = iris, aes(x = Sepal.Length, y = Sepal.Width, z = Petal.Length)) +
  stat_summary_2d(binwidth = 0.5, fun = sum, geom = "tile",
                  aes(alpha = ..value.., fill = Species)) +
  scale_alpha_continuous(range = c(0.1, 0.5))
ggplot(data = iris, aes(x = Sepal.Length, y = Sepal.Width, z = Petal.Length)) +
  geom_tile(stat = "summary_2d", binwidth = 0.5, fun = sum,
            aes(alpha = ..value.., fill = Species)) +
  scale_alpha_continuous(range = c(0.1, 0.5))
stat_summary_hex()
stat_summary_hex()はstat_summary_2d()の六角形版で、2次元の六角形のタイル上で連続値zの統計量を集計します。デフォルトでgeom = "hex"(六角形のタイル貼り)で、これはgeom_hex(stat = "summary_hex")と同じです。
統計量はfunで指定します。
ggplot(data = iris, aes(x = Sepal.Length, y = Sepal.Width, z = Petal.Length)) +
  stat_summary_hex(binwidth = 0.5, fun = mean)
ggplot(data = iris, aes(x = Sepal.Length, y = Sepal.Width, z = Petal.Length)) +
  stat_summary_hex(binwidth = 0.5, fun = mean, geom = "hex")
ggplot(data = iris, aes(x = Sepal.Length, y = Sepal.Width, z = Petal.Length)) +
  geom_hex(stat = "summary_hex", binwidth = 0.5, fun = mean)
引数fun
ggplot(data = iris, aes(x = Sepal.Length, y = Sepal.Width, z = Petal.Length)) +
  stat_summary_hex(binwidth = 0.5, fun = median)
ggplot(data = iris, aes(x = Sepal.Length, y = Sepal.Width, z = Petal.Length)) +
  geom_hex(stat = "summary_hex", binwidth = 0.5, fun = median)

ggplot(data = iris, aes(x = Sepal.Length, y = Sepal.Width, z = Petal.Length)) +
  stat_summary_hex(binwidth = 0.5, fun = sum)
ggplot(data = iris, aes(x = Sepal.Length, y = Sepal.Width, z = Petal.Length)) +
  geom_hex(stat = "summary_hex", binwidth = 0.5, fun = sum)
z軸を1として"sum"を計算すれば、stat_bin_hex(geom = "hex"), geom_hex(stat = "binhex")と同じになります。
ggplot(data = iris, aes(x = Sepal.Length, y = Sepal.Width, z = 1)) +
  stat_summary_hex(binwidth = 0.5, fun = sum)
# これは次と同じ
ggplot(data = iris, aes(x = Sepal.Length, y = Sepal.Width)) +
  stat_bin_hex(binwidth = 0.5, geom = "hex")
ggplot(data = iris, aes(x = Sepal.Length, y = Sepal.Width)) +
  geom_hex(stat = "binhex", binwidth = 0.5)
..value..等
-
..value..:六角形のタイル上のfunで指定した統計量
ggplot(data = iris, aes(x = Sepal.Length, y = Sepal.Width, z = Petal.Length)) +
  stat_summary_hex(binwidth = 0.5, fun = mean)
ggplot(data = iris, aes(x = Sepal.Length, y = Sepal.Width, z = Petal.Length)) +
  stat_summary_hex(binwidth = 0.5, fun = mean, geom = "hex")
ggplot(data = iris, aes(x = Sepal.Length, y = Sepal.Width, z = Petal.Length)) +
  stat_summary_hex(binwidth = 0.5, fun = mean,
                   geom = "hex", aes(fill = ..value..))

ggplot(data = iris, aes(x = Sepal.Length, y = Sepal.Width, z = Petal.Length)) +
  stat_summary_hex(binwidth = 0.5, fun = mean,
                   geom = "point", aes(color = ..value.., size = ..value..))

ggplot(data = iris, aes(x = Sepal.Length, y = Sepal.Width, z = Petal.Length)) +
  stat_summary_hex(binwidth = 0.5, fun = mean,
                   geom = "rect", aes(xmin = ..x.. - 0.25, xmax = ..x.. + 0.25,
                                      ymin = ..y.. - 0.22, ymax = ..y.. + 0.22,
                                      fill = ..value..))
ggplot(data = iris, aes(x = Sepal.Length, y = Sepal.Width, z = Petal.Length)) +
  stat_summary_hex(binwidth = 0.5, fun = mean,
                   geom = "hex", aes(fill = ..value..)) +
  stat_summary_hex(binwidth = 0.5, fun = mean,
                   geom = "text", aes(label = round(..value.., 1)), color = "white")
内部的に計算されている値を確認しておきます。
p <- ggplot(data = iris, aes(x = Sepal.Length, y = Sepal.Width, z = Petal.Length)) +
  stat_summary_hex(binwidth = 0.5, fun = mean)
ggplot_build(p)

layer_data(p) %>% head()
#      fill        x        y    value PANEL group colour size linetype alpha
# 1 #2E608A 4.999999 1.999999 3.500000     1    -1     NA  0.5        1    NA
# 2 #3977A9 5.999999 1.999999 4.500000     1    -1     NA  0.5        1    NA
# 3 #28567C 4.749999 2.433012 3.033333     1    -1     NA  0.5        1    NA
# 4 #2A5880 5.249999 2.433012 3.150000     1    -1     NA  0.5        1    NA
# 5 #336B99 5.749999 2.433012 3.987500     1    -1     NA  0.5        1    NA
# 6 #3E80B5 6.249999 2.433012 4.880000     1    -1     NA  0.5        1    NA

layer_scales(p)
# $x
# <ScaleContinuousPosition>
#  Range:  4.25 --    8
#  Limits: 4.25 --    8
#
# $y
# <ScaleContinuousPosition>
#  Range:     2 -- 4.17
#  Limits:    2 -- 4.17
#

layer_grob(p)
# $`1`
# gTree[geom_hex.gTree.****]
#
グラフの色分け
この場合も、色分けするよりファセット(facet)するのが便利です。
ggplot(data = iris, aes(x = Sepal.Length, y = Sepal.Width, z = Petal.Length)) +
  stat_summary_hex(binwidth = 0.5, fun = mean, geom = "hex") +
  facet_grid(cols = vars(Species))
ggplot(data = iris, aes(x = Sepal.Length, y = Sepal.Width, z = Petal.Length)) +
  geom_hex(stat = "summary_hex", binwidth = 0.5, fun = mean) +
  facet_grid(cols = vars(Species))
ヒートマップ表示でも、色ではなく透明度で値の違いを表現するようにすれば、別の色の軸を入れることができます。2021/07/04追記
ggplot(data = iris, aes(x = Sepal.Length, y = Sepal.Width, z = Petal.Length)) +
  stat_summary_hex(binwidth = 0.5, fun = sum, geom = "hex",
                   aes(alpha = ..value.., fill = Species)) +
  scale_alpha_continuous(range = c(0.1, 0.5))
ggplot(data = iris, aes(x = Sepal.Length, y = Sepal.Width, z = Petal.Length)) +
  geom_hex(stat = "summary_hex", binwidth = 0.5, fun = sum,
           aes(alpha = ..value.., fill = Species)) +
  scale_alpha_continuous(range = c(0.1, 0.5))
関数
stat_function()
stat_function()は指定した関数の値を計算します。デフォルトでgeom = "function"で、これはgeom_function(stat = "function")と同じです。
ggplot() + xlim(-5, 5) +
  stat_function(fun = dnorm)
ggplot() + xlim(-5, 5) +
  stat_function(fun = dnorm, geom = "function")
ggplot() + xlim(-5, 5) +
  geom_function(fun = dnorm)
ggplot() + xlim(-5, 5) +
  geom_function(stat = "function", fun = dnorm)
geom
ggplot() + xlim(-5, 5) +
  stat_function(fun = dnorm, geom = "line")
ggplot() + xlim(-5, 5) +
  stat_function(fun = dnorm, geom = "path")

ggplot() + xlim(-5, 5) +
  stat_function(fun = dnorm, geom = "step")

ggplot() + xlim(-5, 5) +
  stat_function(fun = dnorm, geom = "point")

ggplot() + xlim(-5, 5) +
  stat_function(fun = dnorm) +
  stat_function(fun = dnorm, geom = "area", alpha = 0.5)
..y..等
-
..y..:y座標 -
..x..:x座標
ggplot() + xlim(-5, 5) +
  stat_function(fun = dnorm, geom = "line", aes(color = ..y..)) +
  stat_function(fun = dnorm, geom = "point", aes(color = ..y..))

ggplot() + xlim(-5, 5) +
  stat_function(fun = dnorm, n = 500, geom = "line", aes(color = ..y..)) +
  stat_function(fun = dnorm, n = 500,
                geom = "segment", aes(xend = ..x.., yend = 0, color = ..y..))
引数fun
ggplot() + xlim(-5, 5) +
  geom_function(fun = dnorm)

ggplot() + xlim(-5, 5) +
  geom_function(fun = exp)

ggplot() + xlim(-5, 5) +
  geom_function(fun = function(x) x^2)
引数args
ggplot() + xlim(-5, 5) +
  stat_function(fun = dnorm, args = list(mean = 0, sd = 1), aes(color = "N(0, 1)")) +
  stat_function(fun = dnorm, args = list(mean = 0, sd = 2), aes(color = "N(0, 2)")) +
  stat_function(fun = dnorm, args = list(mean = 2, sd = 1), aes(color = "N(2, 1)")) +
  stat_function(fun = dnorm, args = list(mean = 2, sd = 2), aes(color = "N(2, 2)"))
ヒストグラムと重ね描きしてみます。
set.seed(0)
df <- data.frame(x = rnorm(1000, mean = 0, sd = 1))
ggplot(data = df, aes(x = x)) +
  geom_histogram(aes(y = ..density..), binwidth = 0.1) +
  geom_function(fun = dnorm, args = list(mean = 0, sd = 1))
ggplot(data = iris, aes(x = Sepal.Length)) +
  geom_histogram(aes(y = ..density..), binwidth = 0.1) +
  geom_function(fun = dnorm,
                args = list(mean = mean(iris$Sepal.Length), sd = sd(iris$Sepal.Length)))

iris_summary <- iris_id %>%
  group_by(Species) %>%
  summarise(mean = mean(Sepal.Length), sd = sd(Sepal.Length)) %>% ungroup() %>% print()
ggplot(data = iris, aes(x = Sepal.Length)) +
  geom_histogram(aes(y = ..density.., color = Species, fill = Species),
                 binwidth = 0.1, position = "identity", alpha = 0.3) +
  geom_function(fun = dnorm,
                args = list(mean = iris_summary$mean[1], sd = iris_summary$sd[1]),
                aes(color = "setosa")) +
  geom_function(fun = dnorm,
                args = list(mean = iris_summary$mean[2], sd = iris_summary$sd[2]),
                aes(color = "versicolor")) +
  geom_function(fun = dnorm,
                args = list(mean = iris_summary$mean[3], sd = iris_summary$sd[3]),
                aes(color = "virginica"))

ggplot(data = iris, aes(x = Sepal.Length)) +
  geom_density(aes(y = ..density.., color = Species, fill = Species), alpha = 0.3) +
  geom_function(fun = dnorm,
                args = list(mean = iris_summary$mean[1], sd = iris_summary$sd[1]),
                aes(color = "setosa")) +
  geom_function(fun = dnorm,
                args = list(mean = iris_summary$mean[2], sd = iris_summary$sd[2]),
                aes(color = "versicolor")) +
  geom_function(fun = dnorm,
                args = list(mean = iris_summary$mean[3], sd = iris_summary$sd[3]),
                aes(color = "virginica"))
ggplot() + xlim(0,10) +
  stat_function(fun = dbinom, args = list(size = 10, prob = 1/2))

ggplot() + xlim(0,10) +
  stat_function(fun = dbinom, args = list(size = 10, prob = 1/2), n = 11, geom = "point")

ggplot() + xlim(0,10) +
  stat_function(fun = dbinom, args = list(size = 10, prob = 1/2), n = 10+1,
                geom = "point") +
  stat_function(fun = dbinom, args = list(size = 10, prob = 1/2), n = 10+1,
              geom = "segment", aes(xend = ..x.., yend = 0))
まとめ
stat_*(geom = "*")とgeom_*(stat = "*")の関係を一覧にしておきます。
| 変数の数 | xの型 | yの型 | zの型 | グラフ | stat_*() | geom_*() |
|---|---|---|---|---|---|---|
| 1変数 | 離散 | 棒グラフ | stat_count (geom = "bar", aes(y = ..count..)) |
geom_bar (stat = "count", aes(y = ..count..)) |
||
| 折れ線グラフ | stat_count (geom = "line", aes(y = ..count..)) stat_count (geom = "path", aes(y = ..count..)) |
geom_line (stat = "count", aes(y = ..count..)) geom_path (stat = "count", aes(y = ..count..)) |
||||
| 面グラフ(エリアプロット) | stat_count (geom = "area", aes(y = ..count..)) |
geom_area (stat = "count", aes(y = ..count..)) |
||||
| マーカー付き折れ線グラフ | stat_count (geom = "line", aes(y = ..count..)) + stat_count (geom = "point", aes(y = ..count..)) |
stat_count (geom = "line", aes(y = ..count..)) + stat_count (geom = "point", aes(y = ..count..)) |
||||
| 連続 | ヒストグラム | stat_bin (geom = "bar", aes(y = ..count..)) |
geom_histogram (stat = "bin", aes(y = ..count..)) geom_bar (stat = "bin", aes(y = ..count..)) |
|||
| 度数曲線 | geom_freqpoly (stat = "bin", aes(y = ..count..)) |
|||||
| ドットプロット | geom_dotplot (binaxis = "x") |
|||||
| 密度推定(線グラフ) | stat_density (geom = "line", aes(y = ..density..)) |
geom_density (stat = "density", aes(y = ..density..)) geom_line (stat = "density", aes(y = ..density..)) |
||||
| 密度推定(面グラフ) | stat_density (geom = "area", aes(y = ..density..)) |
geom_area (stat = "density", aes(y = ..density..)) |
||||
| 経験累積密度関数 | stat_ecdf (geom = "step", aes(y = ..y..)) |
geom_step (stat = "ecdf", aes(y = ..y..)) |
||||
| QQプロット | stat_qq (geom = "point", aes(x = ..theoretical.., y = ..sample..)) + stat_qq_line (geom = "path", aes(x = ..x.., y = ..y..)) |
geom_qq (geom = "point", aes(x = ..theoretical.., y = ..sample..)) + geom_qq_line (geom = "path", aes(x = ..x.., y = ..y..)) |
||||
| 2変数 | 離散 | 離散 | バブルチャート | stat_sum (geom = "point", aes(size = ..n..)) |
geom_count (stat = "sum", aes(size = ..n..)) geom_point (stat = "sum", aes(size = ..n..)) |
|
| ヒートマップ(タイル貼り) | stat_sum (geom = "tile", aes(fill = ..n..)) |
geom_tile (stat="sum", aes(fill = ..n..)) |
||||
| 離散 | 連続 | 箱ひげ図 | stat_boxplot (geom = "boxplot") |
geom_boxplot (stat = "boxplot") |
||
| バイオリンプロット | stat_ydensity (geom = "violin") |
geom_violin (stat = "ydensity") |
||||
| ドットプロット | geom_dotplot (binaxis = "y") |
|||||
| 連続 | 連続 | 散布図 | stat_identity (geom = "point") |
geom_point (stat = "identity") |
||
| 散布図(重複削除) | stat_unique (geom = "point") |
geom_point (stat = "unique") |
||||
| 2次元ヒストグラム(タイル貼り) | stat_bin_2d (geom = "tile", aes(fill = ..count..)) |
geom_bin2d (stat = "bin2d", aes(fill = ..count..)) geom_tile (stat = "bin2d", aes(fill = ..count..)) |
||||
| 六角形版2次元ヒストグラム(六角形タイル貼り) | stat_bin_hex (geom = "hex", aes(fill = ..count..)) |
geom_hex (stat = "binhex", aes(fill = ..count..)) |
||||
| 2次元密度推定(等高線プロット) | stat_density_2d (contour = TRUE, geom = "density_2d", contour_var = "density") stat_density_2d (contour = TRUE, geom = "contour", contour_var = "density") |
geom_density_2d (stat = "density_2d", contour = TRUE, contour_var = "density") geom_contour (stat = "density_2d", contour = TRUE, contour_var = "density") |
||||
| 2次元密度推定(タイル貼り) | stat_density_2d (contour = FALSE, geom = "tile", aes(fill = ..density..)) |
geom_tile (stat = "density_2d", contour = FALSE, aes(fill = ..density..)) |
||||
| 2次元密度推定(等高線塗りつぶし) | stat_density2d_filled (geom = "density_2d_filled", contour_var = "density") stat_density_2d_filled (geom = "contour_filled", contour_var = "density") |
geom_density_2d_filled (stat = "density_2d_filled", contour_var = "density") |
||||
| 確率楕円(信頼楕円) | stat_ellipse (geom = "path") |
geom_path (stat = "ellipse") |
||||
| 回帰(平滑化曲線) | stat_smooth (geom = "smooth") |
geom_smooth (stat = "smooth") |
||||
| 分位点回帰 | stat_quantile (geom = "quantile") |
geom_quantile (stat = "quantile") |
||||
| 3変数 | 連続 | 連続 | 連続 | 等高線プロット | stat_contour (geom = "contour") |
geom_contour (stat = "contour") |
| 等高線プロット(塗りつぶし) | stat_contour_filled (geom = "contour_filled", aes(fill = ..level..)) |
geom_contour_filled (stat = "contour_filled", aes(fill = ..level..)) |
||||
| 2変数 | 離散 | 連続 ・集計 |
棒グラフ | stat_summary (fun = ***, geom = "bar") |
geom_bar (stat = "summary", fun = ***) |
|
| エラーバー (pointrange) |
stat_summary (fun.data = ***, geom = "pointrange") |
geom_pointrange (stat = "summary", fun.data = ***) |
||||
| エラーバー (crossbar) |
stat_summary (fun.data = ***, geom = "crossbar") |
geom_crossbar (stat = "summary", fun.data = ***) |
||||
| エラーバー (errorbar) |
stat_summary (fun.data = ***, geom = "errorbar") |
geom_errorbar (stat = "summary", fun.data = ***) |
||||
| エラーバー (linerange) |
stat_summary (fun.data = ***, geom = "linerange") |
geom_linerange (stat = "summary", fun.data = ***) |
||||
| 連続 | 連続 ・集計 |
棒グラフ | stat_summary_bin (fun = ***, geom = "bar") |
geom_bar (stat= "summary_bin", fun = ***) |
||
| エラーバー | stat_summary_bin (fun.data = ***, geom = "pointrange") |
geom_pointrange (stat= "summary_bin", fun.data = ***) |
||||
| 3変数 | 連続 | 連続 | 連続 ・集計 |
ヒートマップ(タイル貼り) | stat_summary_2d (fun = ***, geom = "tile", aes(fill = ..value..)) |
geom_tile (stat = "summary_2d", fun = ***, aes(fill = ..value..)) |
| ヒートマップ(六角形貼り) | stat_summary_hex (fun = ***, geom = "hex", aes(fill = ..value..)) |
geom_hex (stat = "summary_hex", fun = ***, aes(fill = ..value..)) |
||||
| 関数 | 関数 | stat_function (fun = ***, geom = "function", aes(x = ..x.., y = ..y..)) |
geom_function (stat = "function", fun = ***, aes(x = ..x.., y = ..y..)) |
|||
| 注)太字はデフォルトの設定 |
参考文献
- https://ggplot2.tidyverse.org/
- https://github.com/tidyverse/ggplot2
- https://cran.r-project.org/web/packages/ggplot2/index.html
- https://rstudio.cloud/learn/cheat-sheets
- https://r-graphics.org/
- https://r4ds.had.co.nz/data-visualisation.html
- https://ropensci.github.io/plotly/ggplot2/index.html
- https://heavywatal.github.io/rstats/ggplot2.html
- https://yukiyanai.github.io/jp/classes/stat2/contents/R/intro-to-ggplot2.html
- https://www.jaysong.net/RBook/
- https://kazutan.github.io/fukuokaR11/intro_ggplot2.html
- https://triadsou.hatenablog.com/entry/20100528/1275042816
- https://qiita.com/swathci/items/b36e493ea78b03db0981
-
layer()関数のstat,geom引数に指定することもできます。ggplot(data = iris, aes(x = Species)) + layer(stat = "count", geom = "bar", position = "identity")のように書けます(position引数は省略できないようです)。 ↩ -
..count..,stat(count)は昔の書き方で、最新の書き方はafter_stat(count)ですが、ここではggplot2のチートシート(Cheat sheet)の書き方に合わせて..count..と書くことにします。以下も同様です。 ↩


