はじめに
前回作成した、*家族用todoリスト*を改良してグラフを描画してみました
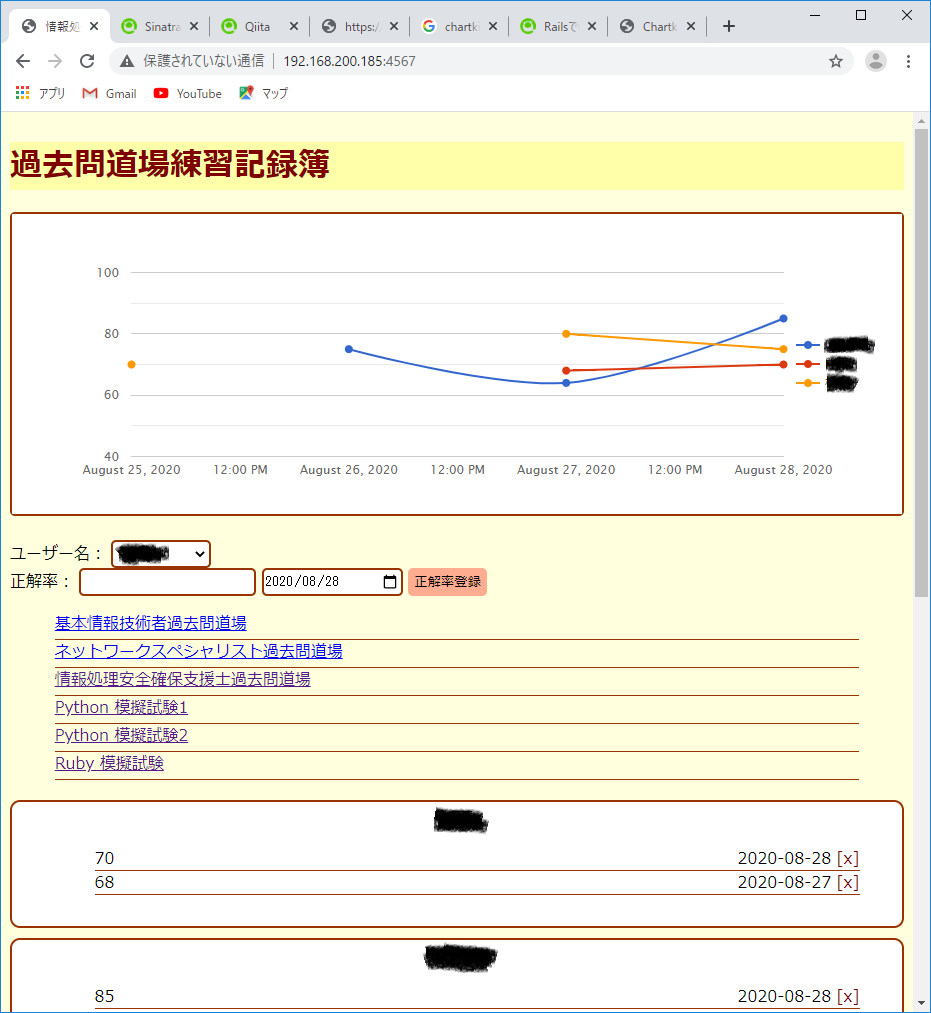
完成画面
設定
main.rb
require 'sinatra'
require 'sinatra/reloader'
require 'date'
require 'active_record'
require 'rack/csrf'
require 'chartkick'  # 追加
bash.sh
$ ls public/
chartkick.js  main.js  style.css
publicにchartkick.jsを仕込みます
ソース
main.rb
get '/' do
  con = ActiveRecord::Base.connection
  dat = con.execute("select users.name, scores.score, scores.point from users inner join scores on users.id = scores.user_id where scores.flag=0 order by users.name, scores.point")
  h = {name: '', data: {}}
  @graph_data = []
  tname = ''
  dat.each do |x|
    if x["name"] == tname
      h[:data][x["point"]] = x["score"]
    else
      tname = x["name"]
      if h[:name] != ''
        @graph_data << h.dup
      end
      h[:name] = x["name"]
      h[:data] = {}
      h[:data][x["point"]] = x["score"]
    end
  end
  @graph_data << h.dup
  erb :index
end
本来は、ActiveRecordをうまく使わないといけないのでしょうが、SQL直打ちでデータを取得します。
index.erb
<%= line_chart @graph_data, min: 40, max: 100 %>
綺麗に描画されているのは、gemのおかげです。
まとめ
- Chartkick の作者さんありがとうございます
- Sinatra でグラフを描画した
参照したサイト
Create beautiful JavaScript charts with one line of Ruby
RailsでChartkickを使ったグラフの実装(簡単だけど、かゆい所に手が届かない) -- Qiita
Railsでシンプルなグラフを扱うならchart-js-rails よりchartkickを使うべし -- Qiita