Railsでグラフを扱う方法として chart-js-rails を使った方法を こちらの記事で解説しました。
一方、シンプルなグラフを埋め込む場合においては chartkick を使ったほうが簡単なことがわかったので本記事で解説します。
chartkickとは
chart.jsをいい感じにラッピングして、ワンラインでグラフを埋め込めるようにするプロジェクトです。
Rubyに限らず様々な言語で実装されています。
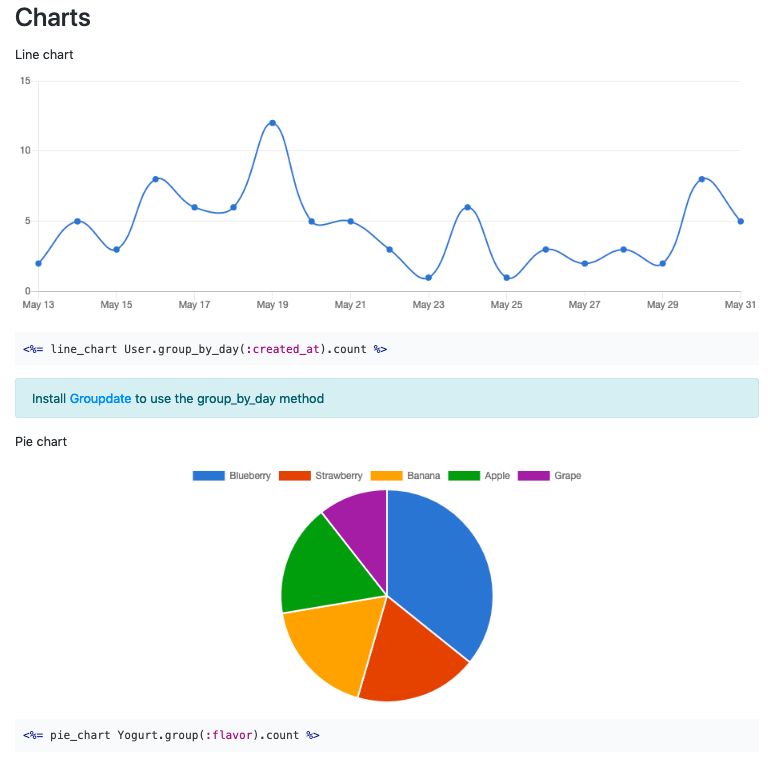
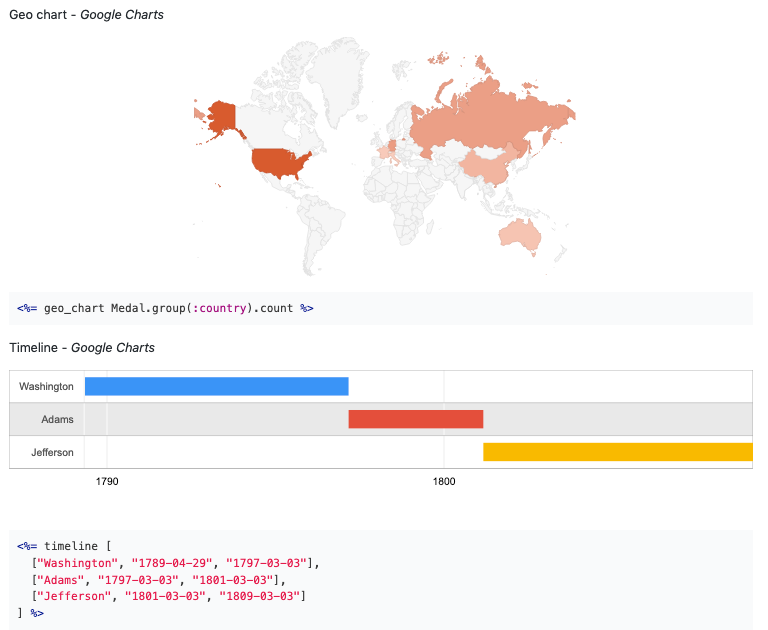
また、chart.jsだけでなくGoogle ChartsやHighchartsもサポートしています。
chartkickを使ったほうが良い理由
RubyとJavascript間のデータの受け渡しを意識しなくて良い
こちらの記事の方法だと、Ruby側で扱う数値を何らかの方法でJavascriptで受け渡す必要がありました。
chartkickの場合はデータを配列にしてRubyのメソッドへ渡すだけなので、Ruby側のみで実装が完結します。
githubのスターの数が多い
あくまでgemで比較した場合ですが、chartkickの方が断然スターが多いです。
直近のコミット日時もchartkickの方が新しいです。
Rails6にも対応している
Ruby on Rails6からデフォルトのJavascriptコンパイラがWebpackerとなります。
おそらく、chart-js-rails をRails6で使おうとすると若干の手間がかかると推測されます。
実際に使ってみる
サンプルアプリケーションを作る
今回は時事ネタとして「ラグビーワールドカップ開催国」に関する情報をグラフ化します。
以下コマンドを実行してアプリケーションを作成します。
$ rails new chartkick_sample
$ rails g scaffold rugby_world_cup_host_country name:string total_attendance:integer matches:integer stadium_capacity:integer held_at:datetime
db/seeds.rb へ Wikipediaを参考にラグビーワールドカップの開催国を入力します。
※厳密には1991年と1987年にも開催されているのですが、開催国が複数あってDB構造が複雑化するので今回は1995年以降のみ入力しました。
[
  [1995, 'South Africa', 1100000, 32, 1423850],
  [1999, 'Wales', 1750000, 41, 2104500],
  [2003, 'Australia', 1837547, 48, 2208529],
  [2007, 'France', 2263223, 48, 2470660],
  [2011, 'New Zealand', 1477294, 48, 1732000],
  [2015, 'England', 2477805, 48, 2600741],
  [2019, 'Japan', nil, 48, nil],
  [2023, 'France', nil, 48, nil],
].each do |record|
  RugbyWorldCupHostCountry.create(
    held_at: Time.zone.local(record[0]),
    name: record[1],
    total_attendance: record[2],
    matches: record[3],
    stadium_capacity: record[4]
  )
end
入力が終わったらDBの作成・マイグレーション・seedを実行します。
rails db:create db:migrate db:seed
http://localhost:3000/rugby_world_cup_host_countries へアクセスすると、一覧が表示されました。
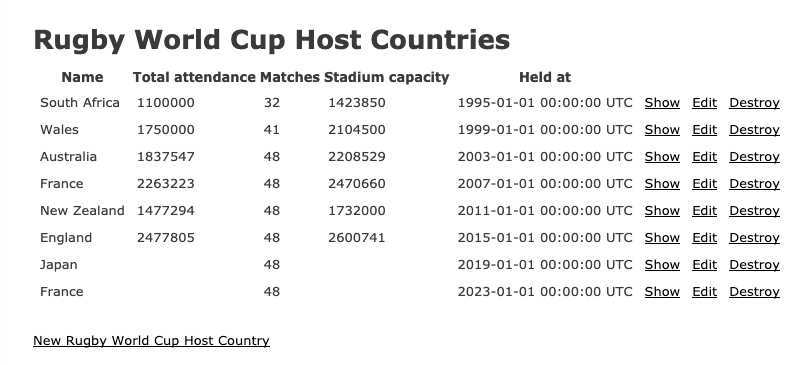
グラフを表示する
chartkickのインストール
Gemfileに追記して、bundle install します。
続けて yarn add も実行してしまいましょう。
・・・省略・・・
gem 'bootsnap', '>= 1.4.2', require: false
gem "chartkick" # 追記

group :development, :test do
  # Call 'byebug' anywhere in the code to stop execution and get a debugger console
  gem 'byebug', platforms: [:mri, :mingw, :x64_mingw]
end
・・・省略・・・
$ bundle install
ここからはRails6以降かRails5以前かで手順が分かれます。
Rails6以降
yarnでchart.jsをインストールします。
$ yarn add chartkick chart.js
application.js で chart.js と chartkick をrequireします。
require("@rails/ujs").start()
require("turbolinks").start()
require("@rails/activestorage").start()
require("channels")

require("chartkick") // 追記
require("chart.js") // 追記
Rails5以前
application.js へ以下を追記します。
//= require chartkick
//= require Chart.bundle
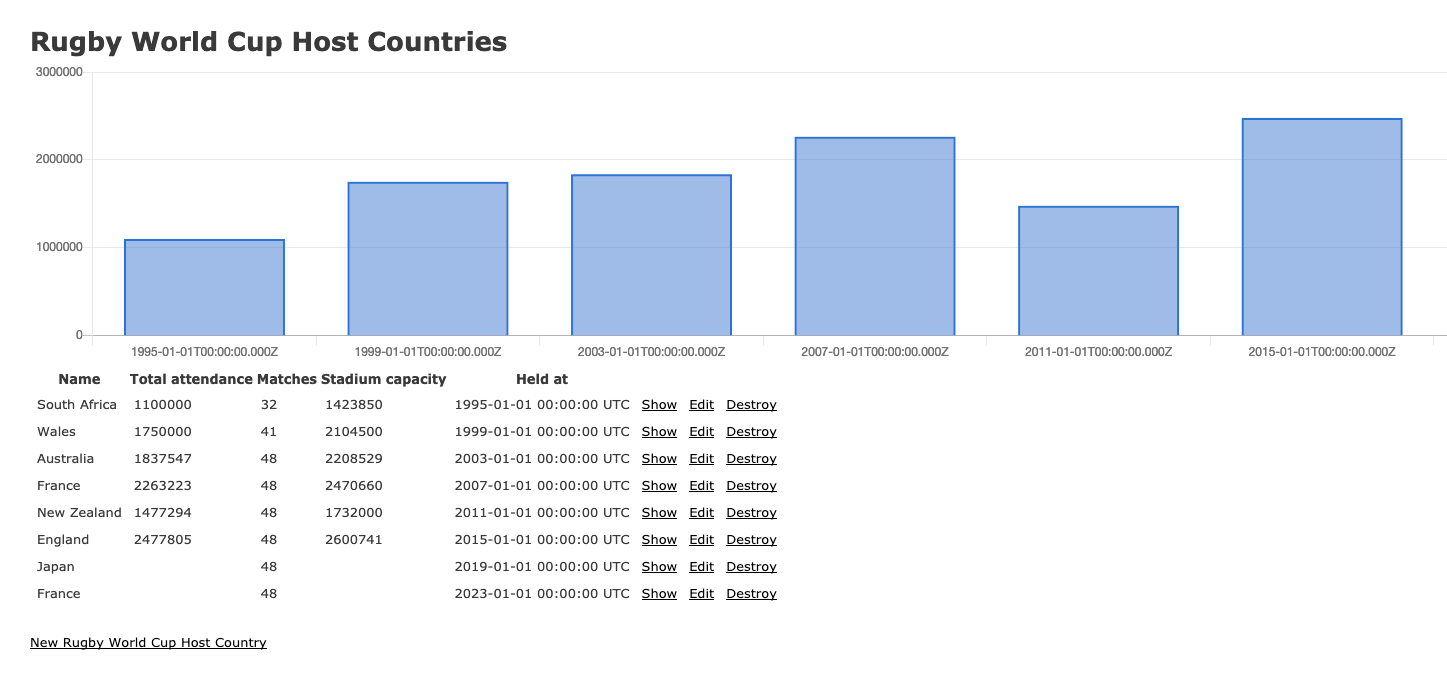
グラフの実装
開催国一覧ページにグラフを埋め込みます。
<p id="notice"><%= notice %></p>

<h1>Rugby World Cup Host Countries</h1>

<%= column_chart RugbyWorldCupHostCountry.pluck(:held_at, :total_attendance) %><!-- 追記 -->

<table>
  <thead>
    <tr>
      <th>Name</th>
      <th>Total attendance</th>
      <th>Matches</th>
      <th>Stadium capacity</th>
      <th>Held at</th>
      <th colspan="3"></th>
    </tr>
  </thead>
・・・省略・・・
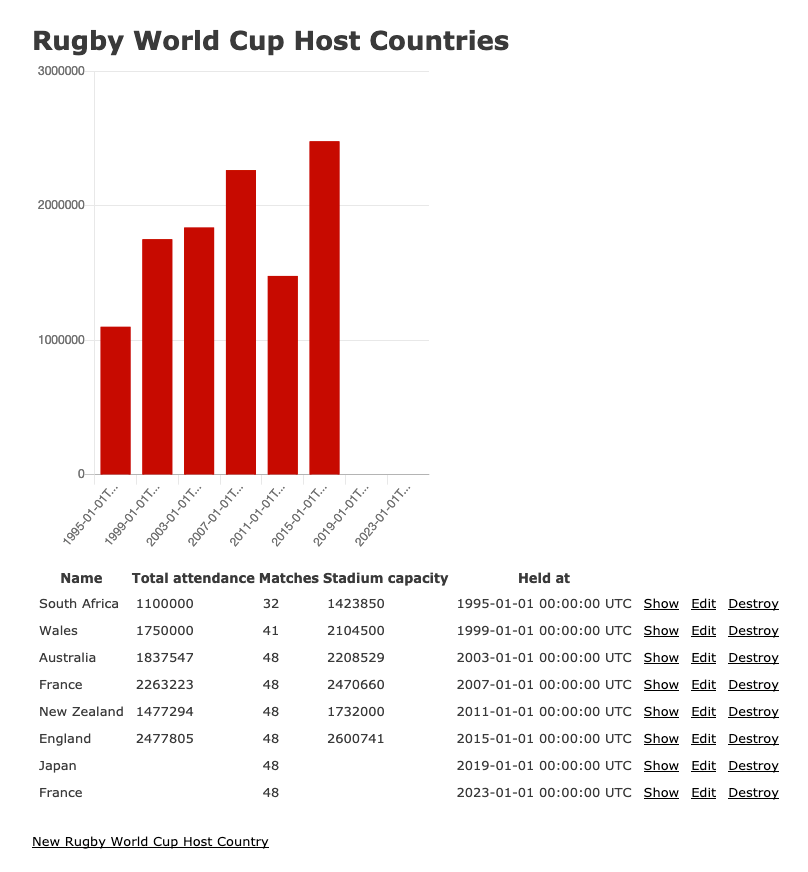
http://localhost:3000/rugby_world_cup_host_countries へアクセスするとグラフが表示されます。
オプションを指定すれば色やサイズも変えられます。
<p id="notice"><%= notice %></p>

<h1>Rugby World Cup Host Countries</h1><!-- 追記 -->

<%= column_chart RugbyWorldCupHostCountry.pluck(:held_at, :total_attendance),
                 id: 'total-attendance-chart',
                 width: '400px',
                 height: '500px',
                 colors: ['#b00'] %><!-- 追記 -->

<table>
  <thead>
    <tr>
      <th>Name</th>
      <th>Total attendance</th>
      <th>Matches</th>
      <th>Stadium capacity</th>
      <th>Held at</th>
      <th colspan="3"></th>
    </tr>
  </thead>
・・・省略・・・
chartkickでできそうにないこと
現時点で実現方法がわからなかったことを記載しておきます。
実現方法をご存知な方はぜひコメントをお願いします。
- 2軸のグラフを表示する
- 2種類のグラフ(折れ線グラフと棒グラフなど)を1つのグラフとして表示する
まとめ
RubyとJavascript間の値の受け渡しを意識しなくて良いですし、なにより1行でグラフを埋め込めるのが素晴らしいです。
Railsでシンプルなグラフを出力したい方はぜひ使ってみてください。