(※2019/09/27 追記)
シンプルなグラフを埋め込むのであれば chartkick を利用したほうが簡単に実現できそうなので
以下の記事も参照ください。
Railsでシンプルなグラフを扱うならchart-js-rails よりchartkickを使うべし
Railsで作成したアプリにグラフを組込みたいと思い、幾つかの方法を調べた結果、chart.jsを使ってみることにしました。
chart.jsとは
キレイなグラフを簡単に組み込むことのできるライブラリです。 ".js"とある通り、Javascriptで実装されています。
公式サイトにはいくつかサンプルが掲載されています。
使用する環境
$ ruby -v
ruby 2.4.2p198 (2017-09-14 revision 59899) [x86_64-darwin16]
$ rails -v
Rails 5.1.4
Railsアプリの作成
まずはいつも通りRailsアプリを作成します。
$ rails new chart_js_sample
Railsでchart.jsを使用するためにはchart-js-railsというgemを使用します。Gemfileに以下の通り追記しましょう。
# Use CoffeeScript for .coffee assets and views
gem 'coffee-rails', '~> 4.2'
# Turbolinks makes navigating your web application faster. Read more: https://github.com/turbolinks/turbolinks
gem 'turbolinks', '~> 5'
# Build JSON APIs with ease. Read more: https://github.com/rails/jbuilder
gem 'jbuilder', '~> 2.5'
# Use Redis adapter to run Action Cable in production
# gem 'redis', '~> 3.0'
# Use ActiveModel has_secure_password
# gem 'bcrypt', '~> 3.1.7'

# Use Capistrano for deployment
# gem 'capistrano-rails', group: :development

gem 'chart-js-rails', '~> 0.1.4' ←★追記

group :development, :test do
  # Call 'byebug' anywhere in the code to stop execution and get a debugger console
  gem 'byebug', platforms: [:mri, :mingw, :x64_mingw]
  # Adds support for Capybara system testing and selenium driver
  gem 'capybara', '~> 2.13'
  gem 'selenium-webdriver'
end
追記したらインストールします。
$ bundle install
サンプル用のコントローラとビューを作っておきましょう。
$ rails g controller chart_sample index
chart.jsをインストール
package.jsonに以下の通り追記してインストールします。
{
  "name": "chart_js_sample",
  "private": true,
  "dependencies": {
    "chart.js": "^2.7.1" ←★追記
  }
}
$ yarn install
Railsアプリがライブラリを読み込めるようにします。
//= require Chart.min ←★追記
//= require rails-ujs
//= require turbolinks
//= require_tree .
グラフの組み込み
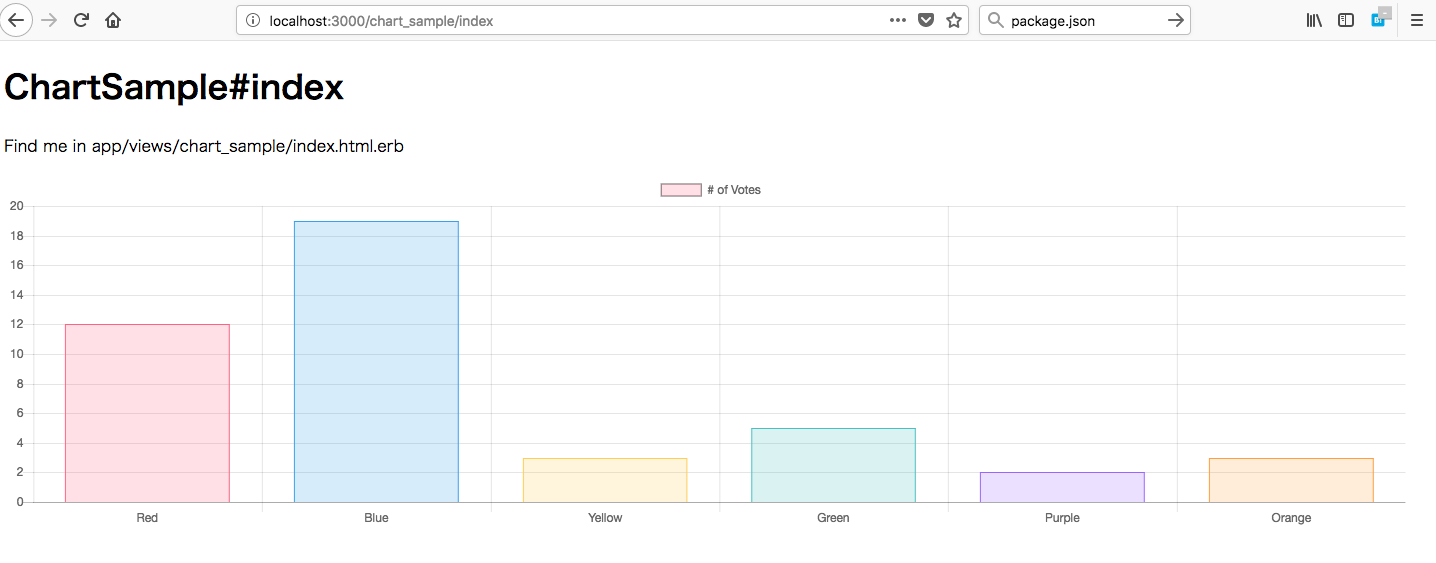
まず最初は、Get Startedに記載されているサンプルをそのまま組み込んでみましょう。
<h1>ChartSample#index</h1>
<p>Find me in app/views/chart_sample/index.html.erb</p>

<canvas id="myChart" width="400" height="400"></canvas> ←★追記
<script>draw_graph();</script> ←★追記
Javascript部分はCoffeeScriptに変換します。windows直下のfunctionとして定義するのがミソ。
window.draw_graph = ->
    ctx = document.getElementById("myChart").getContext('2d')
    myChart = new Chart(ctx, {
        type: 'bar',
        data: {
            labels: ["Red", "Blue", "Yellow", "Green", "Purple", "Orange"],
            datasets: [{
                label: '# of Votes',
                data: [12, 19, 3, 5, 2, 3],
                backgroundColor: [
                    'rgba(255, 99, 132, 0.2)',
                    'rgba(54, 162, 235, 0.2)',
                    'rgba(255, 206, 86, 0.2)',
                    'rgba(75, 192, 192, 0.2)',
                    'rgba(153, 102, 255, 0.2)',
                    'rgba(255, 159, 64, 0.2)'
                ],
                borderColor: [
                    'rgba(255,99,132,1)',
                    'rgba(54, 162, 235, 1)',
                    'rgba(255, 206, 86, 1)',
                    'rgba(75, 192, 192, 1)',
                    'rgba(153, 102, 255, 1)',
                    'rgba(255, 159, 64, 1)'
                ],
                borderWidth: 1
            }]
        },
        options: {
            scales: {
                yAxes: [{
                    ticks: {
                        beginAtZero:true
                    }
                }]
            }
        }
    })
動作確認
Raisアプリを起動して、ブラウザでhttp://localhost:3000/chart_sample/indexへアクセスするとグラフが描画されます。
$ rails s
カスタマイズしてみる
グラフの大きさを変更
400px × 400pxだとサイズが大きすぎるので変更する。HTMLのcanvas要素の属性を変更する。
<h1>ChartSample#index</h1>
<p>Find me in app/views/chart_sample/index.html.erb</p>

<canvas id="myChart" width="200" height="100"></canvas> ←★追記
<script>draw_graph();</script> ←★追記
ブラウザで確認すると指定したサイズで描画されています。
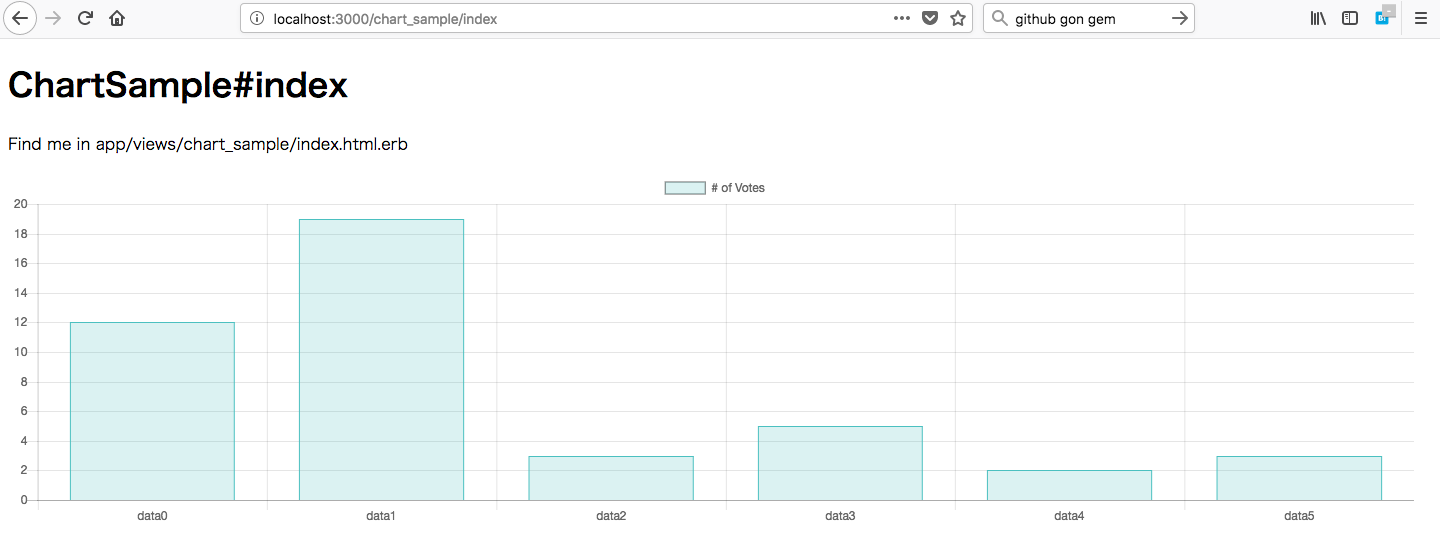
グラフの色を変更
グラフのバーの色を全て緑にします。
バーの数だけfor文で繰り返して、backGroundColorとborderColorを緑色に指定しましょう。
window.draw_graph = ->
    ctx = document.getElementById("myChart").getContext('2d')
    barNum = 6
    labels = new Array(barNum)
    bgColors = new Array(barNum)
    bdColors = new Array(barNum)
    for i in [0...barNum]
        labels[i] = 'data' + i
        bgColors[i] = 'rgba(75, 192, 192, 0.2)'
        bdColors[i] = 'rgba(75, 192, 192, 1)'
    myChart = new Chart(ctx, {
        type: 'bar',
        data: {
            labels: labels
            datasets: [{
                label: '# of Votes',
                data: [12, 19, 3, 5, 2, 3],
                backgroundColor: bgColors,
                borderColor: bdColors,
                borderWidth: 1
            }]
        },
        options: {
            scales: {
                yAxes: [{
                    ticks: {
                        beginAtZero:true
                    }
                }]
            }
        }
    })
グラフのデータをRailsのコントローラ側から渡す
gonというgemを追加してRailsのコントローラ側から値を渡すようにします。
# Use CoffeeScript for .coffee assets and views
gem 'coffee-rails', '~> 4.2'
# Turbolinks makes navigating your web application faster. Read more: https://github.com/turbolinks/turbolinks
gem 'turbolinks', '~> 5'
# Build JSON APIs with ease. Read more: https://github.com/rails/jbuilder
gem 'jbuilder', '~> 2.5'
# Use Redis adapter to run Action Cable in production
# gem 'redis', '~> 3.0'
# Use ActiveModel has_secure_password
# gem 'bcrypt', '~> 3.1.7'

# Use Capistrano for deployment
# gem 'capistrano-rails', group: :development

gem 'chart-js-rails', '~> 0.1.4'
gem 'gon', '~> 6.2.0' ←★追記

group :development, :test do
  # Call 'byebug' anywhere in the code to stop execution and get a debugger console
  gem 'byebug', platforms: [:mri, :mingw, :x64_mingw]
  # Adds support for Capybara system testing and selenium driver
  gem 'capybara', '~> 2.13'
  gem 'selenium-webdriver'
end
$ bundle install
gonを使用するためにapplication.html.erbへ追記します。
<!DOCTYPE html>
<html>
  <head>
    <title>ChartJsSample</title>
    <%= csrf_meta_tags %>

    <%= Gon::Base.render_data %> ←★追記
    <%= stylesheet_link_tag    'application', media: 'all', 'data-turbolinks-track': 'reload' %>
    <%= javascript_include_tag 'application', 'data-turbolinks-track': 'reload' %>
  </head>

  <body>
    <%= yield %>
  </body>
</html>
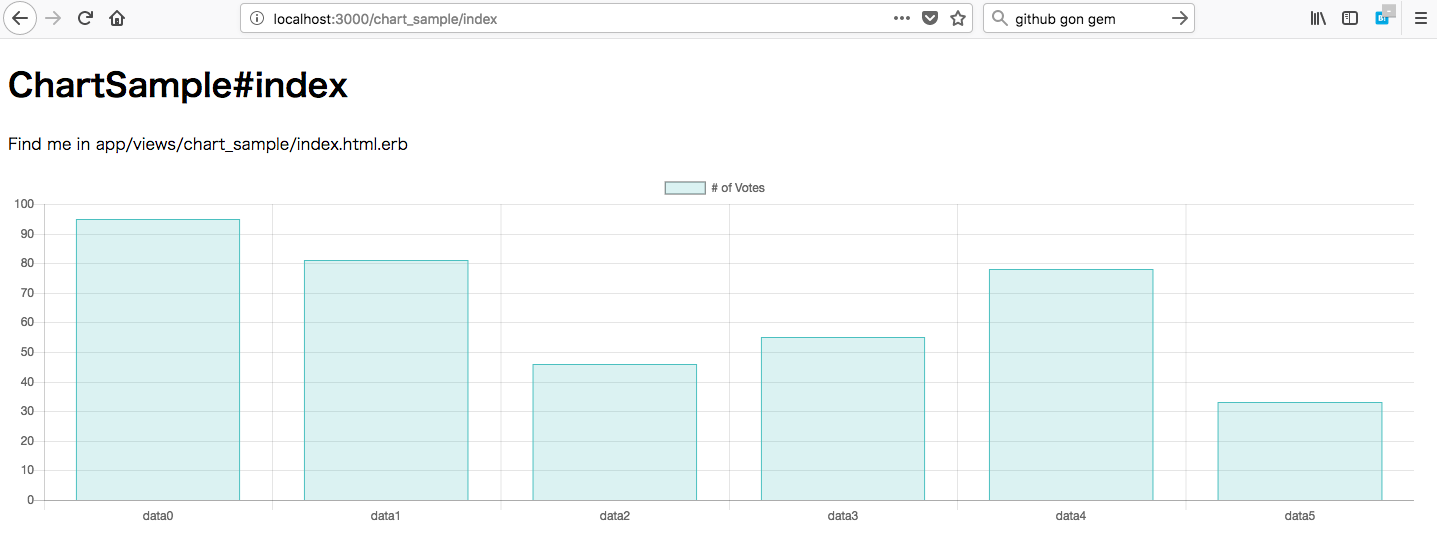
コントローラ側で値を設定します。今回は最大100.0の乱数としました。
class ChartSampleController < ApplicationController
  def index
    gon.data = []
    6.times do
      gon.data << rand(100.0)
    end
  end
end
CoffeeScript側で値をグラフに埋め込みます。
window.draw_graph = ->
    ctx = document.getElementById("myChart").getContext('2d')
    barNum = 6
    labels = new Array(barNum)
    bgColors = new Array(barNum)
    bdColors = new Array(barNum)
    for i in [0...barNum]
        labels[i] = 'data' + i
        bgColors[i] = 'rgba(75, 192, 192, 0.2)'
        bdColors[i] = 'rgba(75, 192, 192, 1)'
    myChart = new Chart(ctx, {
        type: 'bar',
        data: {
            labels: labels
            datasets: [{
                label: '# of Votes',
                data: gon.data, ←★修正
                backgroundColor: bgColors,
                borderColor: bdColors,
                borderWidth: 1
            }]
        },
        options: {
            scales: {
                yAxes: [{
                    ticks: {
                        beginAtZero:true
                    }
                }]
            }
        }
    })
グラフの値がページ更新のたびに変化します。
折れ線グラフを追加する
chart.jsではVer.2より2種類以上のグラフを同時に描画可能となっています。今回は棒グラフに加えて折れ線グラフを追加してみます。
CoffeeScriptとControllerを修正します。
window.draw_graph = ->
    ctx = document.getElementById("myChart").getContext('2d')
    barNum = 6
    labels = new Array(barNum)
    bgColors = new Array(barNum)
    bdColors = new Array(barNum)
    for i in [0...barNum]
        labels[i] = 'data' + i
        bgColors[i] = 'rgba(75, 192, 192, 0.2)'
        bdColors[i] = 'rgba(75, 192, 192, 1)'
    myChart = new Chart(ctx, {
        type: 'bar',
        data: {
            datasets: [{
                label: '# of Votes',
                data: gon.bardata,
                backgroundColor: bgColors,
                borderColor: bdColors,
                borderWidth: 1
            }, {
                label: 'Line Dataset',
                data: gon.linedata,
                type: 'line'
            }],
            labels: labels,
        },
        options: {
            scales: {
                yAxes: [{
                    ticks: {
                        beginAtZero:true
                    }
                }]
            }
        }
    })
class ChartSampleController < ApplicationController
  def index
    sum = 0
    gon.bardata = []
    gon.linedata = []
    6.times do |i|
      data = rand(100.0)
      gon.bardata << data
      sum = sum + data
      gon.linedata << sum
    end
  end
end
折れ線グラフが追加されます。


