!pip install japanize-matplotlib
import matplotlib.pyplot as plt
import japanize_matplotlib
import numpy
from scipy.stats import norm
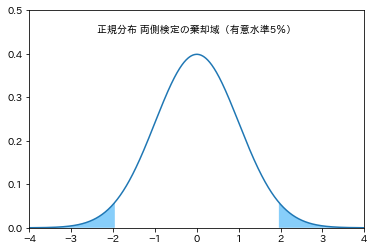
a_05, a_95 = norm.interval(alpha=0.95)
x_value = 4
x = numpy.linspace(x_value * -1 , x_value, 1000)
x_95 = numpy.linspace(a_95, x_value, 100)
x_05 = numpy.linspace(x_value * -1, a_05, 100)
plt.plot(x, norm.pdf(x))
plt.fill_between(x_95, 0, norm.pdf(x_95), facecolor='lightskyblue', alpha=1)
plt.fill_between(x_05, 0, norm.pdf(x_05), facecolor='lightskyblue', alpha=1)
plt.text(0, 0.45, r'正規分布 両側検定の棄却域(有意水準5%)',horizontalalignment='center')
plt.xlim(x_value * -1, x_value)
plt.ylim(0, 0.5)
plt.show()