leafletとは
javascriptで地図表示をやってくれるライブラリです。
https://leafletjs.com/index.html
タイルについて
ウェブで一般的な地図アプリケーションでは地図の画像をタイル状に敷き詰めて表示しています。leafletも同様に地図タイルを取得して表示するように作られていますので、無償または有償で提供されているタイルを利用して表示することができます。
Open Street Mapなど、無料で利用可能なタイル一覧を以下で確認することが出来ます
https://leaflet-extras.github.io/leaflet-providers/preview/
また、mapboxなどの地図APIサービスのタイルを利用することも出来ます。mapboxを使用する場合はアカウントを作ってAPI-keyを生成して使う必要があります。
https://docs.mapbox.com/vector-tiles/reference/
1. 地図を表示する
以下の4つを記載するだけです。
1. leafletのCSSを読み込む
<link rel="stylesheet" href="https://unpkg.com/leaflet@1.7.1/dist/leaflet.css"
   integrity="sha512-xodZBNTC5n17Xt2atTPuE1HxjVMSvLVW9ocqUKLsCC5CXdbqCmblAshOMAS6/keqq/sMZMZ19scR4PsZChSR7A=="
   crossorigin=""/>
2. leafletのjavascriptコードを読み込む
これは上記のCSSの読み込みの後に書かないといけないようです
<script src="https://unpkg.com/leaflet@1.7.1/dist/leaflet.js"
   integrity="sha512-XQoYMqMTK8LvdxXYG3nZ448hOEQiglfqkJs1NOQV44cWnUrBc8PkAOcXy20w0vlaXaVUearIOBhiXZ5V3ynxwA=="
   crossorigin=""></script>
3. 地図を表示する場所にタグを書く
<div id="mapid"></div>
4. 地図の表示幅を設定する
#mapid { height: 180px; }
まとめて書くとこんな感じ
以下ではOSMのタイルを利用しています
<!DOCTYPE html>
<html lang="ja" dir="ltr">
<head>
<meta charset="utf-8">
<title>Leafletデモ</title>
</head>
<body>
<div id="mapid"></div>
</body>
</html>
<link rel="stylesheet" href="https://unpkg.com/leaflet@1.3.1/dist/leaflet.css" integrity="sha512Rksm5RenBEKSKFjgI3a41vrjkw4EVPlJ3+OiI65vTjIdo9brlAacEuKOiQ5OFh7cOI1bkDwLqdLw3Zg0cRJAAQ==" crossorigin="" />
<script src="https://unpkg.com/leaflet@1.3.1/dist/leaflet.js" integrity="sha512-/Nsx9X4HebavoBvEBuyp3I7od5tA0UzAxs+j83KgC8PU0kgB4XiK4Lfe4y4cgBtaRJQEIFCW+oC506aPT2L1zw==" crossorigin=""></script>
<style media="screen">
#mapid {
height: 500px;
}
</style>
<script type="text/javascript">
//地図の中心地を定義
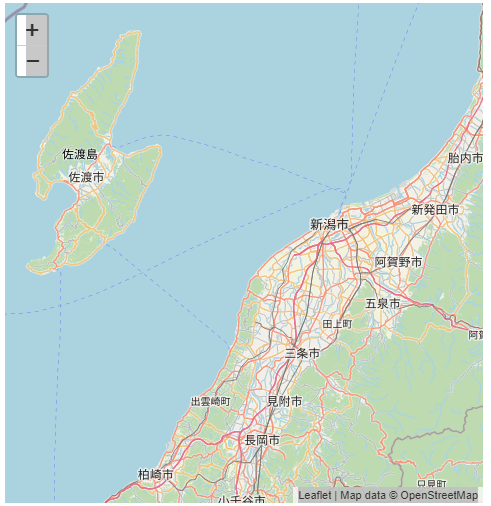
var mymap = L.map('mapid').setView([37.85, 138.8], 9);
//タイルレイヤーを取得
L.tileLayer('https://{s}.tile.openstreetmap.org/{z}/{x}/{y}.png', {
attribution: 'Map data © <a href="https://openstreetmap.org">OpenStreetMap</a>',
maxZoom: 18}).addTo(mymap);
</script>
2. 要素を足す
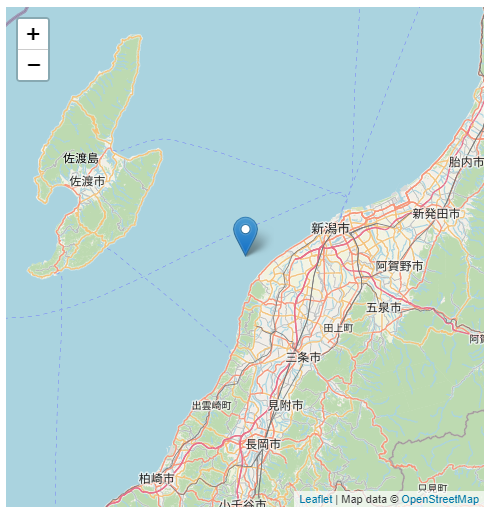
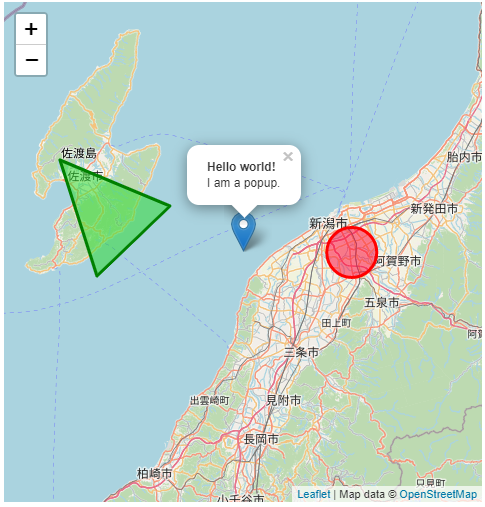
マーカーを置く
var marker = L.marker([37.85, 138.8]).addTo(mymap);
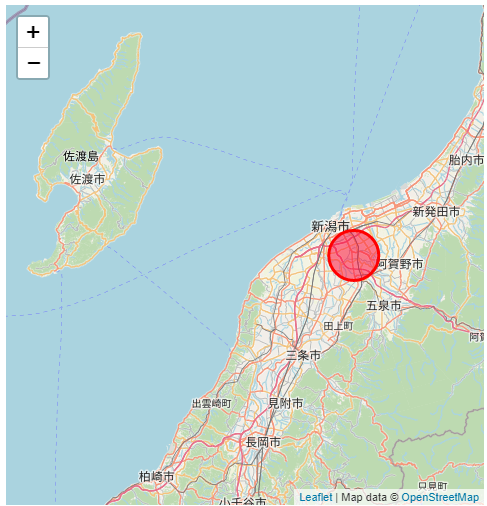
サークルを描く
  var circle = L.circle([37.85, 139.1], {
    color: 'red',
    fillColor: '#f03',
    fillOpacity: 0.5,
    radius: 6000
  }).addTo(mymap);
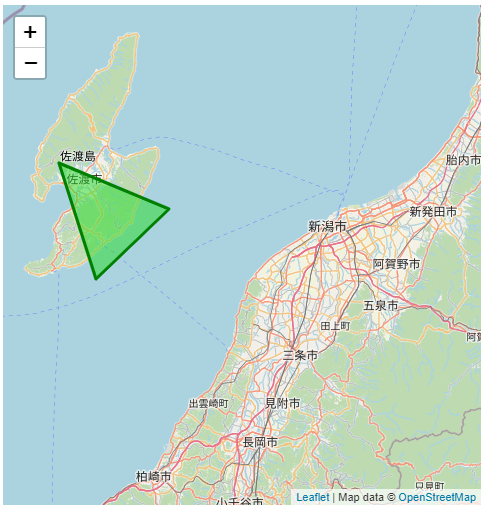
ポリゴンを描く
geo_array = [[37.95, 138.6], [38.05, 138.3], [37.80, 138.4]]
var polygon = L.polygon(geo_array, {
          color: 'green',
          fillColor: '#25dc25',
          fillOpacity: 0.5}).addTo(mymap);
3. ポップアップを付ける
配置した部品に付ける
marker.bindPopup("<b>Hello world!</b><br>I am a popup.").openPopup();
circle.bindPopup("I am a circle.");
polygon.bindPopup("I am a polygon.");
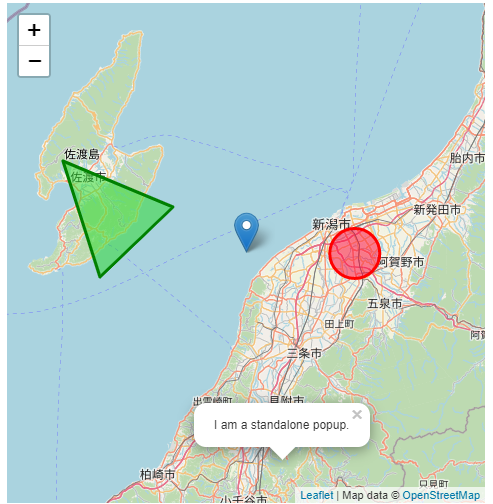
マップ上の座標に付ける
var popup = L.popup()
  .setLatLng([37.4, 138.9])
  .setContent("I am a standalone popup.")
  .openOn(mymap);
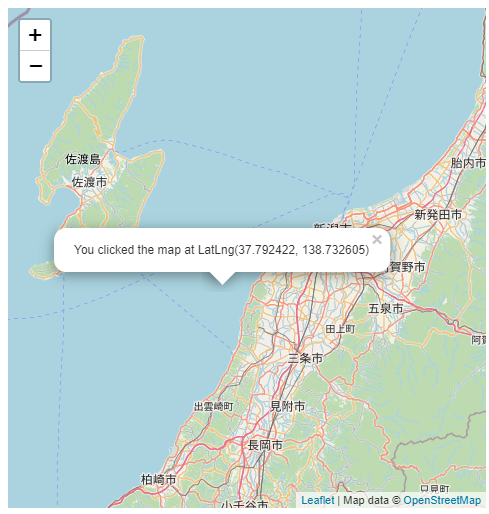
イベントに対応して付ける
以下のようにクリックイベントが発生したらポップアップを呼ぶこともできます
var popup = L.popup();
function onMapClick(e) {
    popup
        .setLatLng(e.latlng)
        .setContent("You clicked the map at " + e.latlng.toString())
        .openOn(mymap);
}
mymap.on('click', onMapClick);
4. GeoJSONを使う
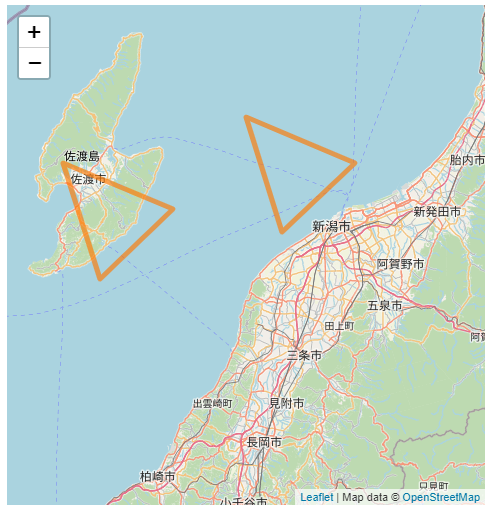
ポリゴン座標をJSONでまとめて渡すことも出来ます。
GeoJSONという書式があって、その通りに書いて渡すだけです。
https://leafletjs.com/examples/geojson/
GeoJSON Specification (RFC 7946)
https://tools.ietf.org/html/rfc7946
var myLines = [{
    "type": "LineString",
    "coordinates": [[138.6, 37.95], [138.3, 38.05], [138.4, 37.80], [138.6, 37.95]]
}, {
    "type": "LineString",
    "coordinates": [[139.1, 38.05], [138.8, 38.15], [138.9, 37.90], [139.1, 38.05]]
}];

var myStyle = {
    "color": "#ff7800",
    "weight": 5,
    "opacity": 0.65
};

L.geoJSON(myLines, {
    style: myStyle
}).addTo(mymap);
色を指定する
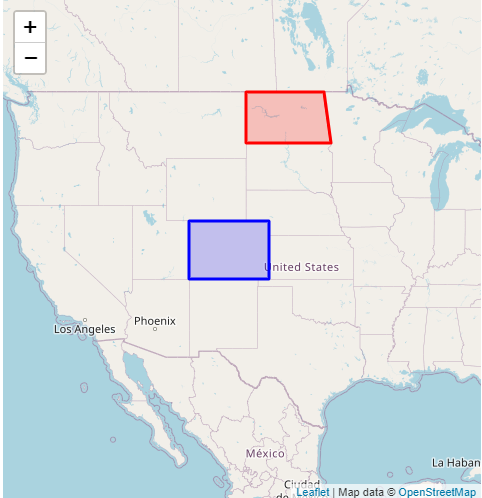
L.geoJSONクラスを定義する際に色を指定すればその色で塗ってくれます。
  var states = [{
    "type": "Feature",
    "properties": {"party": "Republican"},
    "geometry": {
        "type": "Polygon",
        "coordinates": [[
            [-104.05, 48.99],
            [-97.22,  48.98],
            [-96.58,  45.94],
            [-104.03, 45.94],
            [-104.05, 48.99]
        ]]
    }
}, {
    "type": "Feature",
    "properties": {"party": "Democrat"},
    "geometry": {
        "type": "Polygon",
        "coordinates": [[
            [-109.05, 41.00],
            [-102.06, 40.99],
            [-102.03, 36.99],
            [-109.04, 36.99],
            [-109.05, 41.00]
        ]]
    }
}];

L.geoJSON(states, {
    style: function(feature) {
        switch (feature.properties.party) {
            case 'Republican': return {color: "#ff0000"};
            case 'Democrat':   return {color: "#0000ff"};
        }
    }
}).addTo(mymap);
5. コロプレス図を作る
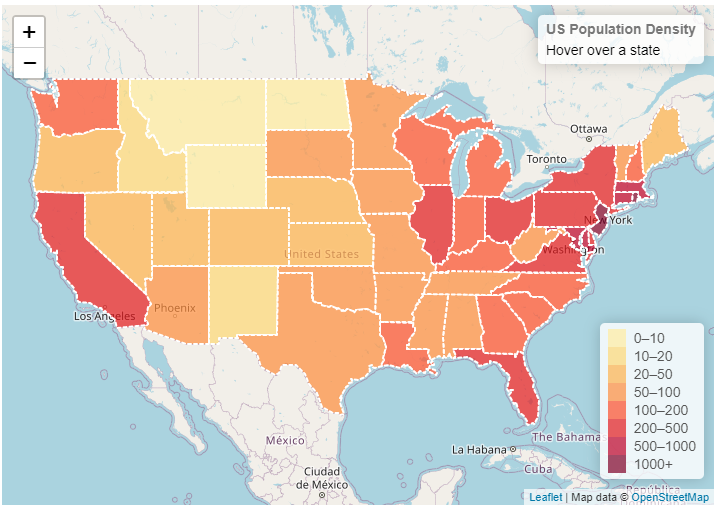
地図にヒートマップを表示するアレです
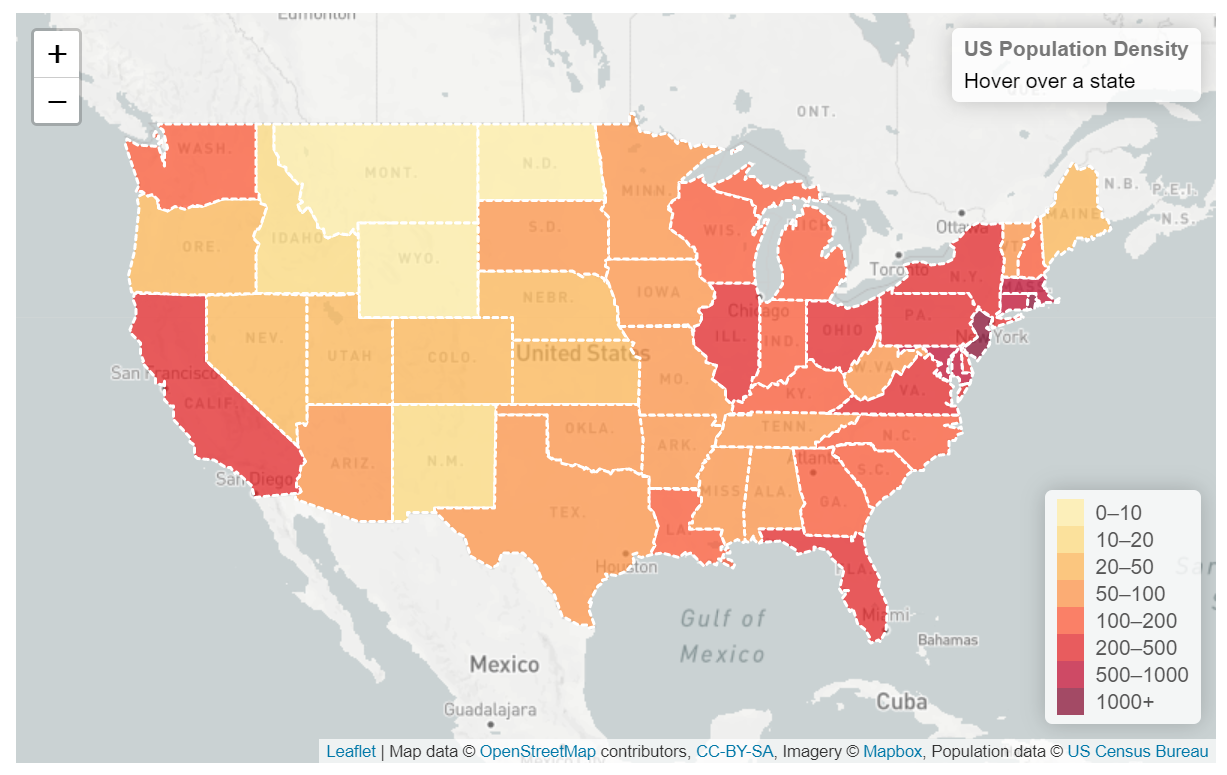
手順は以下のチュートリアルのものを参照しています
https://leafletjs.com/examples/choropleth/
使用するgeoJSONファイル(us-states.js)は以下のような配置になっています。
{
    "type": "Feature",
    "properties": {
        "name": "Alabama",
        "density": 94.65
    },
    "geometry": ...
    ...
}
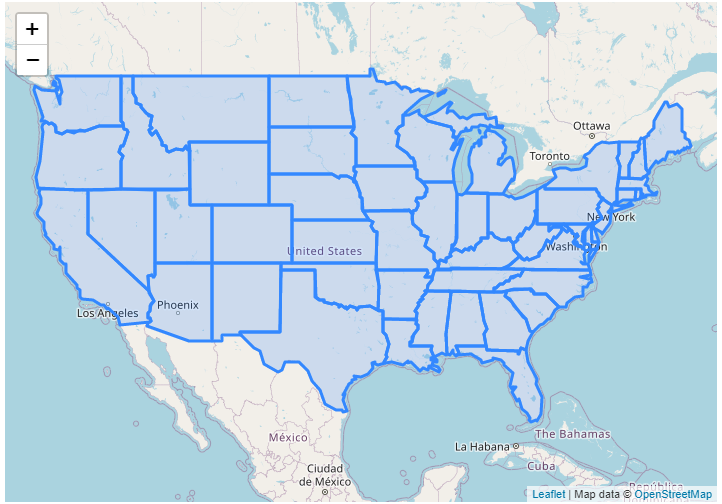
geoJSONを表示する
上記のus-states.jsをhtmlと同じフォルダに置いて読み込んで使います
<script src="us-states.js"></script>
<script type="text/javascript">
//地図の中心地を定義
var mymap = L.map('mapid').setView([37.8, -96], 4);
//タイルレイヤーを取得
L.tileLayer('https://{s}.tile.openstreetmap.org/{z}/{x}/{y}.png', {
attribution: 'Map data © <a href="https://openstreetmap.org">OpenStreetMap</a>',
maxZoom: 18}).addTo(mymap);
//"https://leafletjs.com/examples/choropleth/us-states.js"
L.geoJson(statesData).addTo(mymap);
</script>
色をつける
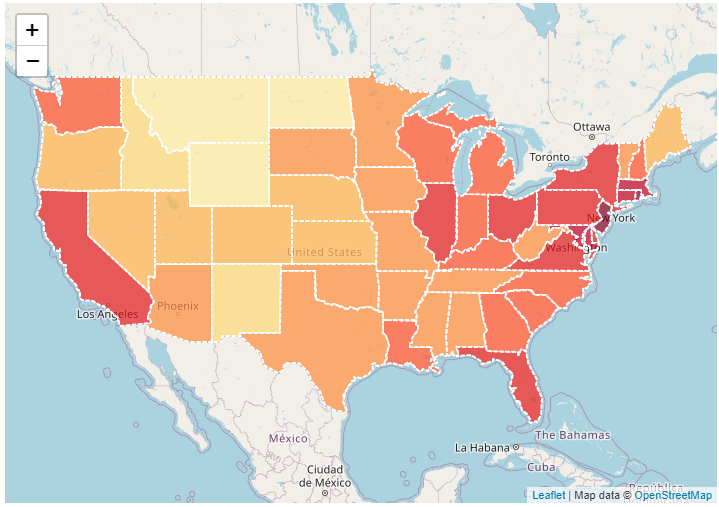
色や不透明度などを変更するにはL.geoJson()の第2引数にstyleを含むオプションを与えますが、ここに関数を書くことでgeoJSONの各feature内の値を参照して色を付けることが出来ます。以下ではfeature.properties.densityをfillColor()に渡して値を色に変換しています。
  function getColor(d) {
    return d > 1000 ? '#800026' :
            d > 500  ? '#BD0026' :
            d > 200  ? '#E31A1C' :
            d > 100  ? '#FC4E2A' :
            d > 50   ? '#FD8D3C' :
            d > 20   ? '#FEB24C' :
            d > 10   ? '#FED976' :
                       '#FFEDA0';
  }

  function style(feature) {
    return {
        fillColor: getColor(feature.properties.density),
        weight: 2,
        opacity: 1,
        color: 'white',
        dashArray: '3',
        fillOpacity: 0.7
    };
  }

  L.geoJson(statesData, {style: style}).addTo(mymap);
インタラクションを追加
ポリゴン上にマウスオーバーしたときのハイライト、マウスを外したときに元に戻す、クリックしたらズームする、という3つのインタラクションを追加します。それぞれstyleを変更するfunctionを書いておいてイベント発生時にonEachFeatureに呼び出してもらいます。
  function highlightFeature(e) {
    var layer = e.target;

    layer.setStyle({
        weight: 5,
        color: '#666',
        dashArray: '',
        fillOpacity: 0.7
    });

    if (!L.Browser.ie && !L.Browser.opera && !L.Browser.edge) {
        layer.bringToFront();
    }
  }

  function resetHighlight(e) {
    geojson.resetStyle(e.target);
  }

  function zoomToFeature(e) {
    mymap.fitBounds(e.target.getBounds());
  }

  function onEachFeature(feature, layer) {
    layer.on({
        mouseover: highlightFeature,
        mouseout: resetHighlight,
        click: zoomToFeature
    });
  }

  geojson = L.geoJson(statesData, {
      style: style,
      onEachFeature: onEachFeature
  }).addTo(mymap);
カスタムインフォを表示する
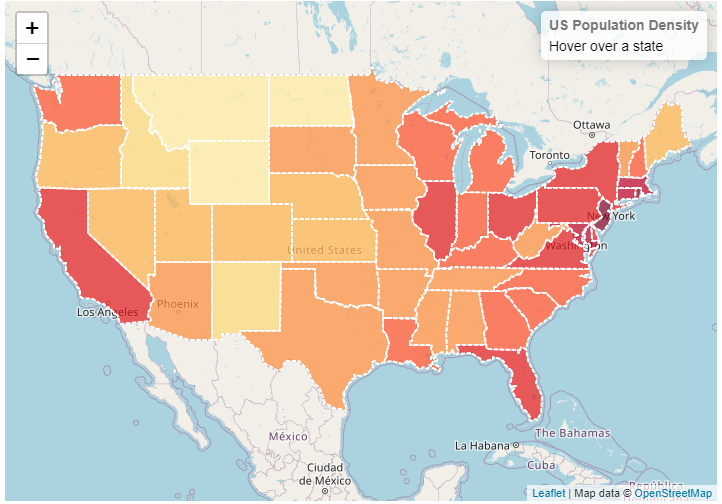
地図右上に表題とハイライトしている州の名前と人口密度を表示します
  var info = L.control();

  info.onAdd = function (mymap) {
      this._div = L.DomUtil.create('div', 'info'); // create a div with a class "info"
      this.update();
      return this._div;
  };

  // method that we will use to update the control based on feature properties passed
  info.update = function (props) {
      this._div.innerHTML = '<h4>US Population Density</h4>' +  (props ?
          '<b>' + props.name + '</b><br />' + props.density + ' people / mi<sup>2</sup>'
          : 'Hover over a state');
  };

  info.addTo(mymap);
内容の更新はマウスオーバーの際に呼ばれる関数にやってもらいます
function highlightFeature(e) {
    ...
    info.update(layer.feature.properties);
}

function resetHighlight(e) {
    ...
    info.update();
}
情報欄の背景を白くしてフォントを設定するCSSを追加します
.info {
    padding: 6px 8px;
    font: 14px/16px Arial, Helvetica, sans-serif;
    background: white;
    background: rgba(255,255,255,0.8);
    box-shadow: 0 0 15px rgba(0,0,0,0.2);
    border-radius: 5px;
}
.info h4 {
    margin: 0 0 5px;
    color: #777;
}
色の目安を表示する
var legend = L.control({position: 'bottomright'});
legend.onAdd = function (mymap) {
var div = L.DomUtil.create('div', 'info legend'),
grades = [0, 10, 20, 50, 100, 200, 500, 1000],
labels = [];
// loop through our density intervals and generate a label with a colored square for each interval
for (var i = 0; i < grades.length; i++) {
div.innerHTML +=
'<i style="background:' + getColor(grades[i] + 1) + '"></i> ' +
grades[i] + (grades[i + 1] ? '–' + grades[i + 1] + '<br>' : '+');
}
return div;
};
legend.addTo(mymap);
CSSに追記します
.legend {
    line-height: 18px;
    color: #555;
}
.legend i {
    width: 18px;
    height: 18px;
    float: left;
    margin-right: 8px;
    opacity: 0.7;
}
もっと色々な地図を作りたいときに
読んだらよさげな記事のリンクを貼っときます
