SPSS Modeler18.5の新機能の ネイティブ Python APIのテストをしてみました。これは、「拡張ノード」のなかでpandasを使ってModelerのデータを読んだり書いたりすることができる機能です。
この記事ではネイティブ Python APIで「拡張の出力ノード」が、どのように利用可能かをテストしてみました。
マニュアルにサンプル・ストリームがついていましたので、これを修正してテストしてみています。
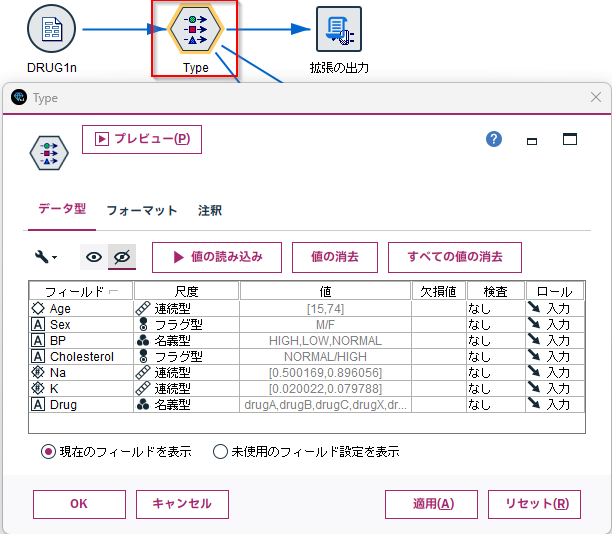
サンプルストリームは以下です。
- テスト環境
- Windows 11 64bit
- Modeler 18.5
- Python 3.10.7
データとデータモデルの出力
製品同梱のサンプルデータの「DRUG1n」を表示してみます。
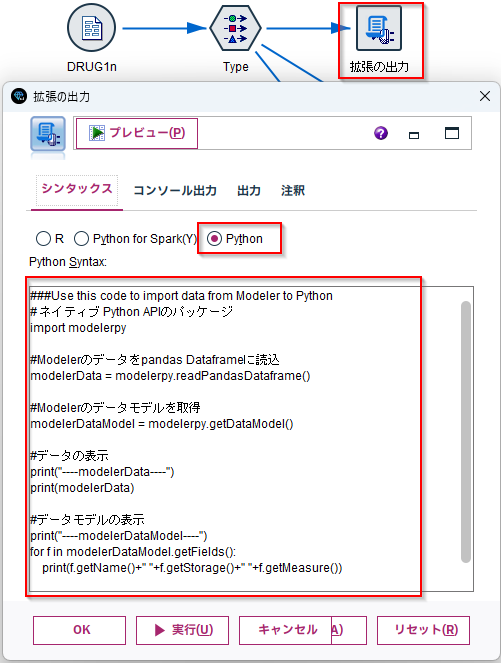
「Python」を選択し、「Python Syntax」の欄に以下のスクリプトを記入します。
# ネイティブ Python APIのパッケージ
import modelerpy

#Modelerのデータをpandas Dataframeに読込
modelerData = modelerpy.readPandasDataframe()

#Modelerのデータモデルを取得
modelerDataModel = modelerpy.getDataModel()

#データの表示
print("----modelerData----")
print(modelerData)

#データモデルの表示
print("----modelerDataModel----")
for f in modelerDataModel.getFields():
    print(f.getName()+" "+f.getStorage()+" "+f.getMeasure())
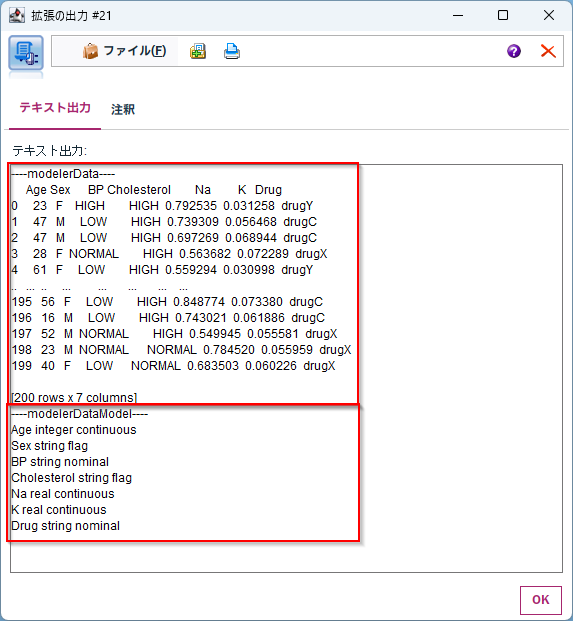
modelerpy.readPandasDataframe()で前のノードのデータをpandasのDataFrameに読み込んでいます。
modelerpy.getDataModel()は「データ型ノード」で定義されていたデータモデルを取得します。
以下で、modelerDataModel.getFields()はデータモデルから各列の情報を抜き出します。getNameで列名、getStorageでデータ型、getMeasureで尺度を取り出しています。
for f in modelerDataModel.getFields():
    print(f.getName()+" "+f.getStorage()+" "+f.getMeasure())
結果
ペアプロット図(散布図行列)グラフ出力
「拡張出力ノード」では、コンソールにテキストを出力するだけではなく、グラフも出力することができます。
あらかじめ、以下のコマンドを管理者権限で実行してmatplotlibとseabornを導入しておきます。
"C:\Program Files\IBM\SPSS\Modeler\18.5\python_venv\Scripts\python.exe" -m pip install matplotlib
"C:\Program Files\IBM\SPSS\Modeler\18.5\python_venv\Scripts\python.exe" -m pip install seaborn
「Python」を選択し、「Python Syntax」の欄に以下のスクリプトを記入します。

###Use this code to import data from Modeler to Python
# ネイティブ Python APIのパッケージ
import modelerpy

#Modelerのデータをpandas Dataframeに読込
modelerData = modelerpy.readPandasDataframe()

import matplotlib.pyplot as plt
import seaborn as sns

#seabornでpairplotのグラフを表示
sns.pairplot(modelerData, hue='K')
sns.pairplot(modelerData, hue='Age')
plt.show()
sns.pairplot(modelerData, hue='K')などでグラフをつくり、
plt.show()で表示しています。
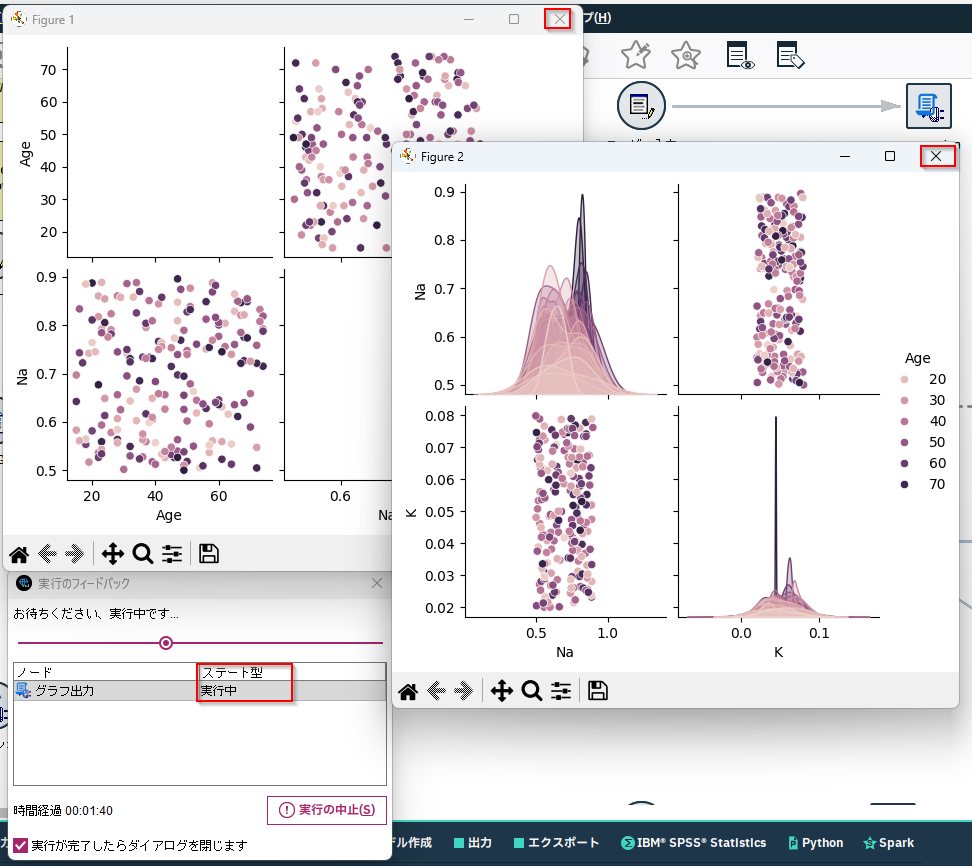
結果
ちなみに、Pythonのウィンドウでグラフを表示している間、下記のように常にストリームが実行中となっています。
ストリーム処理を完了させるために、Pythonのウィンドウを閉じる必要があります。
ネイティブPythonでも、Python for SparkやRのように拡張出力ノード内グラフ出力タブへのグラフ出力がサポートされると良いと思いましたので、新機能のアイデアとして投稿してみました。
ご賛同いただける方は、下記URLより、Voteをクリックして投票いただけますと幸いです。
機能の開発が確約されるものではありませんが、投票数が多いと検討対象となります。
Extension Output Node for Native Python with Graph Output tab like R and Python for Spark
参考
SPSS Modeler18.5の新機能の ネイティブ Python API #SPSS - Qiita
ネイティブ Python拡張のインポートノード:CSVファイルの読み込み
ネイティブ Python拡張の変換ノード:置き換え
ネイティブ Python拡張モデルノード:モデル作成OneClassSVM
ネイティブ Python拡張の出力ノード:データとペアプロット図(散布図行列)の表示
ネイティブ Python拡張のエクスポートノード:CSVファイルの出力
ネイティブpythonの拡張ノードでつかうpyhtonパッケージを導入する


