お題
PlantUMLはダイアグラムを生成するDSL。
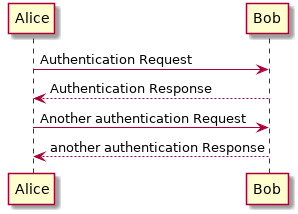
例えば、下記のように書いて plantuml コマンドで画像変換すると、
@startuml
Alice -> Bob: Authentication Request
Bob --> Alice: Authentication Response

Alice -> Bob: Another authentication Request
Alice <-- Bob: another authentication Response
@enduml
以下のような画像ファイル(png)が出来上がる。
上記はシーケンス図の例だけど、UML一式はもちろんのこと、ワイヤーフレームやガントチャート、マインドマップまで書ける。
今回は、このPlantUMLでGoogle Cloud Platformのシステム構成図を書いてみる。
開発環境
# OS
$ cat /etc/os-release
NAME="Ubuntu"
VERSION="18.04.2 LTS (Bionic Beaver)"
# Visual Studio Code
Version: 1.33.1
Commit: 51b0b28134d51361cf996d2f0a1c698247aeabd8
Date: 2019-04-11T08:20:22.771Z
Electron: 3.1.6
Chrome: 66.0.3359.181
Node.js: 10.2.0
V8: 6.6.346.32
OS: Linux x64 4.15.0-47-generic
実践
plantuml-gcp-icons
「plantuml-gcp-icons」というGCPの各サービスのアイコンを図示するツールを使用。
ちなみに、AWSの各サービスのアイコンを図示するものもあるみたい。
https://github.com/milo-minderbinder/AWS-PlantUML
前提
以下はググるとすぐにわかるので省略。
- Visual Studio Codeのインストール
- Visual Studio CodeのPlantUMLプラグインインストール
- plantuml-gcp-iconsの取得
サンプル
まずはplantuml-gcp-iconsサイトのREADMEにあるものをそのまま画像変換してみる。
@startuml
!include ./common.puml
!include ./GCP Icons/Products & Services/Storage & Databases/Cloud Bigtable.puml
!include ./GCP Icons/Products & Services/Big Data/BigQuery.puml

GCP_CloudBigtable(foo, "My BigTable")
GCP_BigQuery(bar, "Data Processing")

foo -> bar

@enduml

※Visual Studio CodeのPlantUMLプラグインが表示したプレビュー
小売業向けのリアルタイム インベントリ システム
以下に載っているアーキテクチャ図を表現してみる。
https://cloud.google.com/solutions/building-real-time-inventory-systems-retail?hl=ja
@startuml
!include ./common.puml
!include ./Icons/Compute/App Engine.puml
!include ./Icons/Big Data/Cloud PubSub.puml
!include ./Icons/Big Data/Cloud Dataflow.puml
!include ./Icons/Storage & Databases/Cloud SQL.puml
!include ./Icons/Big Data/BigQuery.puml
!include ./Icons/Storage & Databases/Cloud Bigtable.puml

rectangle RetailStore as rs {
    node "Inventory Changes" <<"Point of sale">>
}

rectangle Ingest {
    GCP_AppEngine("cc","Capture Changes")
}
rectangle Messaging {
    GCP_CloudPubSub("sc", "Streaming Changes")
}
rectangle Services {
    GCP_AppEngine("ia","Inventory APIs")
}
rectangle Processing {
    GCP_CloudDataflow("is", "Inventory Streams")
}
rectangle Aggregates {
    GCP_CloudSQL("ic", "Inventory Counts")
}
rectangle Analytics {
    GCP_BigQuery("dw", "Data Warehouse")
}
rectangle Events {
    GCP_CloudBigtable("pc", "Processed Changes")
}

rectangle Integrations as i {
    node "Google Services"
}

rectangle BackOffice as bo {
    node "Businness Applications"
}


rs -> cc
cc --> sc
sc --> ia
sc -> is
is --> ic
ic -left-> ia
is -> pc
is -> dw
ia --> bo
ia --> i

@enduml
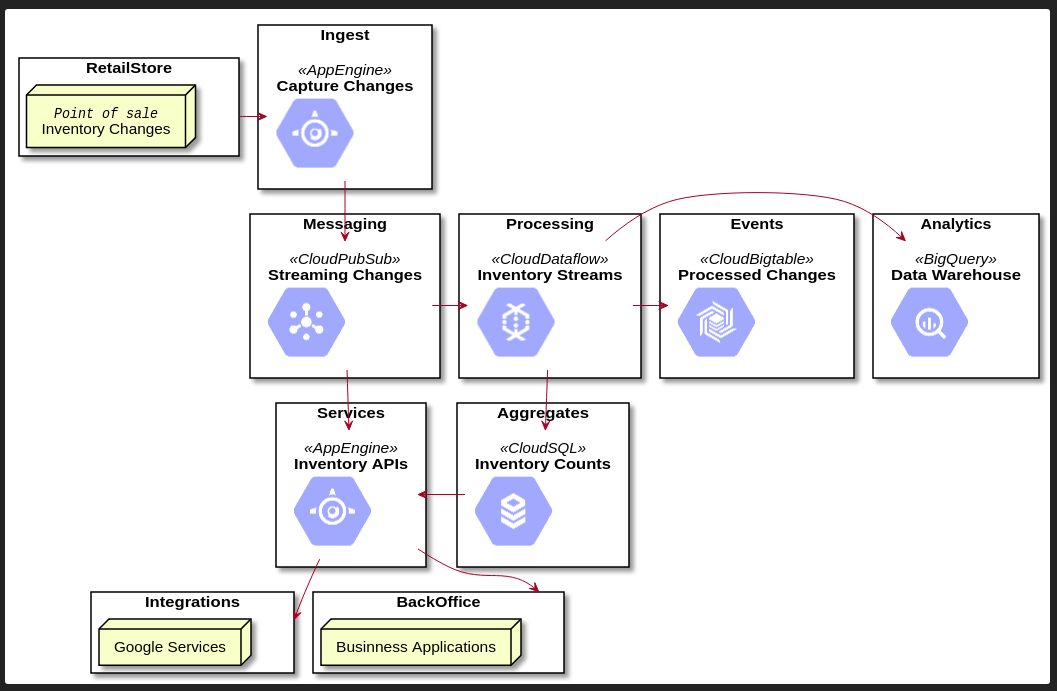
※Visual Studio CodeのPlantUMLプラグインが表示したプレビュー
まとめ
ちょっとまだ表現力としては惜しいといった感じかな。。。
もちろん、PlantUMLの書き方をもっと理解すれば、もう少しよい図になりそうだけど。
今回のソースは↓
https://github.com/sky0621/try-plantuml/tree/master/gcp