やりたいこと
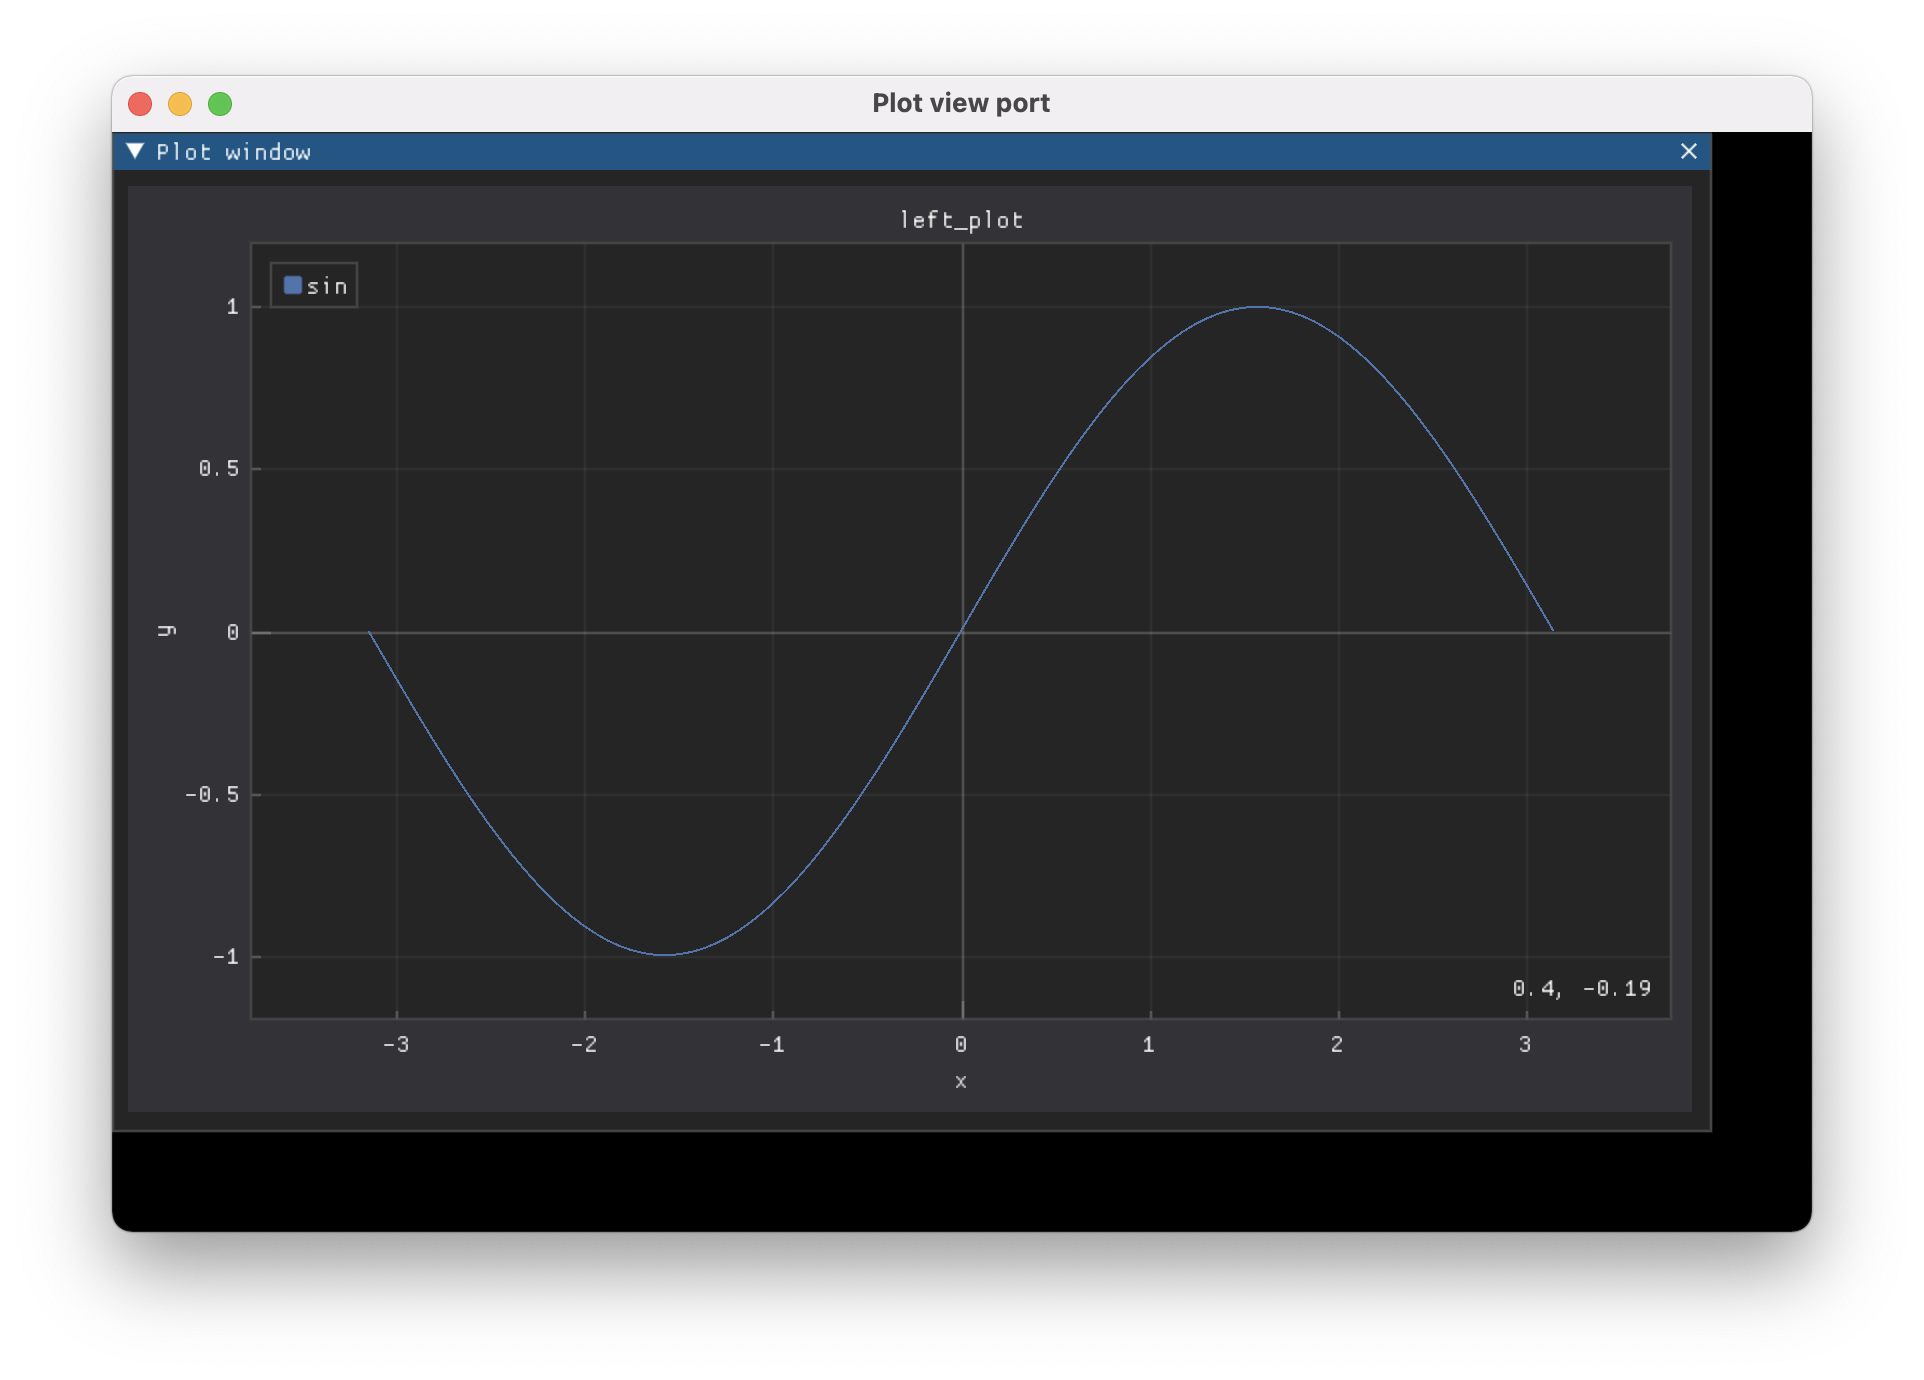
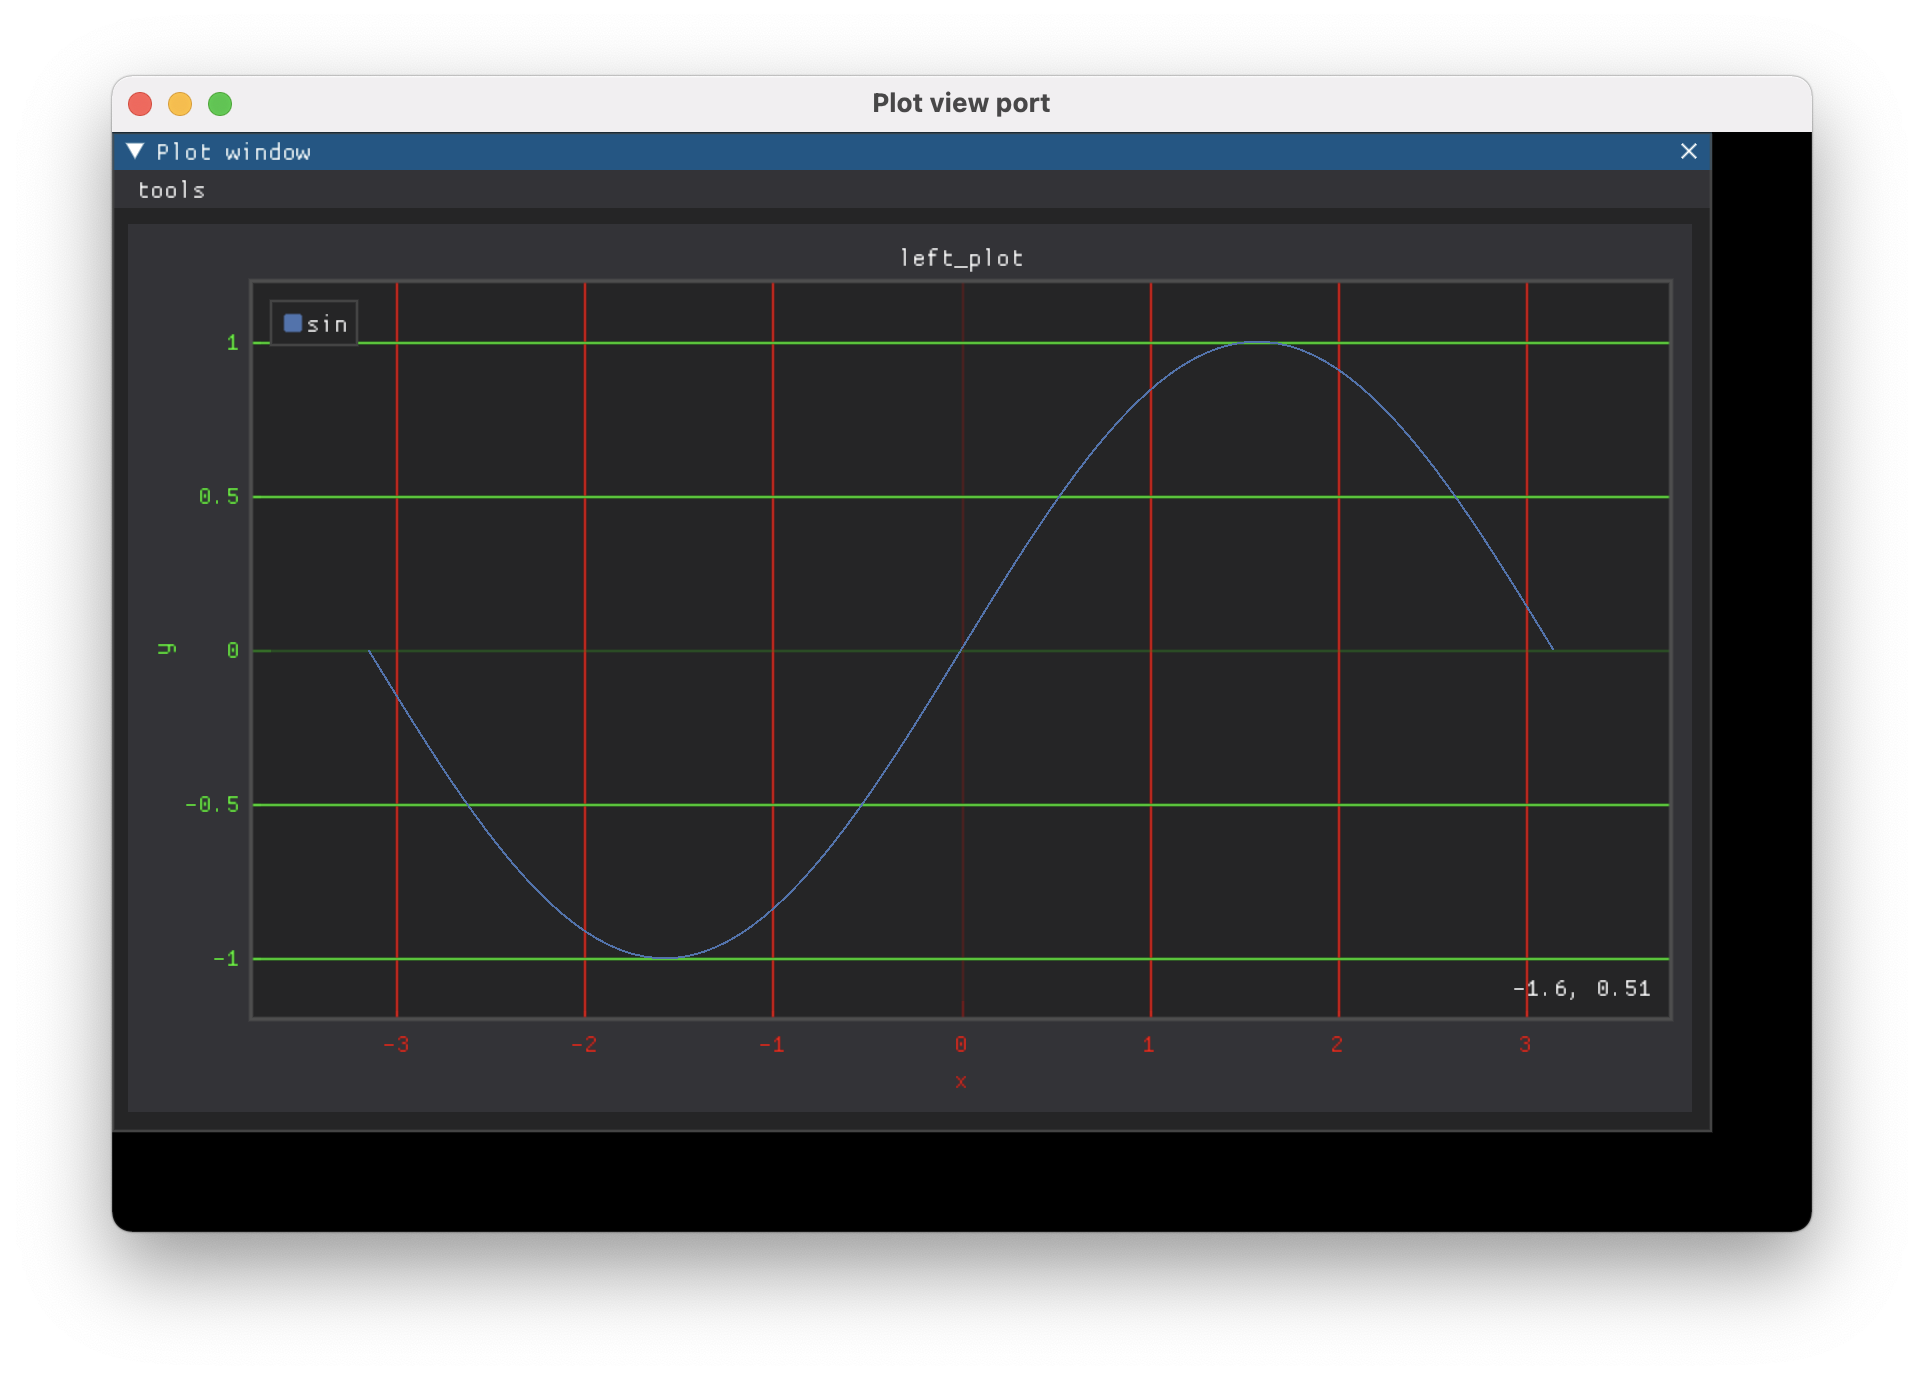
DearPyGUiでプロットを作成したときにPaddingを設定したかった
(左が未設定、右が設定済み)
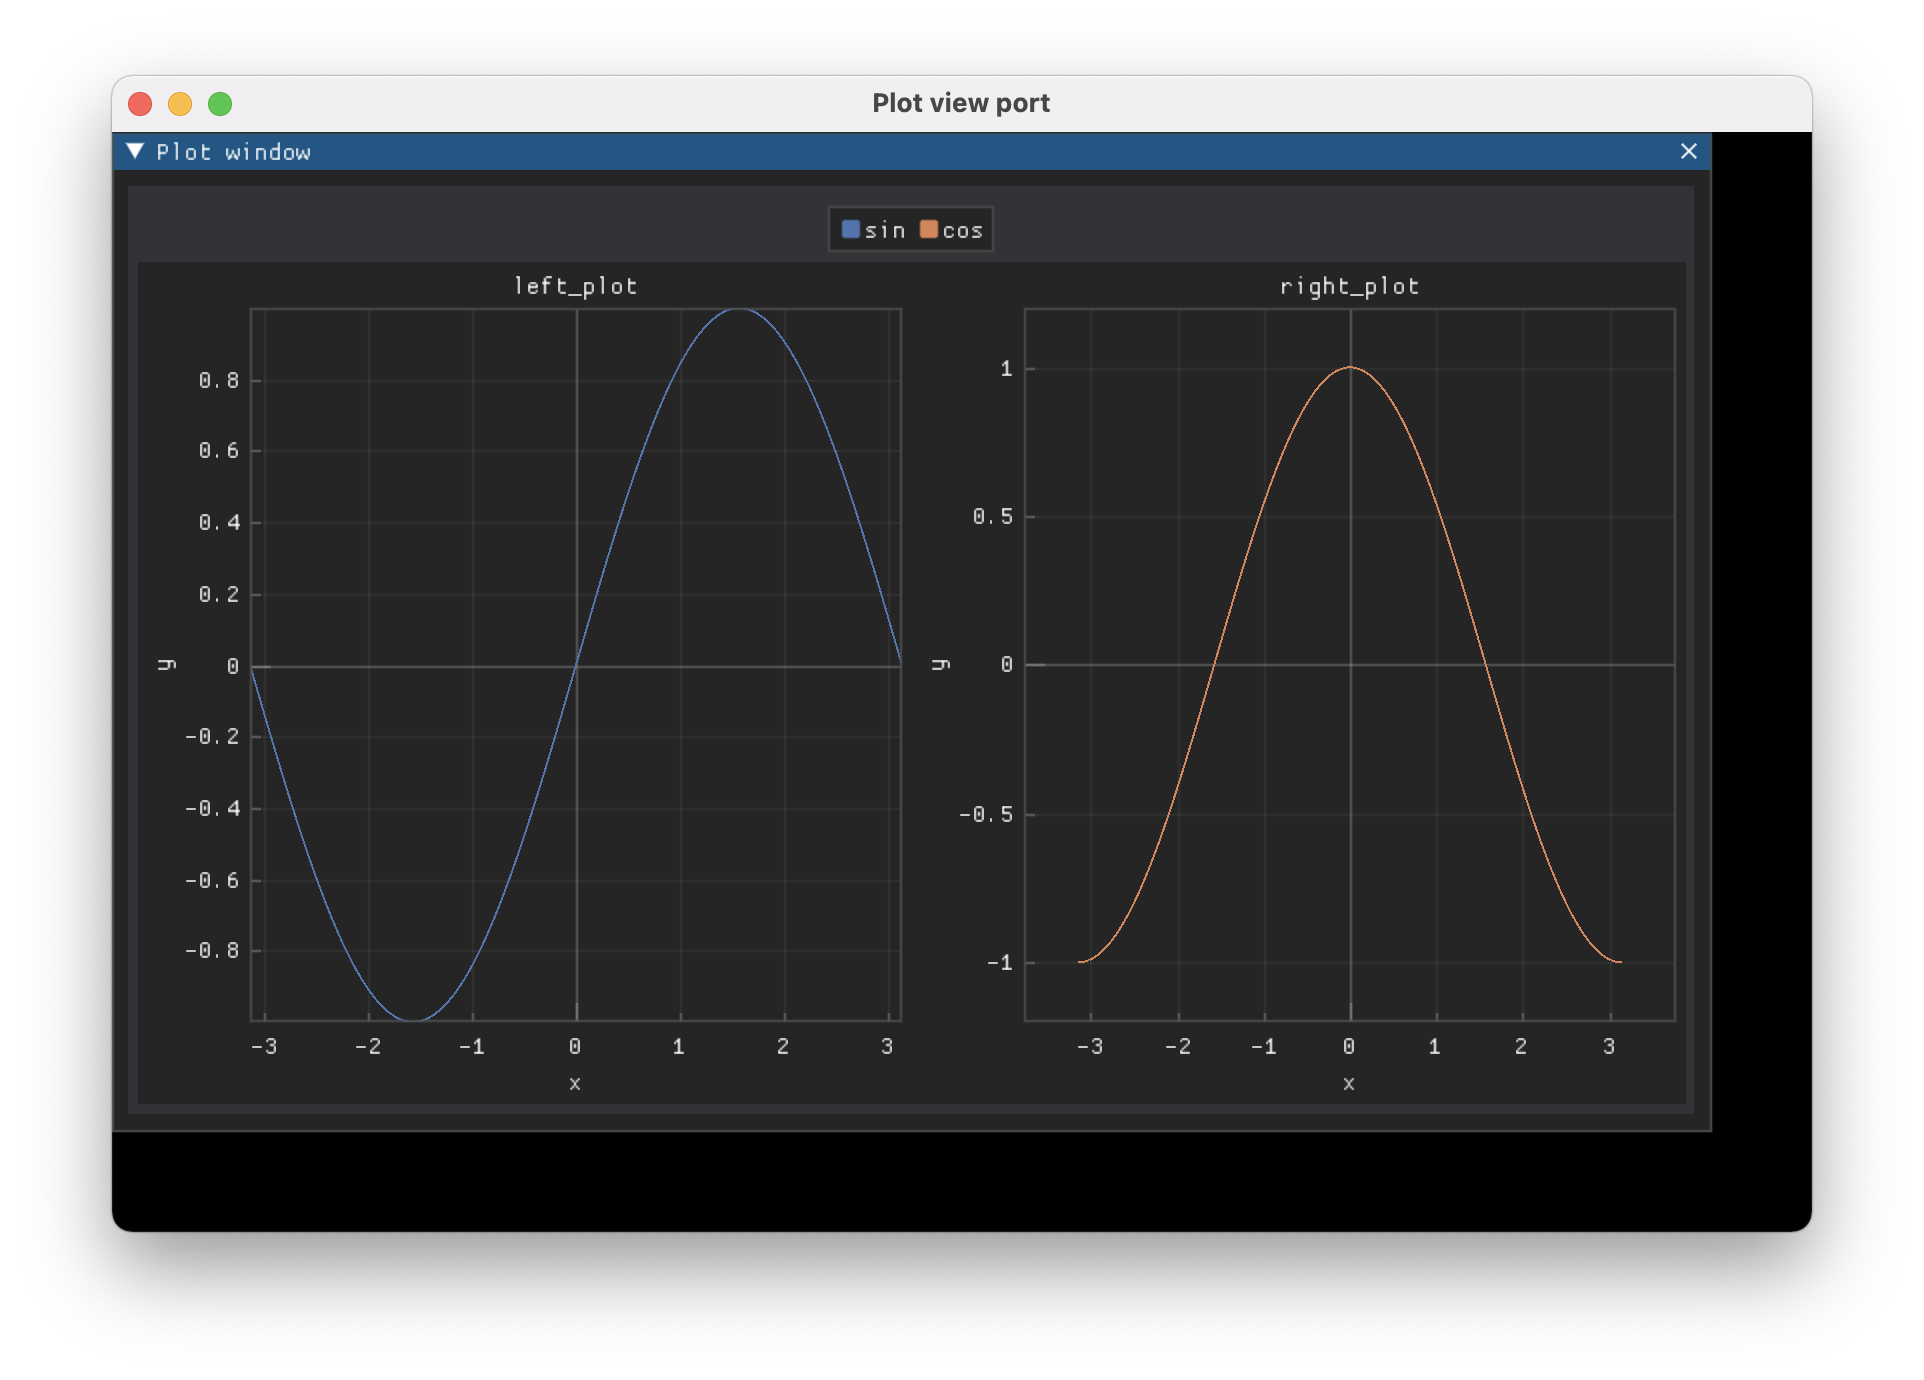
どうやるんだろうと探していたらドキュメントのテーマの項に記載がありました。
Padding以外の設定もできるようになったので記載します。
環境
Mac OS
Python 3.10.1
dearpygui 1.3.1
numpy 1.22.1
pip install dearpygui numpy
詳細
手順は2つだけでした
- テーマを作成
- 表示するプロットにテーマを紐付ける
"""
DearPyGui plotのテーマ設定
https://dearpygui.readthedocs.io/en/latest/documentation/themes.html#
"""
import dearpygui.dearpygui as dpg
import numpy as np

# ################# プロットデータ作成 #################
data_len: int = 100
x_data = np.linspace(-np.pi, np.pi, data_len)
sin_data = np.sin(x_data)
cos_data = np.cos(x_data)

# ##################### 描画設定 #####################
dpg.create_context()
dpg.create_viewport(title='Plot view port', width=850, height=550)
dpg.setup_dearpygui()
dpg.show_viewport()

# ##################### テーマ設定 #####################
with dpg.theme() as theme:
    # Plotに有効なテーマ
    with dpg.theme_component(dpg.mvPlot):
        # padding用のテーマ
        dpg.add_theme_style(dpg.mvPlotStyleVar_FitPadding, x=0.2, y=0.2,
                            category=dpg.mvThemeCat_Plots)

# ##################### 画面作成 #####################
with dpg.window(label='Plot window', width=800, height=500):
    with dpg.plot(label='left_plot', width=-1, height=-1) as theme_plt:
        dpg.add_plot_legend(horizontal=True)
        dpg.add_plot_axis(dpg.mvXAxis, label='x', tag='xaxis')
        dpg.add_plot_axis(dpg.mvYAxis, label='y', tag='yaxis')
        dpg.add_line_series(x_data, sin_data, label='sin', parent=dpg.last_item(), tag='line')

# テーマ適用
dpg.bind_item_theme(theme_plt, theme)

dpg.start_dearpygui()
dpg.destroy_context()
タグを使用しても同じことができます
# ##################### テーマ設定 #####################
with dpg.theme(tag='theme'):
    # Plotに有効なテーマ
    with dpg.theme_component(dpg.mvPlot):
        dpg.add_theme_style(dpg.mvPlotStyleVar_FitPadding, x=0.2, y=0.2,
                            category=dpg.mvThemeCat_Plots)

# ##################### 画面作成 #####################
with dpg.window(label='Plot window', width=800, height=500):
    with dpg.plot(label='left_plot',tag='theme_plt', width=-1, height=-1):
        dpg.add_plot_legend(horizontal=True)
        dpg.add_plot_axis(dpg.mvXAxis, label='x', tag='xaxis')
        dpg.add_plot_axis(dpg.mvYAxis, label='y', tag='yaxis')
        dpg.add_line_series(x_data, sin_data, label='sin', parent=dpg.last_item(), tag='line')

dpg.bind_item_theme('theme_plt', 'theme')
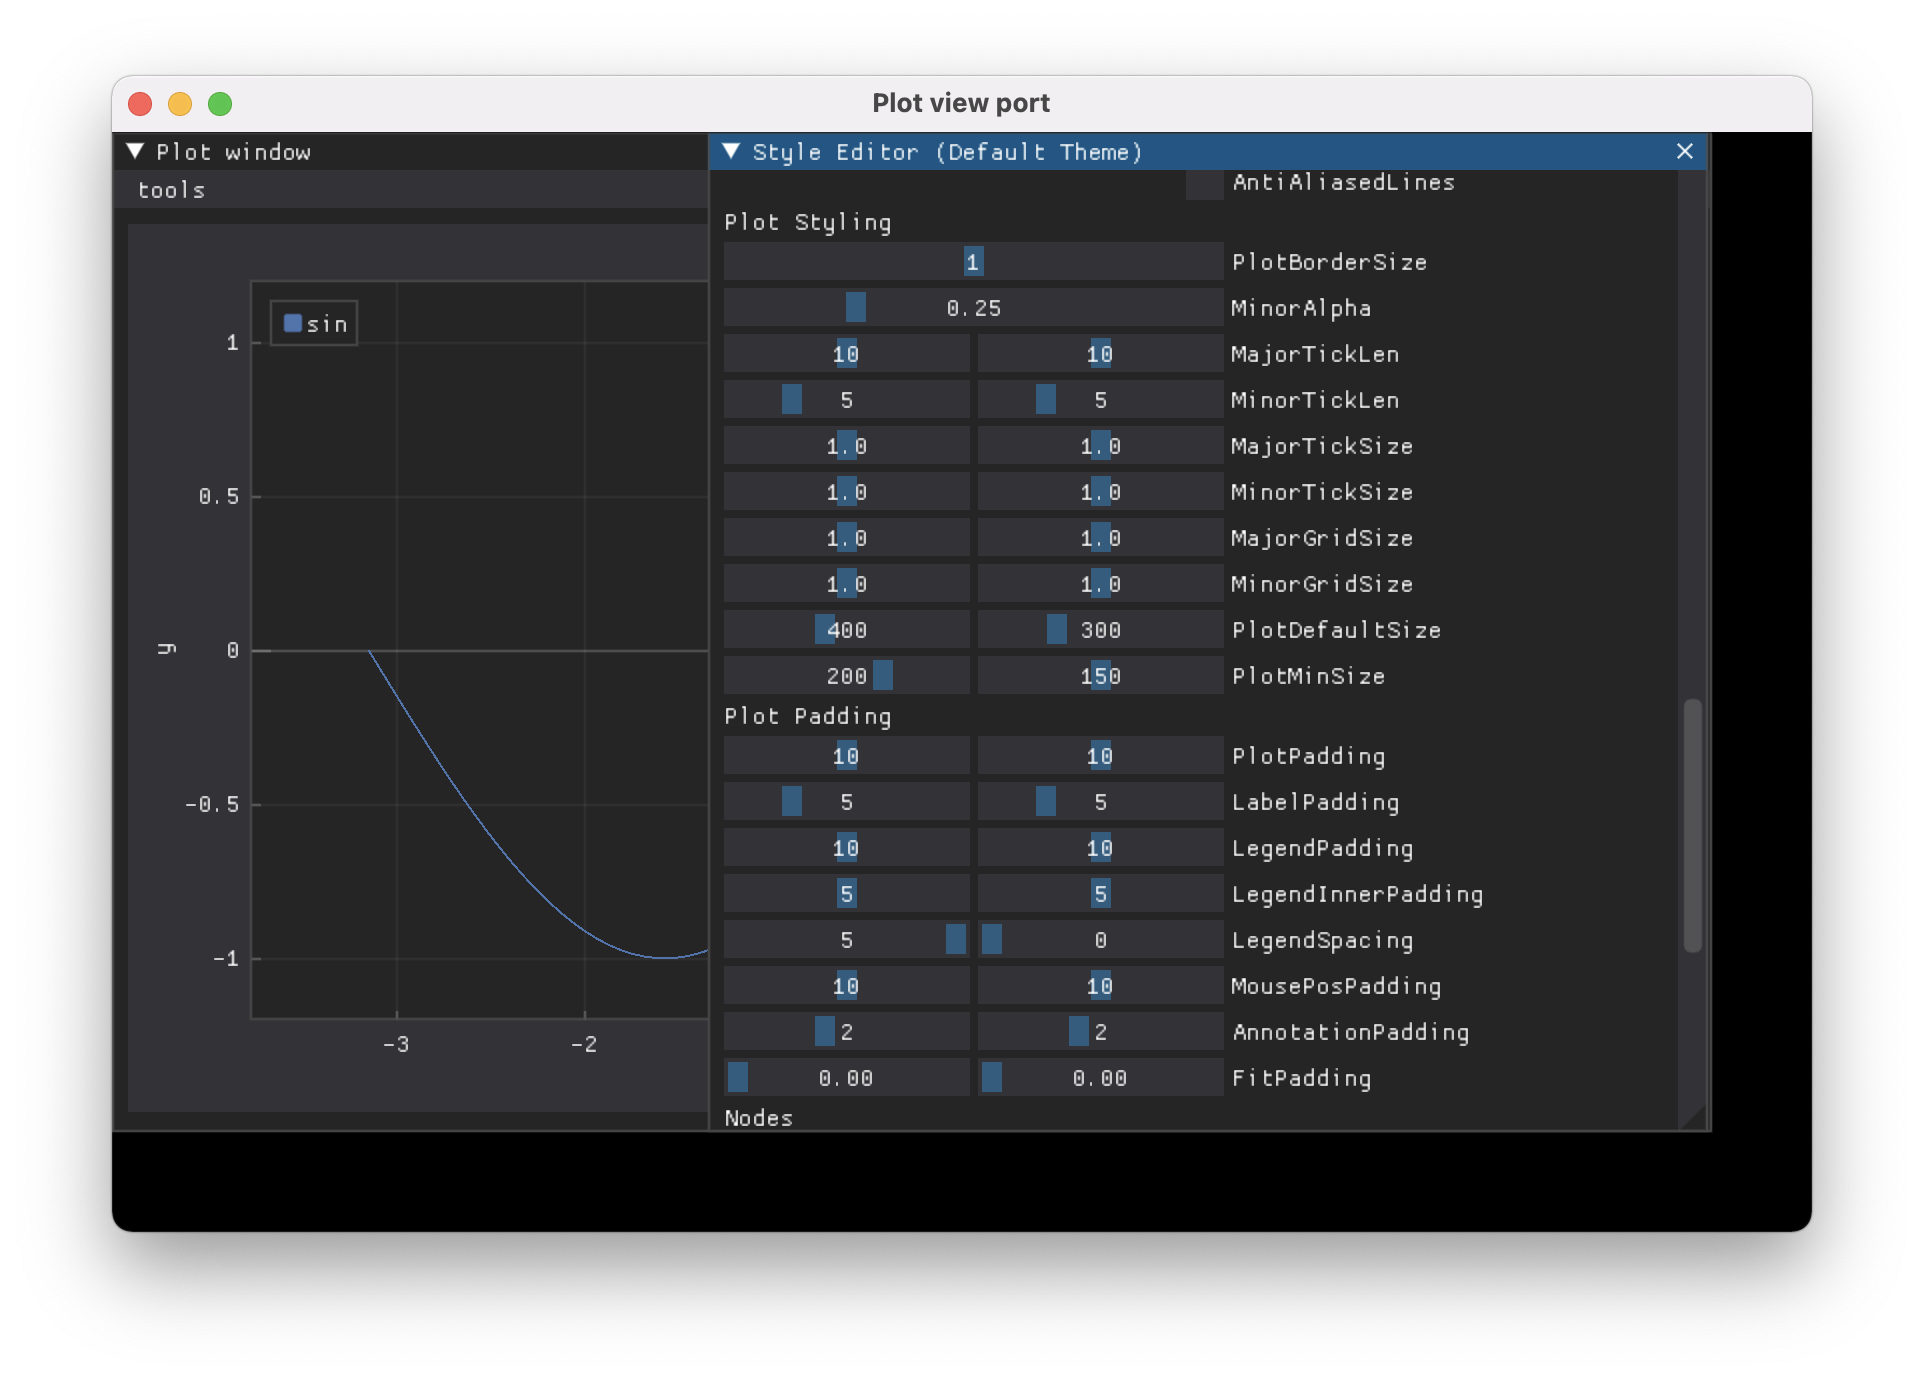
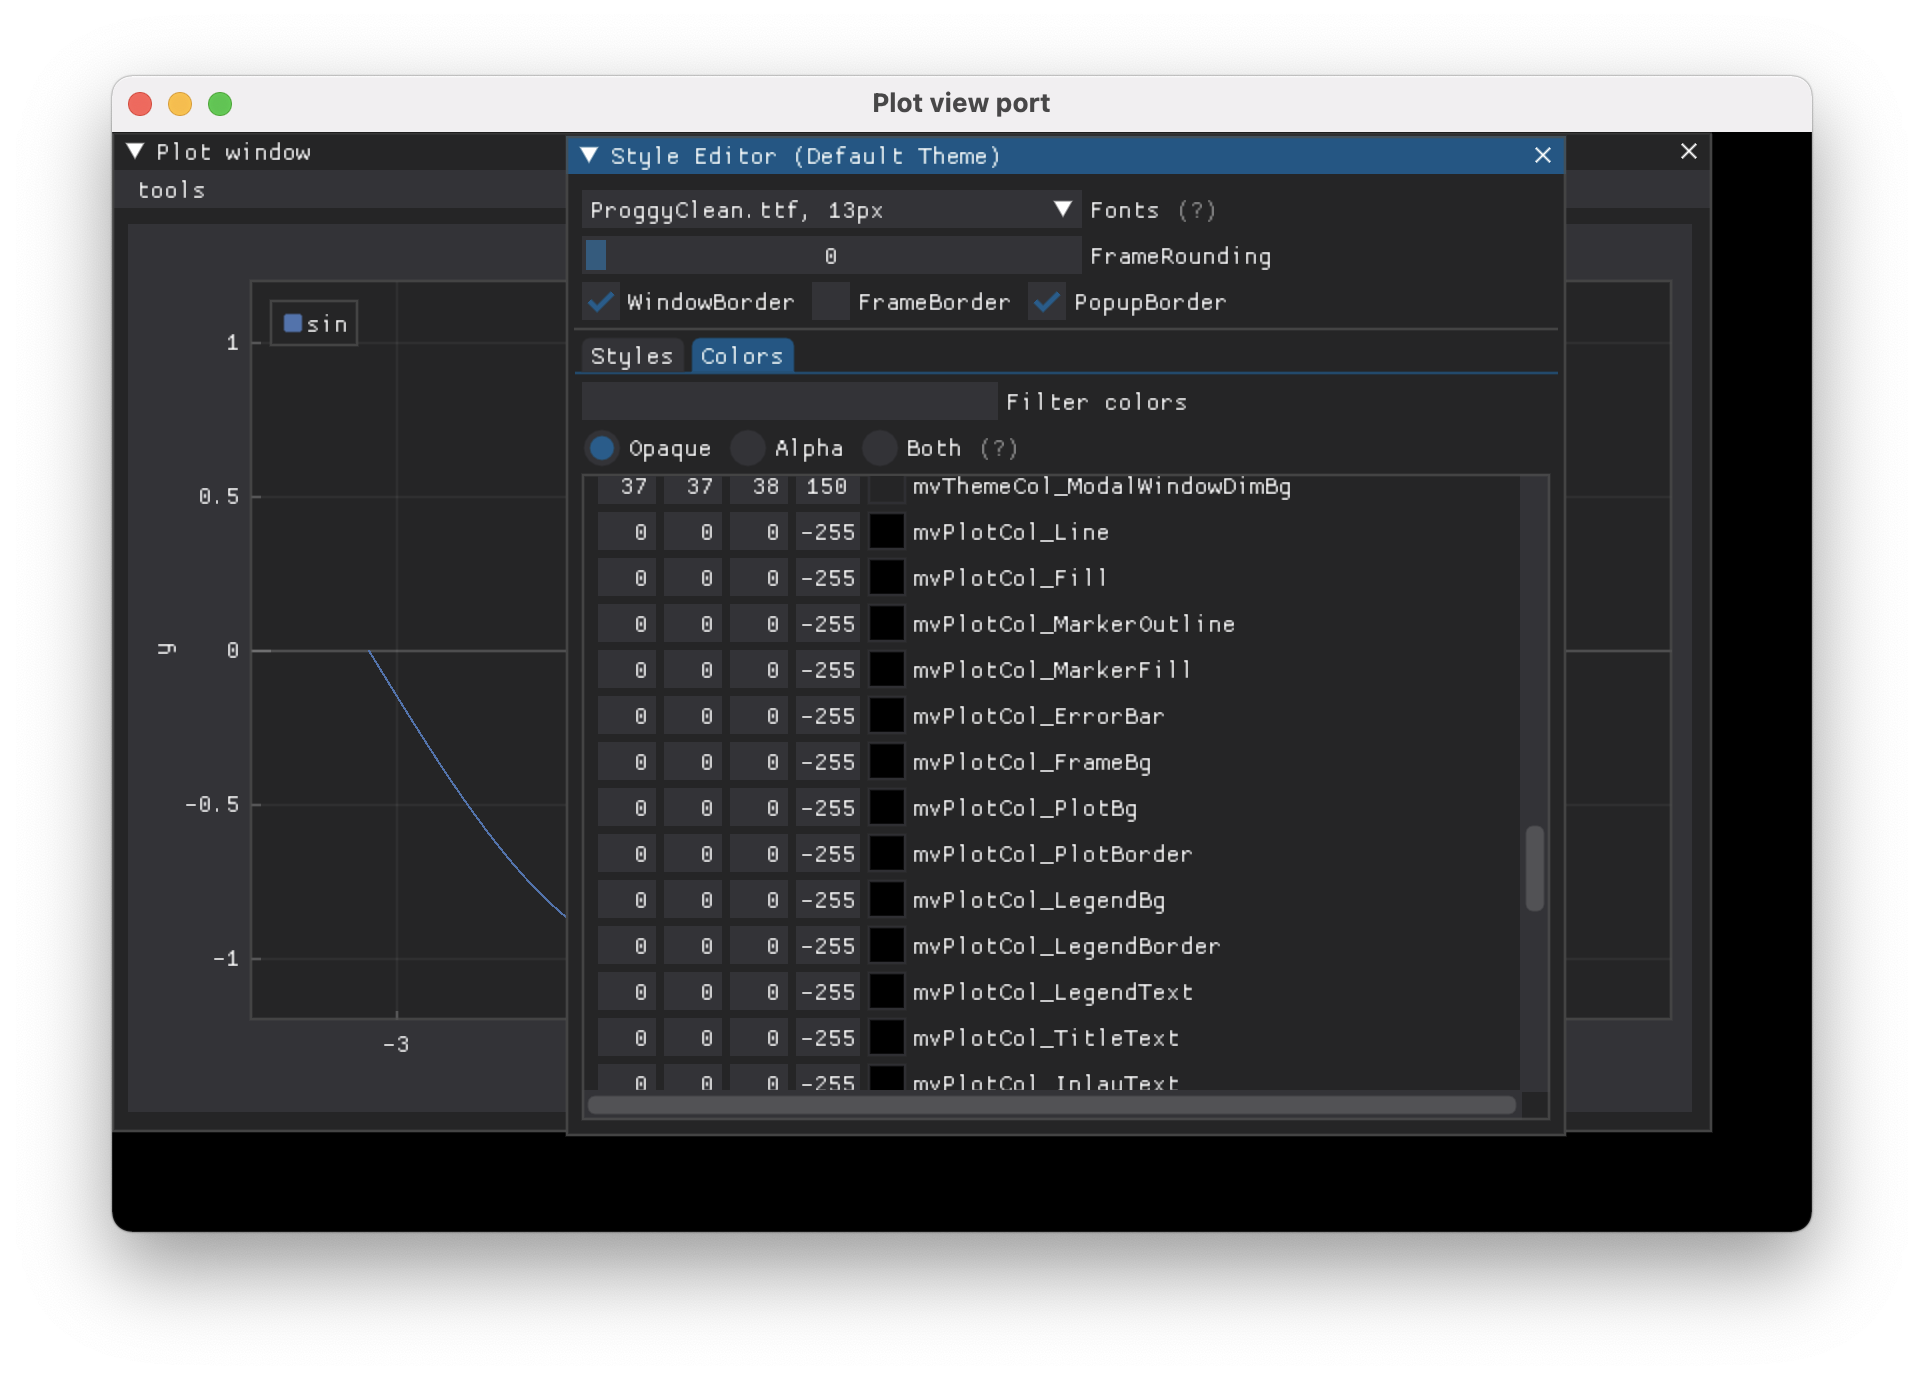
グラフに設定できるスタイルと色はこれくらいありそうです。
dpg.show_tool(dpg.mvTool_Style)で開けます。(この画面からでもスタイル、色の設定ができます)
with dpg.theme(tag='theme'):
    # Plotに有効なテーマ
    with dpg.theme_component(dpg.mvPlot):
        # Style設定
        dpg.add_theme_style(dpg.mvPlotStyleVar_FitPadding, x=0.2, y=0.2, category=dpg.mvThemeCat_Plots)  # Padding
        dpg.add_theme_style(dpg.mvPlotStyleVar_PlotBorderSize, 2, category=dpg.mvThemeCat_Plots)  # プロットの外枠の太さ?
        dpg.add_theme_style(dpg.mvPlotStyleVar_MinorAlpha, 255, category=dpg.mvThemeCat_Plots)  # 補助線の透明度
        # Color設定
        dpg.add_theme_color(dpg.mvPlotCol_XAxis, [255, 0, 0, 255], category=dpg.mvThemeCat_Plots)  # x軸の色
        dpg.add_theme_color(dpg.mvPlotCol_YAxis, [0, 255, 0, 255], category=dpg.mvThemeCat_Plots)  # y軸の色
add_theme_styleはx,y引数にxy毎の値を入力すれば大丈夫です。
dpg.mvPlotStyleVar_MinorAlphaのようなxyで分けない場合はxに入れると適用できました。
