やりたいこと
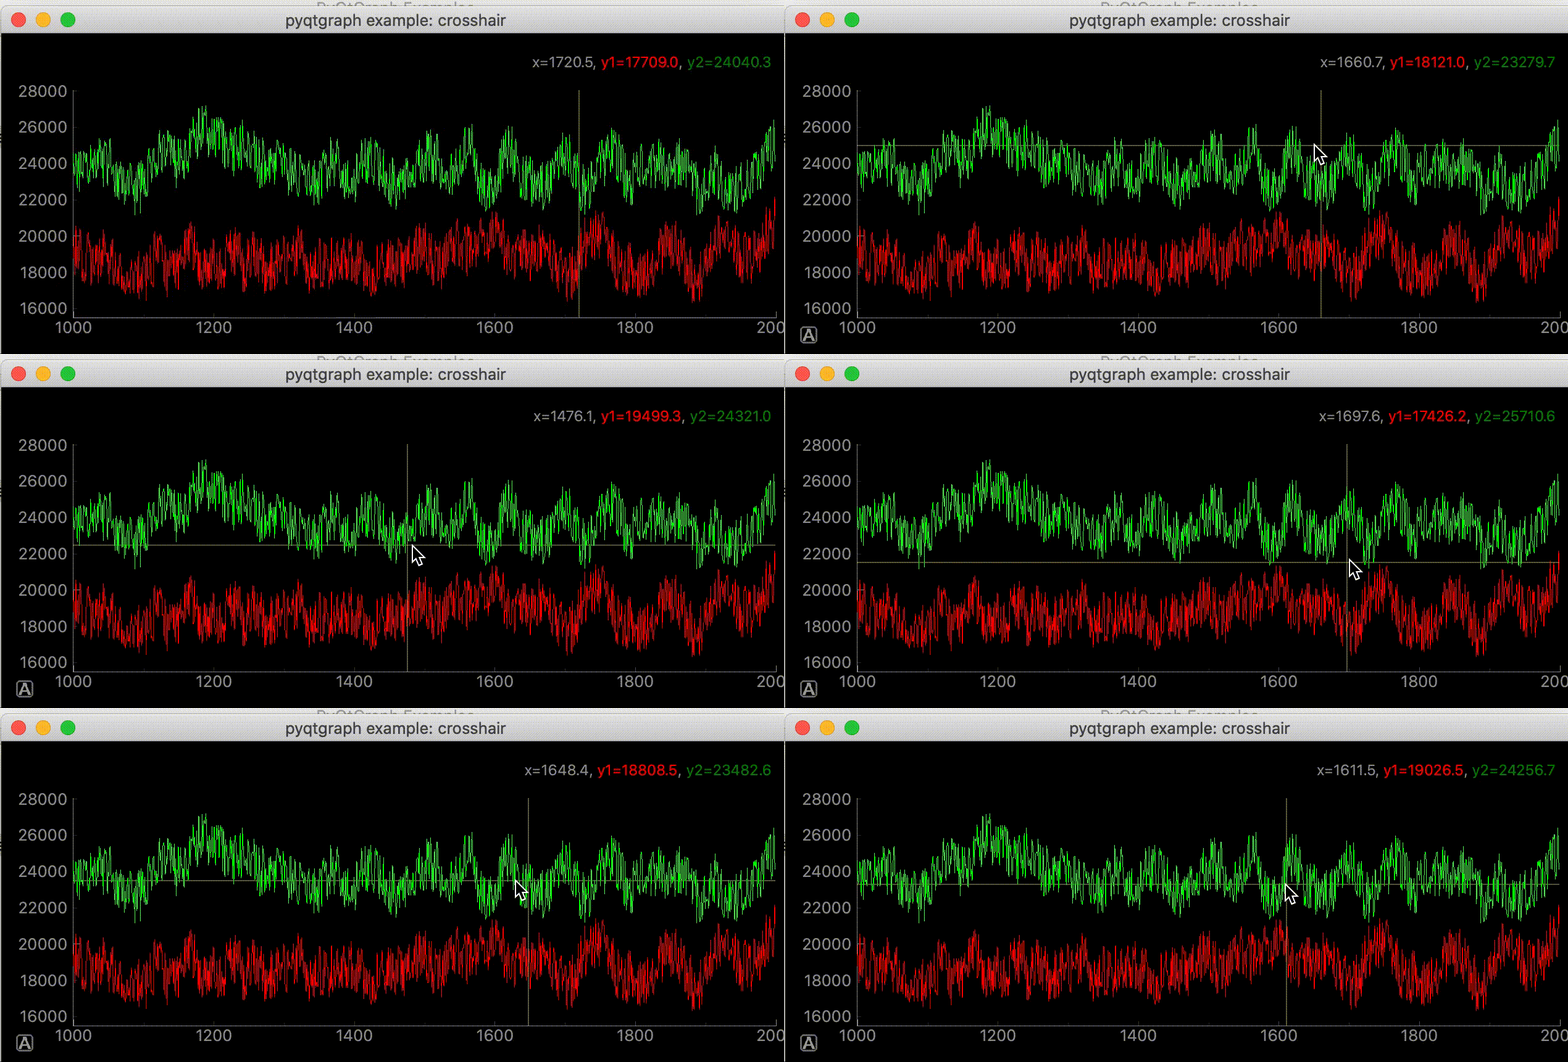
pyqtgraph.exsamples.run()のCrosshair / Mouse interactionにあるカーソルに合わせて動く十字線を作成したい。

サンプルコードの中に初めてみるスクリプトがあった。
proxy = pg.SignalProxy(p1.scene().sigMouseMoved, rateLimit=60, slot=mouseMoved)
SignalProxyは何をしているのか理解しながら十字線を作成していく。
環境
Mac OS
Python 3.8.5
PyQt5 5.15.2
PyQt5-sip 12.8.1
pyqtgraph 0.11.1
pip install PyQt5 PyQt5-sip pyqtgraph
pyqtgraph.exsamples
import pyqtgraph.examples as ex
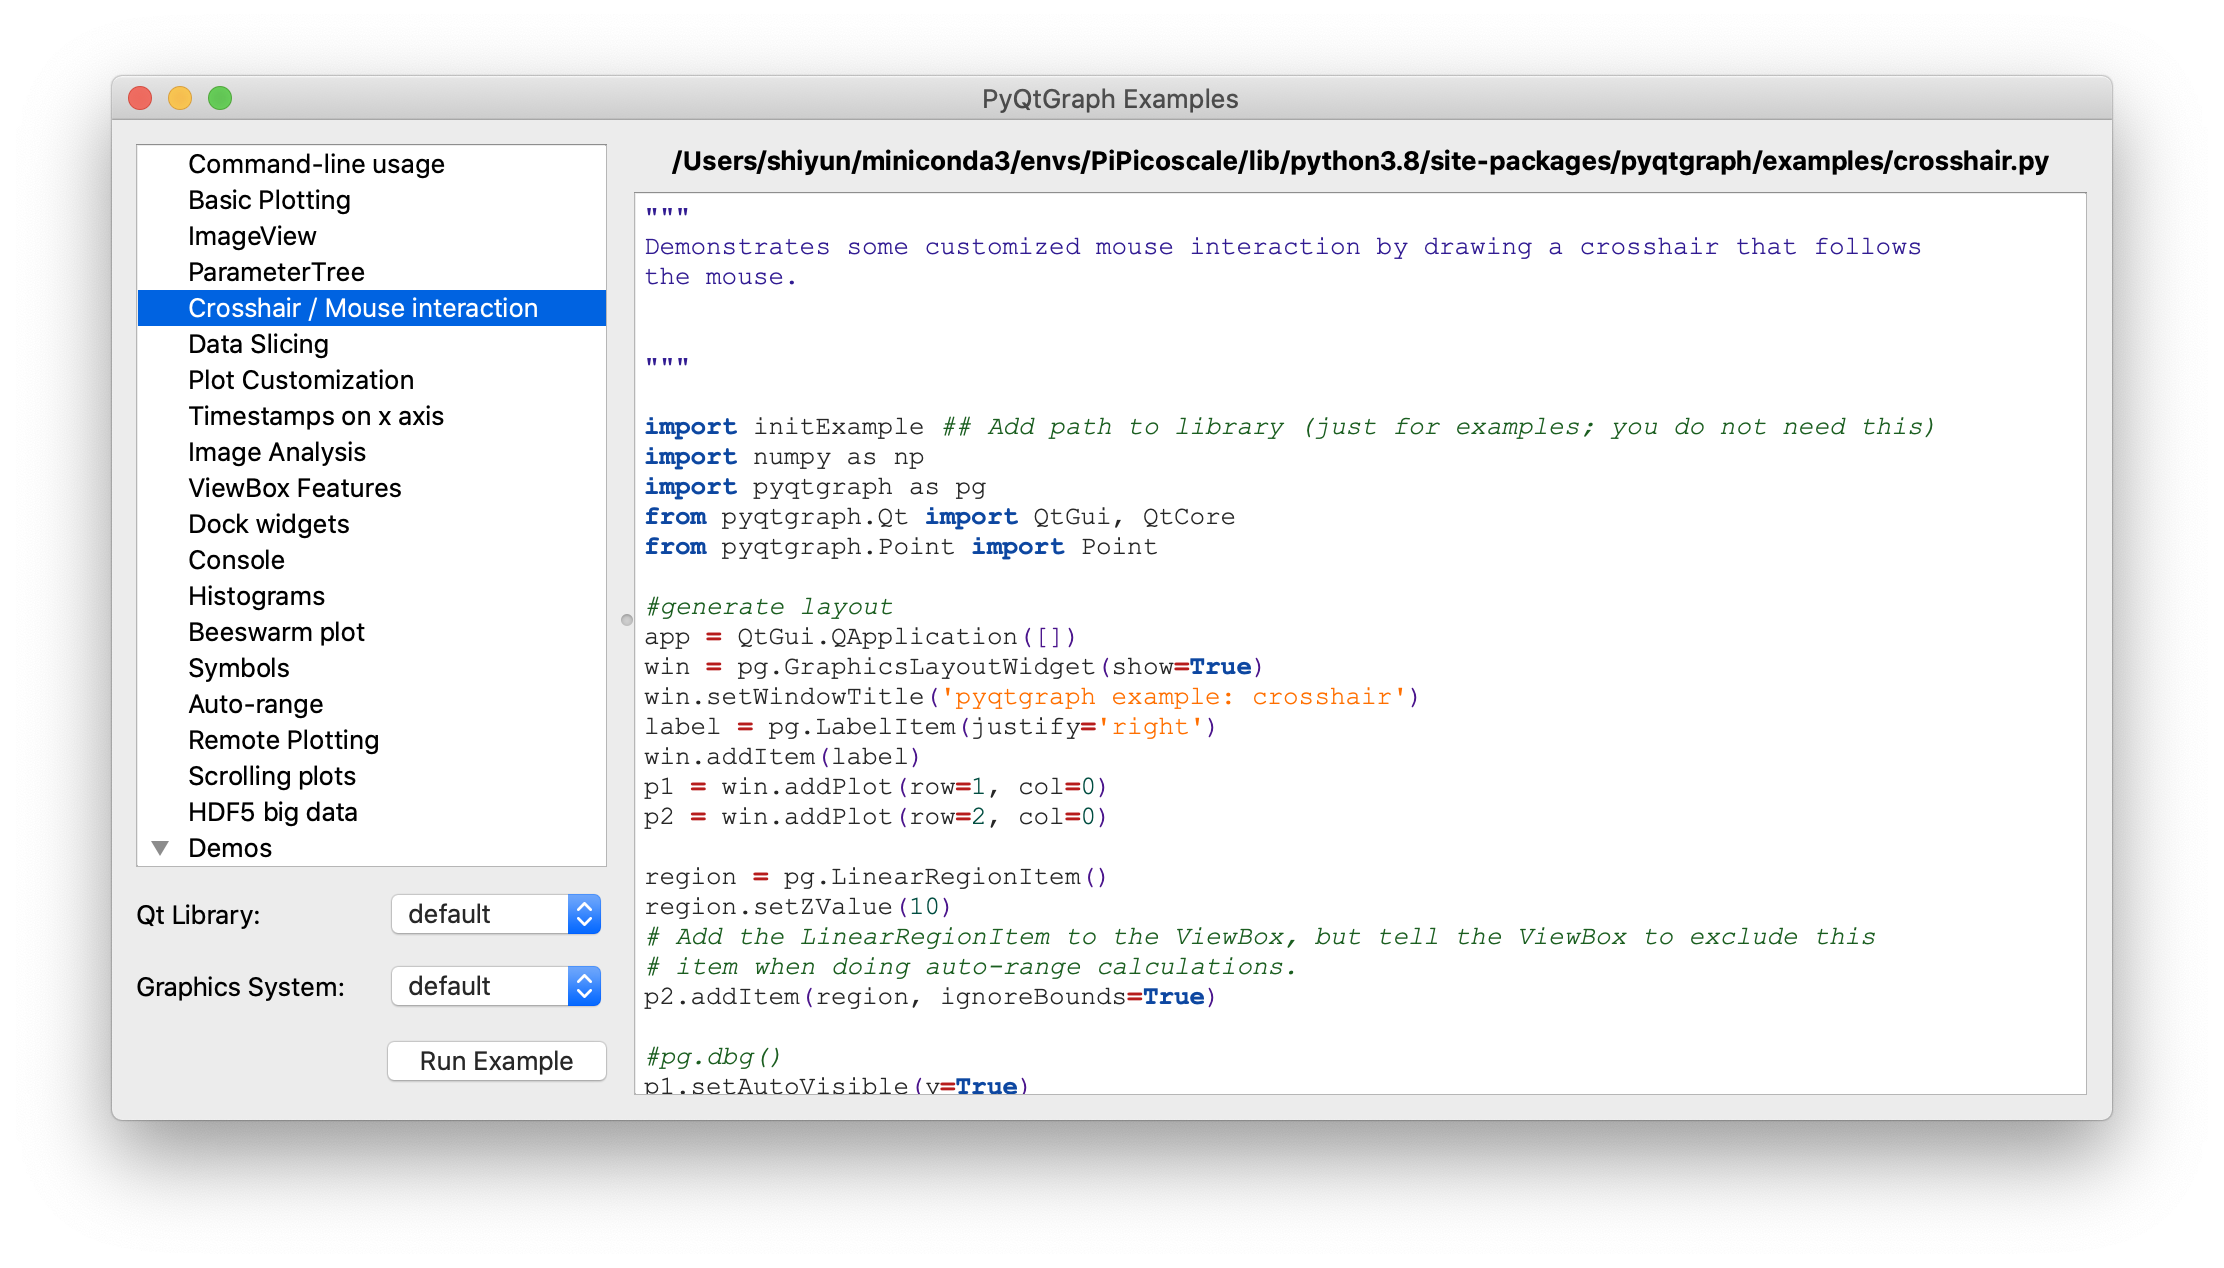
ex.run()
で色々なサンプルグラフが見れます。今回参考にしたのはCrosshair / Mouse interactionです。

SignalProxy
SignalProxyのdocの内容
Object which collects rapid-fire signals and condenses them
into a single signal or a rate-limited stream of signals.
Used, for example, to prevent a SpinBox from generating multiple
signals when the mouse wheel is rolled over it.
Emits sigDelayed after input signals have stopped for a certain period of
time.
Initialization arguments:
signal - a bound Signal or pyqtSignal instance
delay - Time (in seconds) to wait for signals to stop before emitting (default 0.3s)
slot - Optional function to connect sigDelayed to.
rateLimit - (signals/sec) if greater than 0, this allows signals to stream out at a
steady rate while they are being received.
短時間で同じシグナルが大量に発生する場合使用するオブジェクト。
発生したシグナルを全て発光するのではなく、一定間隔ごとに一つだけ発光する。
引数
- signal : 処理したいシグナルを指定
- delay : シグナルを受信してから発光するまでの待ち時間。デフォルトは0.3秒。指定する時は秒単位で入力。
- slot : シグナルが発光した時に実行されるスロット
- rateLimit : シグナルが発光する間隔を正確に設定したい時に使う。単位は[Hz]。デフォルトは0。
どうやって間隔を指定している?
SignalProxyのコンストラクタとシグナルを受信している部分
self.timerがtimeoutした時スロットが実行される。
    sigDelayed = QtCore.Signal(object)

    def __init__(self, signal, delay=0.3, rateLimit=0, slot=None):
        """Initialization arguments:
        signal - a bound Signal or pyqtSignal instance
        delay - Time (in seconds) to wait for signals to stop before emitting (default 0.3s)
        slot - Optional function to connect sigDelayed to.
        rateLimit - (signals/sec) if greater than 0, this allows signals to stream out at a
                    steady rate while they are being received.
        """

        QtCore.QObject.__init__(self)
        self.delay = delay
        self.rateLimit = rateLimit
        self.args = None
        self.timer = ThreadsafeTimer.ThreadsafeTimer()
        self.timer.timeout.connect(self.flush)
        self.lastFlushTime = None
        self.signal = signal
        self.signal.connect(self.signalReceived)
        if slot is not None:
            self.blockSignal = False
            self.sigDelayed.connect(slot)
            self.slot = weakref.ref(slot)
        else:
            self.blockSignal = True
            self.slot = None

    def signalReceived(self, *args):
        """Received signal. Cancel previous timer and store args to be
        forwarded later."""
        if self.blockSignal:
            return
        self.args = args
        if self.rateLimit == 0:
            self.timer.stop()
            self.timer.start(int(self.delay * 1000) + 1)
        else:
            now = time()
            if self.lastFlushTime is None:
                leakTime = 0
            else:
                lastFlush = self.lastFlushTime
                leakTime = max(0, (lastFlush + (1.0 / self.rateLimit)) - now)

            self.timer.stop()
            self.timer.start(int(min(leakTime, self.delay) * 1000) + 1)
rateLimitを指定していない時
rateLimitのデフォルトは0
        if self.rateLimit == 0:
            self.timer.stop()
            self.timer.start(int(self.delay * 1000) + 1)
シグナルが最後に受信されてからself.delay秒後に発光するようにタイマーを再設定している。
timer.start()はミリ秒で指定する為 *1000している。
rateLimitを指定している時
        else:
            now = time()
            if self.lastFlushTime is None:
                leakTime = 0
            else:
                lastFlush = self.lastFlushTime
                leakTime = max(0, (lastFlush + (1.0 / self.rateLimit)) - now)

            self.timer.stop()
            self.timer.start(int(min(leakTime, self.delay) * 1000) + 1)
self.lastFlushTimeはシグナルが最後に発行した時のunix時刻。
シグナルが最後に発光してから十分に時間が経過している時
例
-
self.rateLimit= 5 -
self.lastFlushTime= 100 -
now= 102
leakTime = max(0, (lastFlush + (1.0 / self.rateLimit)) - now)
= max(0, -1.8) でleakTime = 0
その後のself.timer.start(int(min(leakTime, self.delay) * 1000) + 1)でself.delayの方が大きい為delay秒後に発光する。
シグナルが(1 / rateLimit)秒未満に発生した時
例
-
self.rateLimit= 5 -
self.lastFlushTime= 100 -
now= 100.01
leakTime = max(0, (lastFlush + (1.0 / self.rateLimit)) - now)
= max(0, 0.19) でleakTime = 0.19
その後のself.timer.start(int(min(leakTime, self.delay) * 1000) + 1)でself.delayより大きければleaktime秒後に発光する。
最後に発行してからnowまでは0.01秒経過している為、0.01 + 0,19 = 0.2 = 5[Hz]
要するに
最初のこれは
proxy = pg.SignalProxy(p1.scene().sigMouseMoved, rateLimit=60, slot=mouseMoved)
マウスが動いたら(p1.scene().sigMouseMoved)を60 HzごとにmouseMovedを実行してという意味。
コード
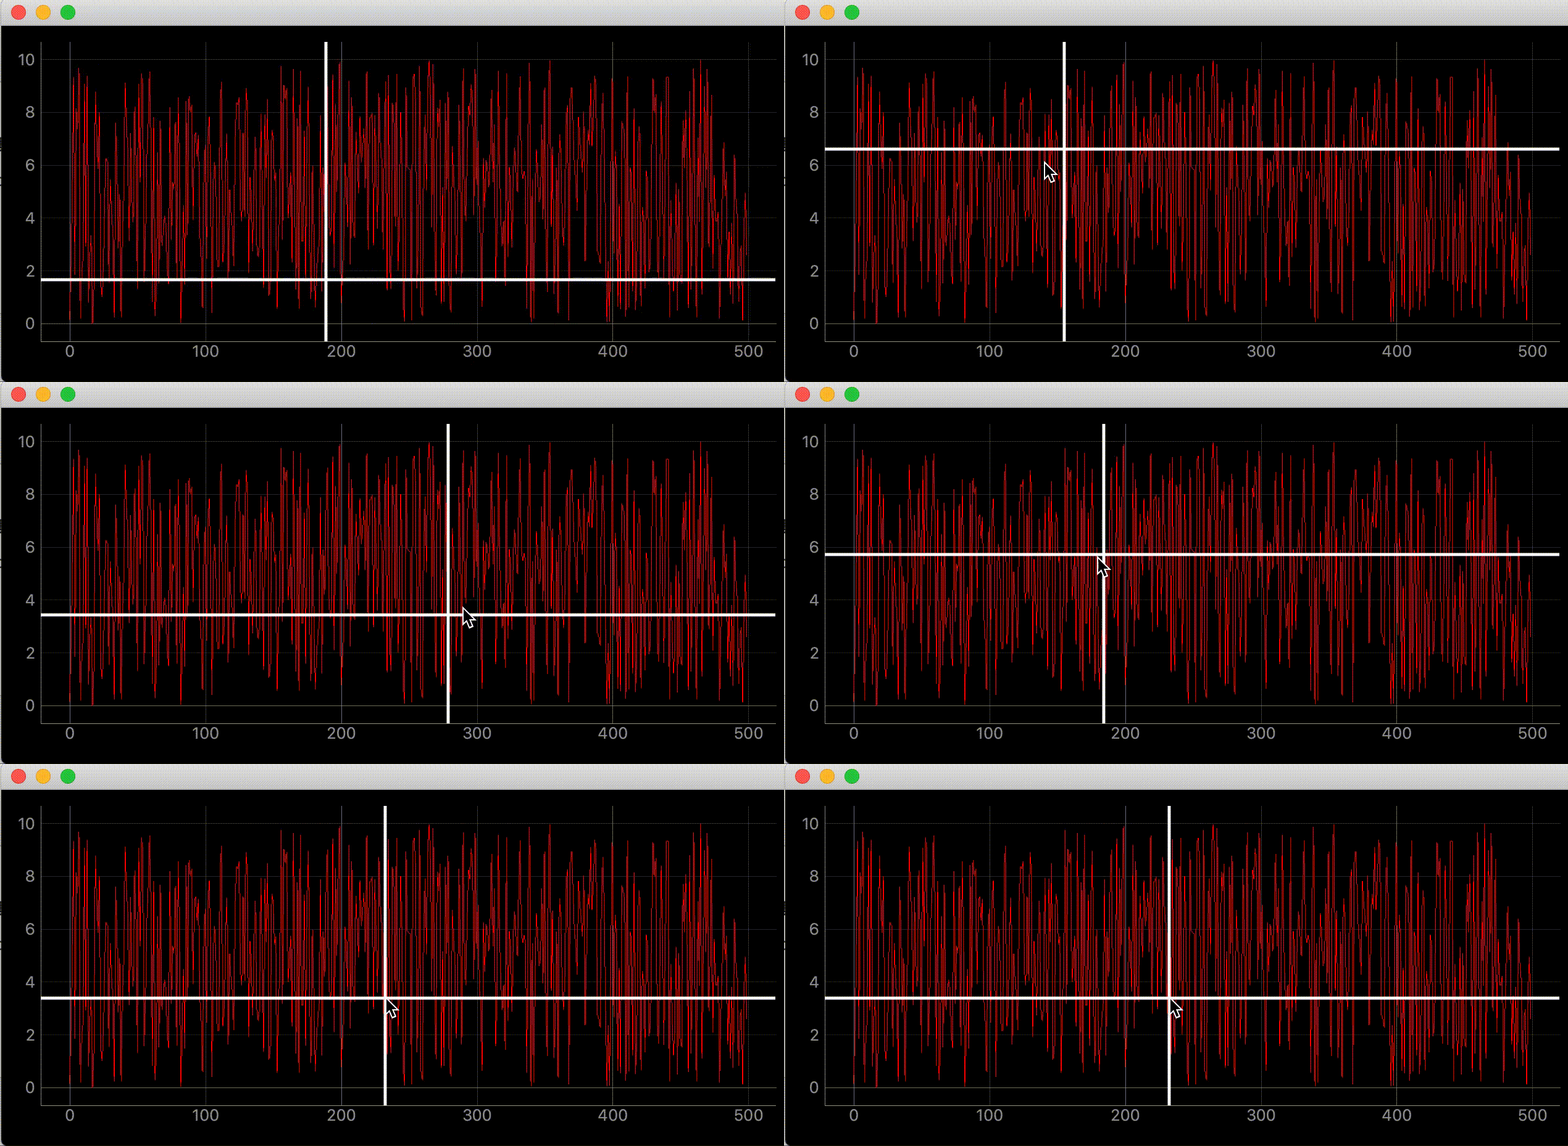
SignalProxyが何をしているか分かったので使ってみる。
プロット用にnumpyを使用。 pip install numpy

"""グラフにマウスカーソルを追いかける十字線を追加する"""

import dataclasses
from typing import Optional
import sys

import numpy as np
from PyQt5 import QtWidgets, QtCore
import pyqtgraph as pg

SAMPLE_DATA = np.random.rand(500) * 10


@dataclasses.dataclass
class AddLineWidget(pg.GraphicsLayoutWidget):
    """メイン画面
    Attributes #
    ----------
    parent: Optional[QtWidgets.QWidget] default=None
        親画面
    plotter: pyqtgraph.graphicsItems.PlotItem.PlotItem.PlotItem
        メイングラフ
    view_box: pyqtgraph.graphicsItems.ViewBox.ViewBox.ViewBox
        メイングラフのViewBox
    vertical_line: pyqtgraph.graphicsItems.InfiniteLine.InfiniteLine
        マウスカーソルを追いかける縦線
    horizontal_line: pyqtgraph.graphicsItems.InfiniteLine.InfiniteLine
        マウスカーソルを追いかける横線
    proxy: pyqtgraph.SignalProxy.SignalProxy
        マウスカーソルが動いた時に発生するシグナルの発光を制御する
    """
    parent: Optional[QtWidgets.QWidget] = None

    def __post_init__(self) -> None:
        """スーパークラス読み込みとplot, line追加"""
        super(AddLineWidget, self).__init__(parent=self.parent)

        self.add_plot_and_viewbox()
        self.add_line()
        self.set_proxy()

    def add_plot_and_viewbox(self) -> None:
        """plotとviewboxを追加する"""
        self.plotter = self.addPlot(row=0, col=0)
        self.plotter.showGrid(x=True, y=True, alpha=0.8)
        self.plotter.plot(SAMPLE_DATA, pen=pg.mkPen('#f00'))

        # self.plotterのViewBox
        self.view_box = self.plotter.vb

    def add_line(self):
        """カーソルに合わせて動くラインの追加"""
        # デフォルトでは見えにくいので色、幅指定
        self.vertical_line = pg.InfiniteLine(angle=90, movable=False, pen=pg.mkPen('#fff', width=5))
        self.horizontal_line = pg.InfiniteLine(angle=0, movable=False, pen=pg.mkPen('#fff', width=5))

        self.plotter.addItem(self.vertical_line, ignoreBounds=True)
        self.plotter.addItem(self.horizontal_line, ignoreBounds=True)

    def set_proxy(self) -> None:
        """SignalProxyを設定"""
        self.proxy = pg.SignalProxy(self.plotter.scene().sigMouseMoved, rateLimit=60, slot=self.mouse_moved)

    @QtCore.pyqtSlot(tuple)
    def mouse_moved(self, evt) -> None:
        """マウスが動いた時に60FPSごとに実行される関数
        PlotItem.scene().sigMouseMovedはグラフの座標ではなく画面のピクセル単位の座標を返す

        Parameters
        ----------
        evt: tuple
            画面のピクセル単位の座標
            ex) (PyQt5.QtCore.QPointF(2.0, 44.0),)
        """
        # 画面のピクセル座標取得
        # ex) pos=PyQt5.QtCore.QPointF(2.0, 44.0)
        pos = evt[0]
        # posがグラフ内の座標だったら
        if self.plotter.sceneBoundingRect().contains(pos):
            # グラフの座標取得
            # ex) mousePoint=PyQt5.QtCore.QPointF(141.6549821809388, 4.725564511858496)
            mouse_point = self.view_box.mapSceneToView(pos)
            # 線をmouse_pointの座標に移動
            # ex) mouse_point.x()=46.13389087421787
            self.vertical_line.setPos(mouse_point.x())
            # ex) mouse_point.y()=9.535145662930628
            self.horizontal_line.setPos(mouse_point.y())


def main() -> None:
    app = QtWidgets.QApplication(sys.argv)
    window = AddLineWidget(parent=None)
    window.show()
    sys.exit(app.exec_())


if __name__ == "__main__":
    main()
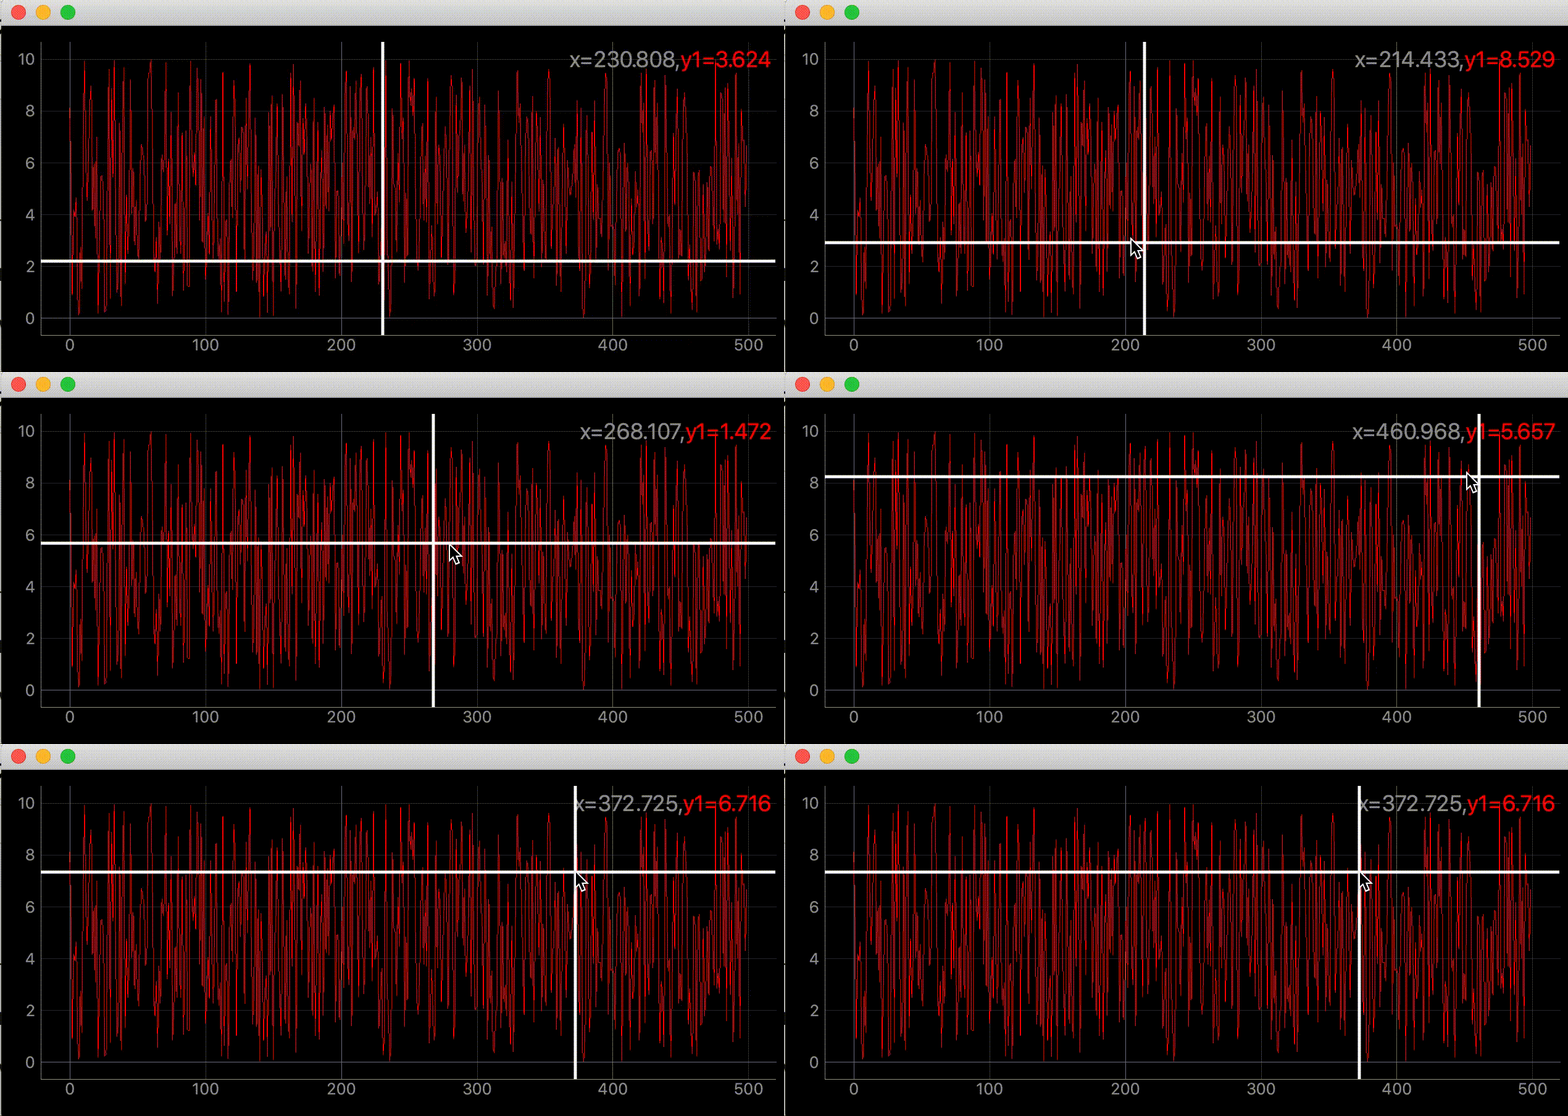
右上に座標を表示する

"""グラフにマウスカーソルを追いかける十字線を追加する"""

import dataclasses
from typing import Optional
import sys

import numpy as np
from PyQt5 import QtWidgets, QtCore
import pyqtgraph as pg

SAMPLE_DATA = np.random.rand(500) * 10


@dataclasses.dataclass
class AddLineWidget(pg.GraphicsLayoutWidget):
    """メイン画面
    Attributes #
    ----------
    parent: Optional[QtWidgets.QWidget] default=None
        親画面
    plotter: pyqtgraph.graphicsItems.PlotItem.PlotItem.PlotItem
        メイングラフ
    view_box: pyqtgraph.graphicsItems.ViewBox.ViewBox.ViewBox
        メイングラフのViewBox
    vertical_line: pyqtgraph.graphicsItems.InfiniteLine.InfiniteLine
        マウスカーソルを追いかける縦線
    horizontal_line: pyqtgraph.graphicsItems.InfiniteLine.InfiniteLine
        マウスカーソルを追いかける横線
    proxy: pyqtgraph.SignalProxy.SignalProxy
        マウスカーソルが動いた時に発生するシグナルの発光を制御する
    """
    parent: Optional[QtWidgets.QWidget] = None

    def __post_init__(self) -> None:
        """スーパークラス読み込みとlabel, plot, line追加"""
        super(AddLineWidget, self).__init__(parent=self.parent)

        self.add_label()
        self.add_plot_and_viewbox()
        self.add_line()
        self.set_proxy()

    def add_plot_and_viewbox(self) -> None:
        """plotとviewboxを追加する"""
        self.plotter = self.addPlot(row=0, col=0)
        self.plotter.showGrid(x=True, y=True, alpha=0.8)
        self.plotter.plot(SAMPLE_DATA, pen=pg.mkPen('#f00'))

        # self.plotterのViewBox
        self.view_box = self.plotter.vb

    def add_label(self) -> None:
        """座標を表示するラベルを追加"""
        self.label = pg.LabelItem(justify='right')
        self.addItem(self.label)


    def add_line(self):
        """カーソルに合わせて動くラインの追加"""
        # デフォルトでは見えにくいので色、幅指定
        self.vertical_line = pg.InfiniteLine(angle=90, movable=False, pen=pg.mkPen('#fff', width=5))
        self.horizontal_line = pg.InfiniteLine(angle=0, movable=False, pen=pg.mkPen('#fff', width=5))

        self.plotter.addItem(self.vertical_line, ignoreBounds=True)
        self.plotter.addItem(self.horizontal_line, ignoreBounds=True)

    def set_proxy(self) -> None:
        """SignalProxyを設定"""
        self.proxy = pg.SignalProxy(self.plotter.scene().sigMouseMoved, rateLimit=60, slot=self.mouse_moved)

    @QtCore.pyqtSlot(tuple)
    def mouse_moved(self, evt) -> None:
        """マウスが動いた時に60FPSごとに実行される関数
        PlotItem.scene().sigMouseMovedはグラフの座標ではなく画面のピクセル単位の座標を返す

        Parameters
        ----------
        evt: tuple
            画面のピクセル単位の座標
            ex) (PyQt5.QtCore.QPointF(2.0, 44.0),)
        """
        # 画面のピクセル座標取得
        # ex) pos=PyQt5.QtCore.QPointF(2.0, 44.0)
        pos = evt[0]
        # posがグラフ内の座標だったら
        if self.plotter.sceneBoundingRect().contains(pos):
            # グラフの座標取得
            # ex) mousePoint=PyQt5.QtCore.QPointF(141.6549821809388, 4.725564511858496)
            mouse_point = self.view_box.mapSceneToView(pos)

            # SAMPLE_DATA内の座標であればx, y値を表示する
            index = int(mouse_point.x())
            if 0 < index < len(SAMPLE_DATA):
                self.label.setText(
                    f"<span style='font-size: 18pt'>x={mouse_point.x():.3f},"
                    f"<span style='color: red'>y1={SAMPLE_DATA[index]:.3f}</span>")

            # 線をmouse_pointの座標に移動
            # ex) mouse_point.x()=46.13389087421787
            self.vertical_line.setPos(mouse_point.x())
            # ex) mouse_point.y()=9.535145662930628
            self.horizontal_line.setPos(mouse_point.y())


def main() -> None:
    app = QtWidgets.QApplication(sys.argv)
    window = AddLineWidget(parent=None)
    window.show()
    sys.exit(app.exec_())


if __name__ == "__main__":
    main()
参考
SignalProxy
Python pyqtgraph package v0.10.0, pyqtgraph.SignalProxy module source code :: PyDoc.net
ViewBox
ViewBox — pyqtgraph 0.11.1.dev0 documentation
SignalProxy
Python pyqtgraph package v0.10.0, pyqtgraph.SignalProxy module source code :: PyDoc.net