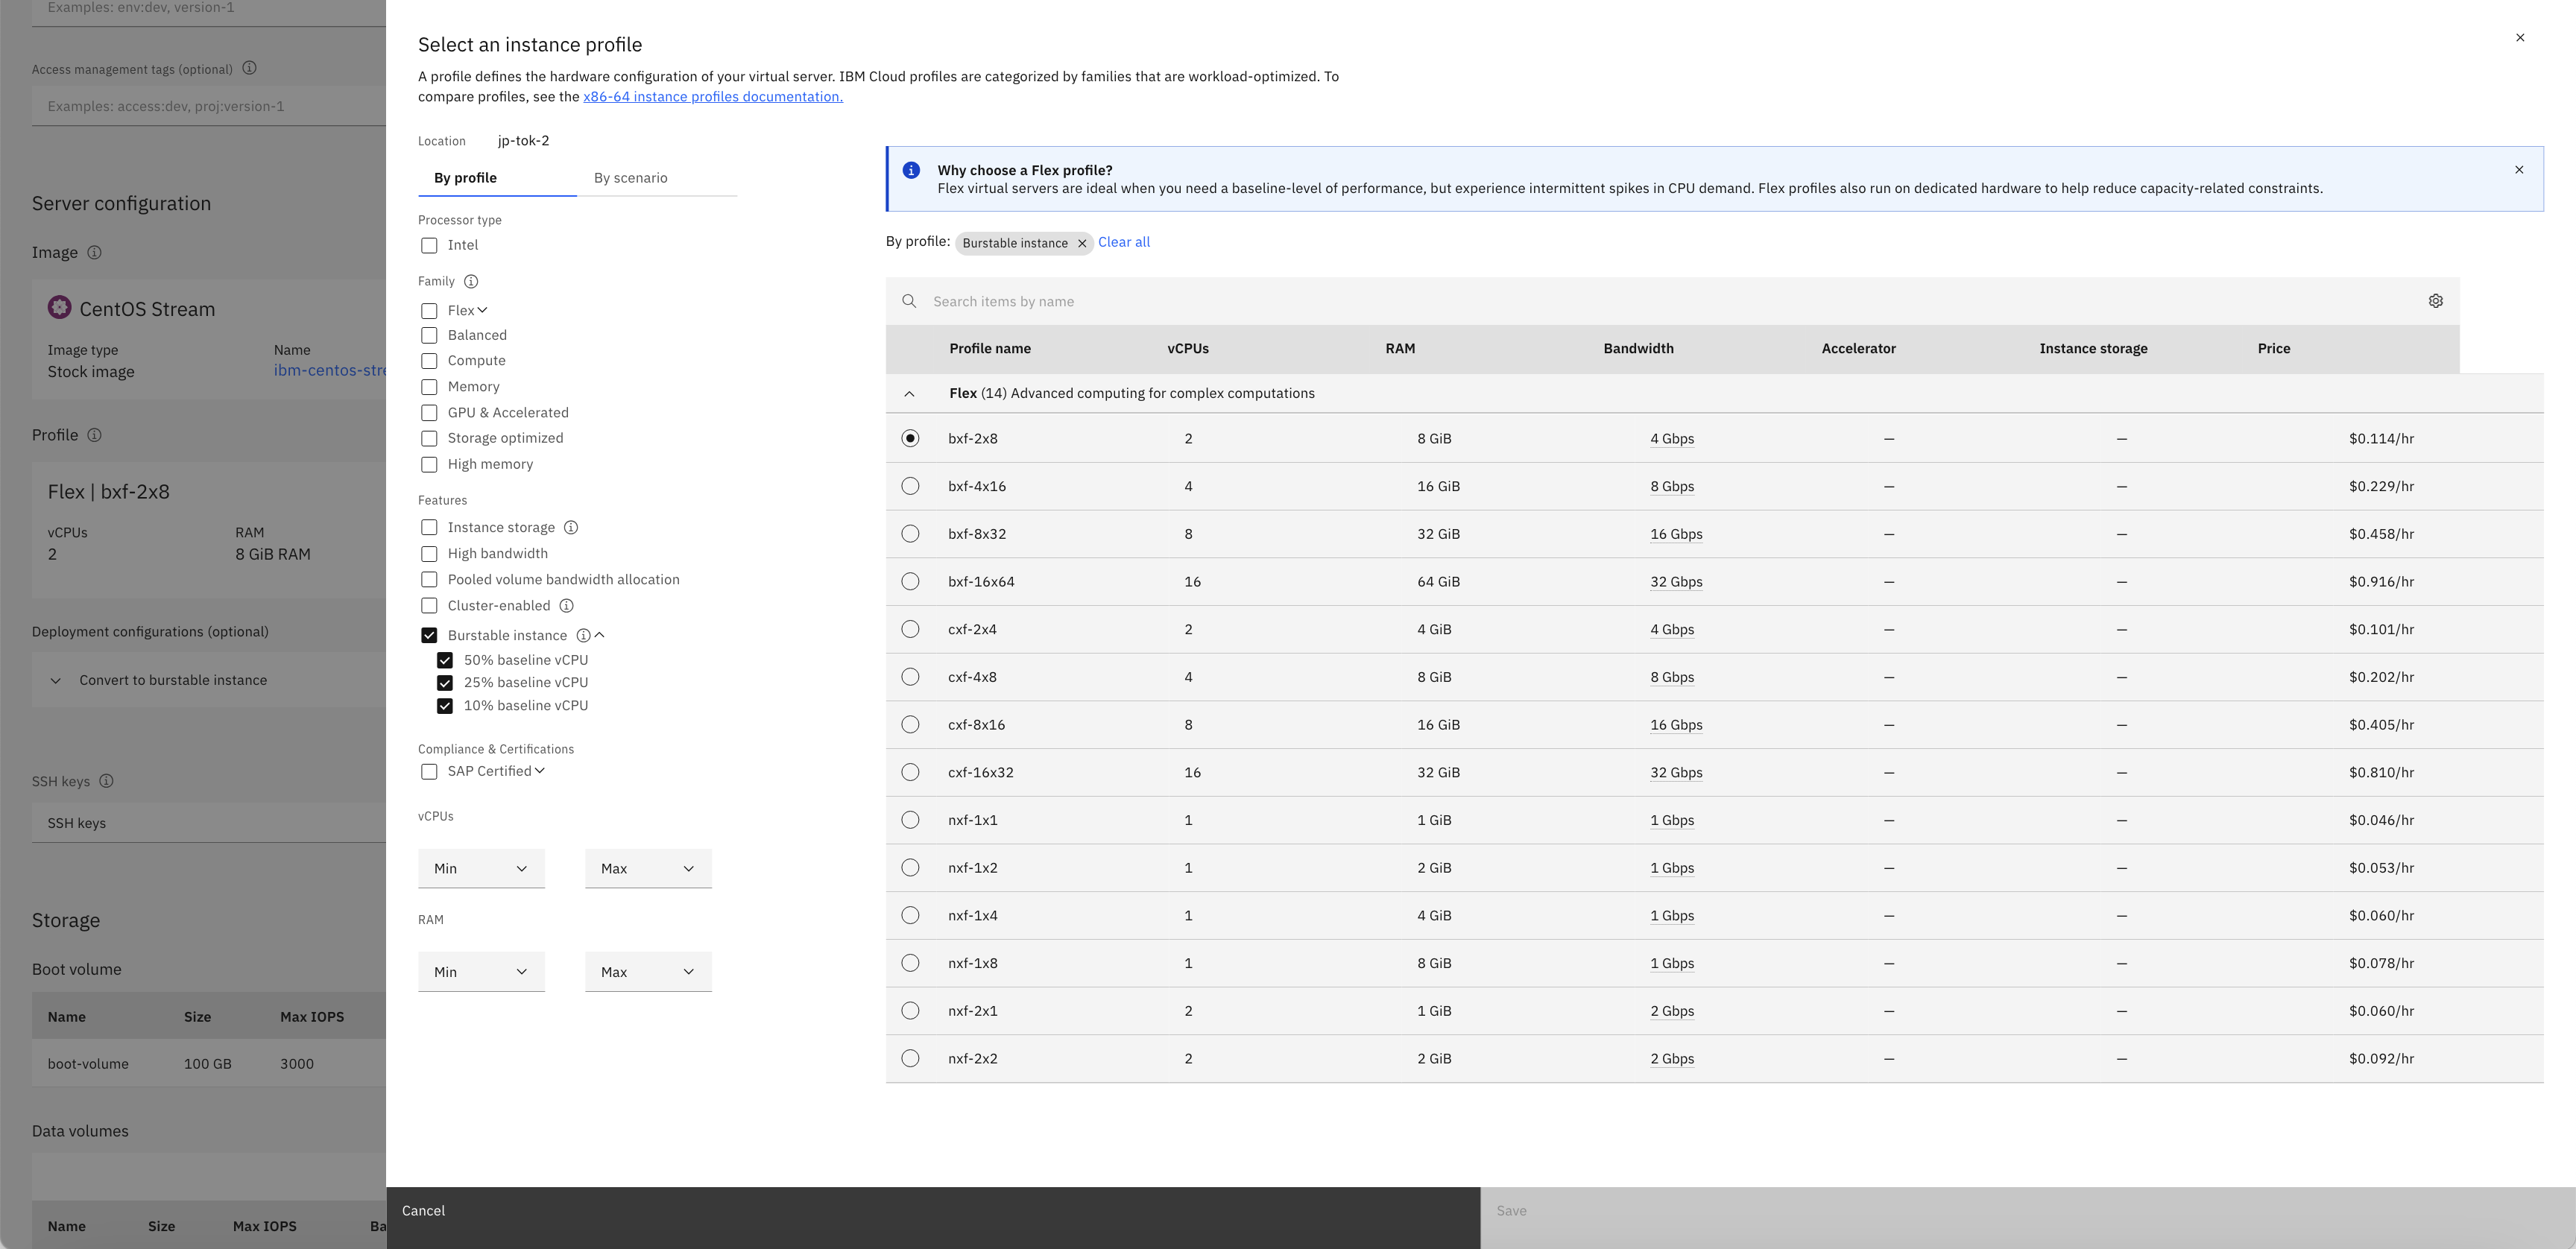
VSI for VPCのBurstable profileは、CPU baselinesとして10%, 25%, 50%を選択し、バースト時にもしそのホストのCPUに余裕があれば最大でその2倍まで利用可能というプロファイル。
cxf-8x16: 25% baseline vCPUを利用した場合
- 8vCPU環境
- yes > /dev/nullを16個実行してCPUを使い切ろうとしても、vmstatではus+sysは50%を超えることがなく(baseline x 2に収まっているので想定通り)、stが大量に発生してCPU待ちになっている状態。
[root@syasuda-burst-test2 ~]# lscpu |grep "CPU(s)"
CPU(s):                                  8
On-line CPU(s) list:                     0-7
NUMA node0 CPU(s):                       0-7

[root@syasuda-burst-test2 ~]# ps -ef|grep yes |grep -v grep
root        1438    1347 39 14:53 pts/0    00:09:50 yes
root        1439    1347 38 14:53 pts/0    00:09:45 yes
root        1440    1347 38 14:53 pts/0    00:09:40 yes
root        1441    1347 38 14:53 pts/0    00:09:40 yes
root        1442    1347 38 14:53 pts/0    00:09:40 yes
root        1445    1347 38 14:53 pts/0    00:09:36 yes
root        1446    1347 38 14:53 pts/0    00:09:41 yes
root        1447    1347 38 14:53 pts/0    00:09:42 yes
root        1448    1347 38 14:54 pts/0    00:09:32 yes
root        1449    1347 38 14:54 pts/0    00:09:30 yes
root        1815    1347 25 15:16 pts/0    00:00:36 yes
root        1816    1347 24 15:16 pts/0    00:00:35 yes
root        1817    1347 25 15:16 pts/0    00:00:35 yes
root        1818    1347 24 15:16 pts/0    00:00:35 yes
root        1819    1347 24 15:16 pts/0    00:00:34 yes
root        1820    1347 25 15:16 pts/0    00:00:35 yes


[root@syasuda-burst-test2 ~]# vmstat -w 1
--procs-- -----------------------memory---------------------- ---swap-- -----io---- -system-- --------cpu--------
   r    b         swpd         free         buff        cache   si   so    bi    bo   in   cs  us  sy  id  wa  st
  16    0            0     15584796         3124       321476    0    0    17     6  604   36  13  37   4   0  47
  16    0            0     15584796         3124       321476    0    0     0     0 5188  493  13  38   0   0  48
  16    0            0     15584796         3124       321476    0    0     0     0 5195  477  13  38   0   0  48
  16    0            0     15584796         3124       321476    0    0     0     0 5090  386  14  38   0   0  48
  16    0            0     15584796         3124       321476    0    0     0     0 5081  384  13  39   0   0  48
  16    0            0     15584796         3124       321476    0    0     0     0 5089  402  13  39   0   0  48
  16    0            0     15584796         3124       321476    0    0     0     0 5072  390  13  38   0   0  49
- しかし、IBM Cloud PortalやIBM Cloud Monitoringの平均CPU使用率は200%になっている。
- IBM Cloud Portal
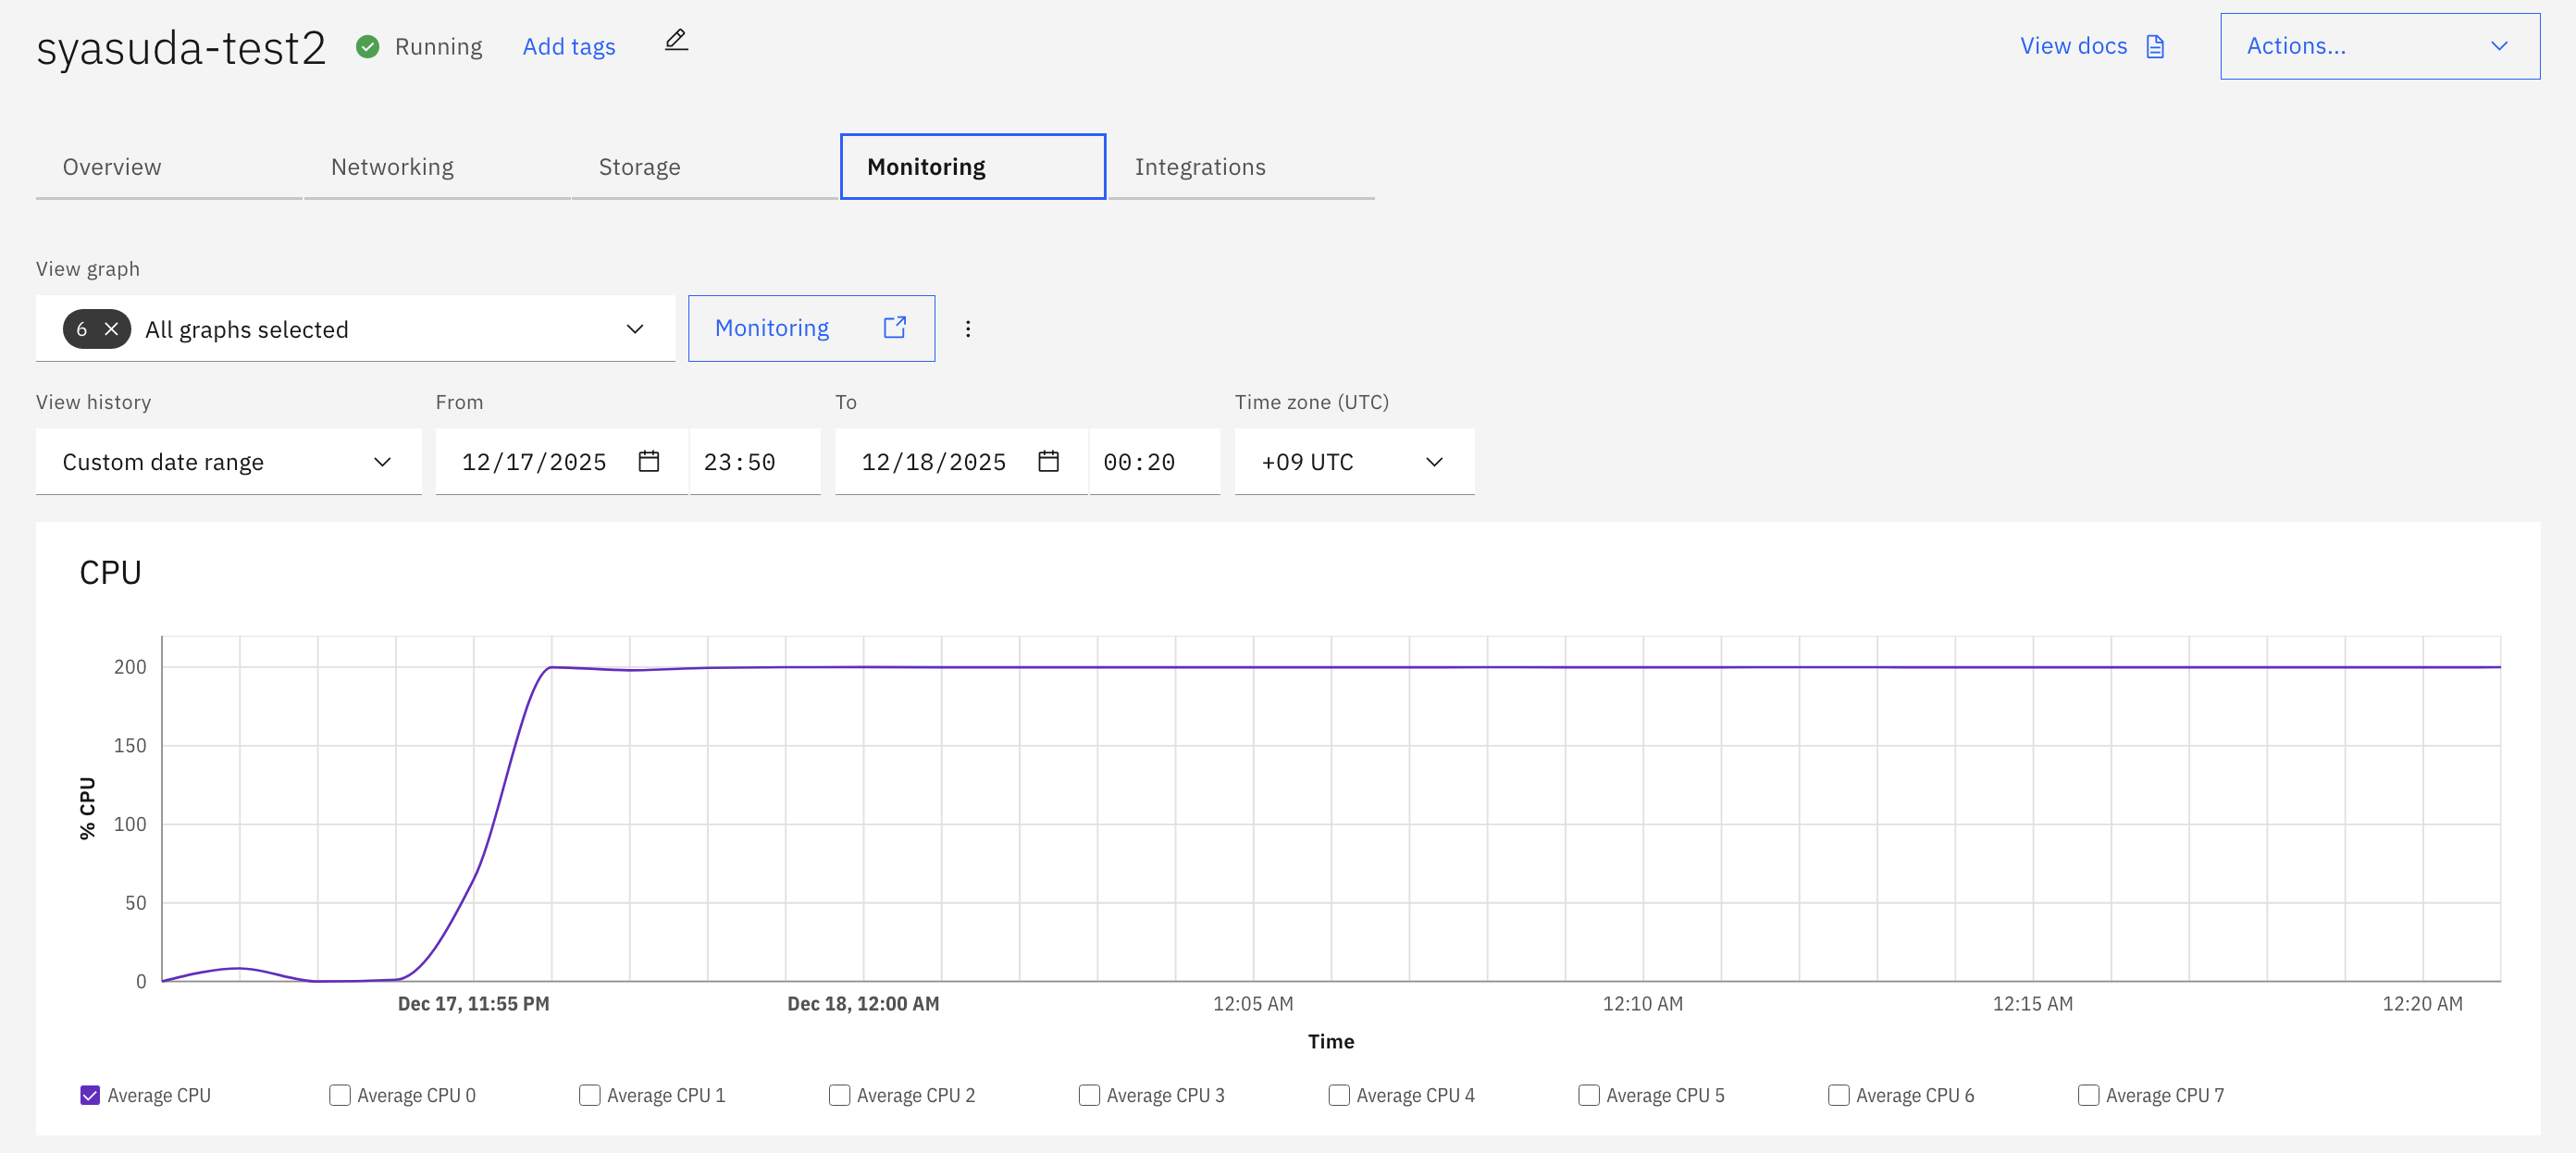
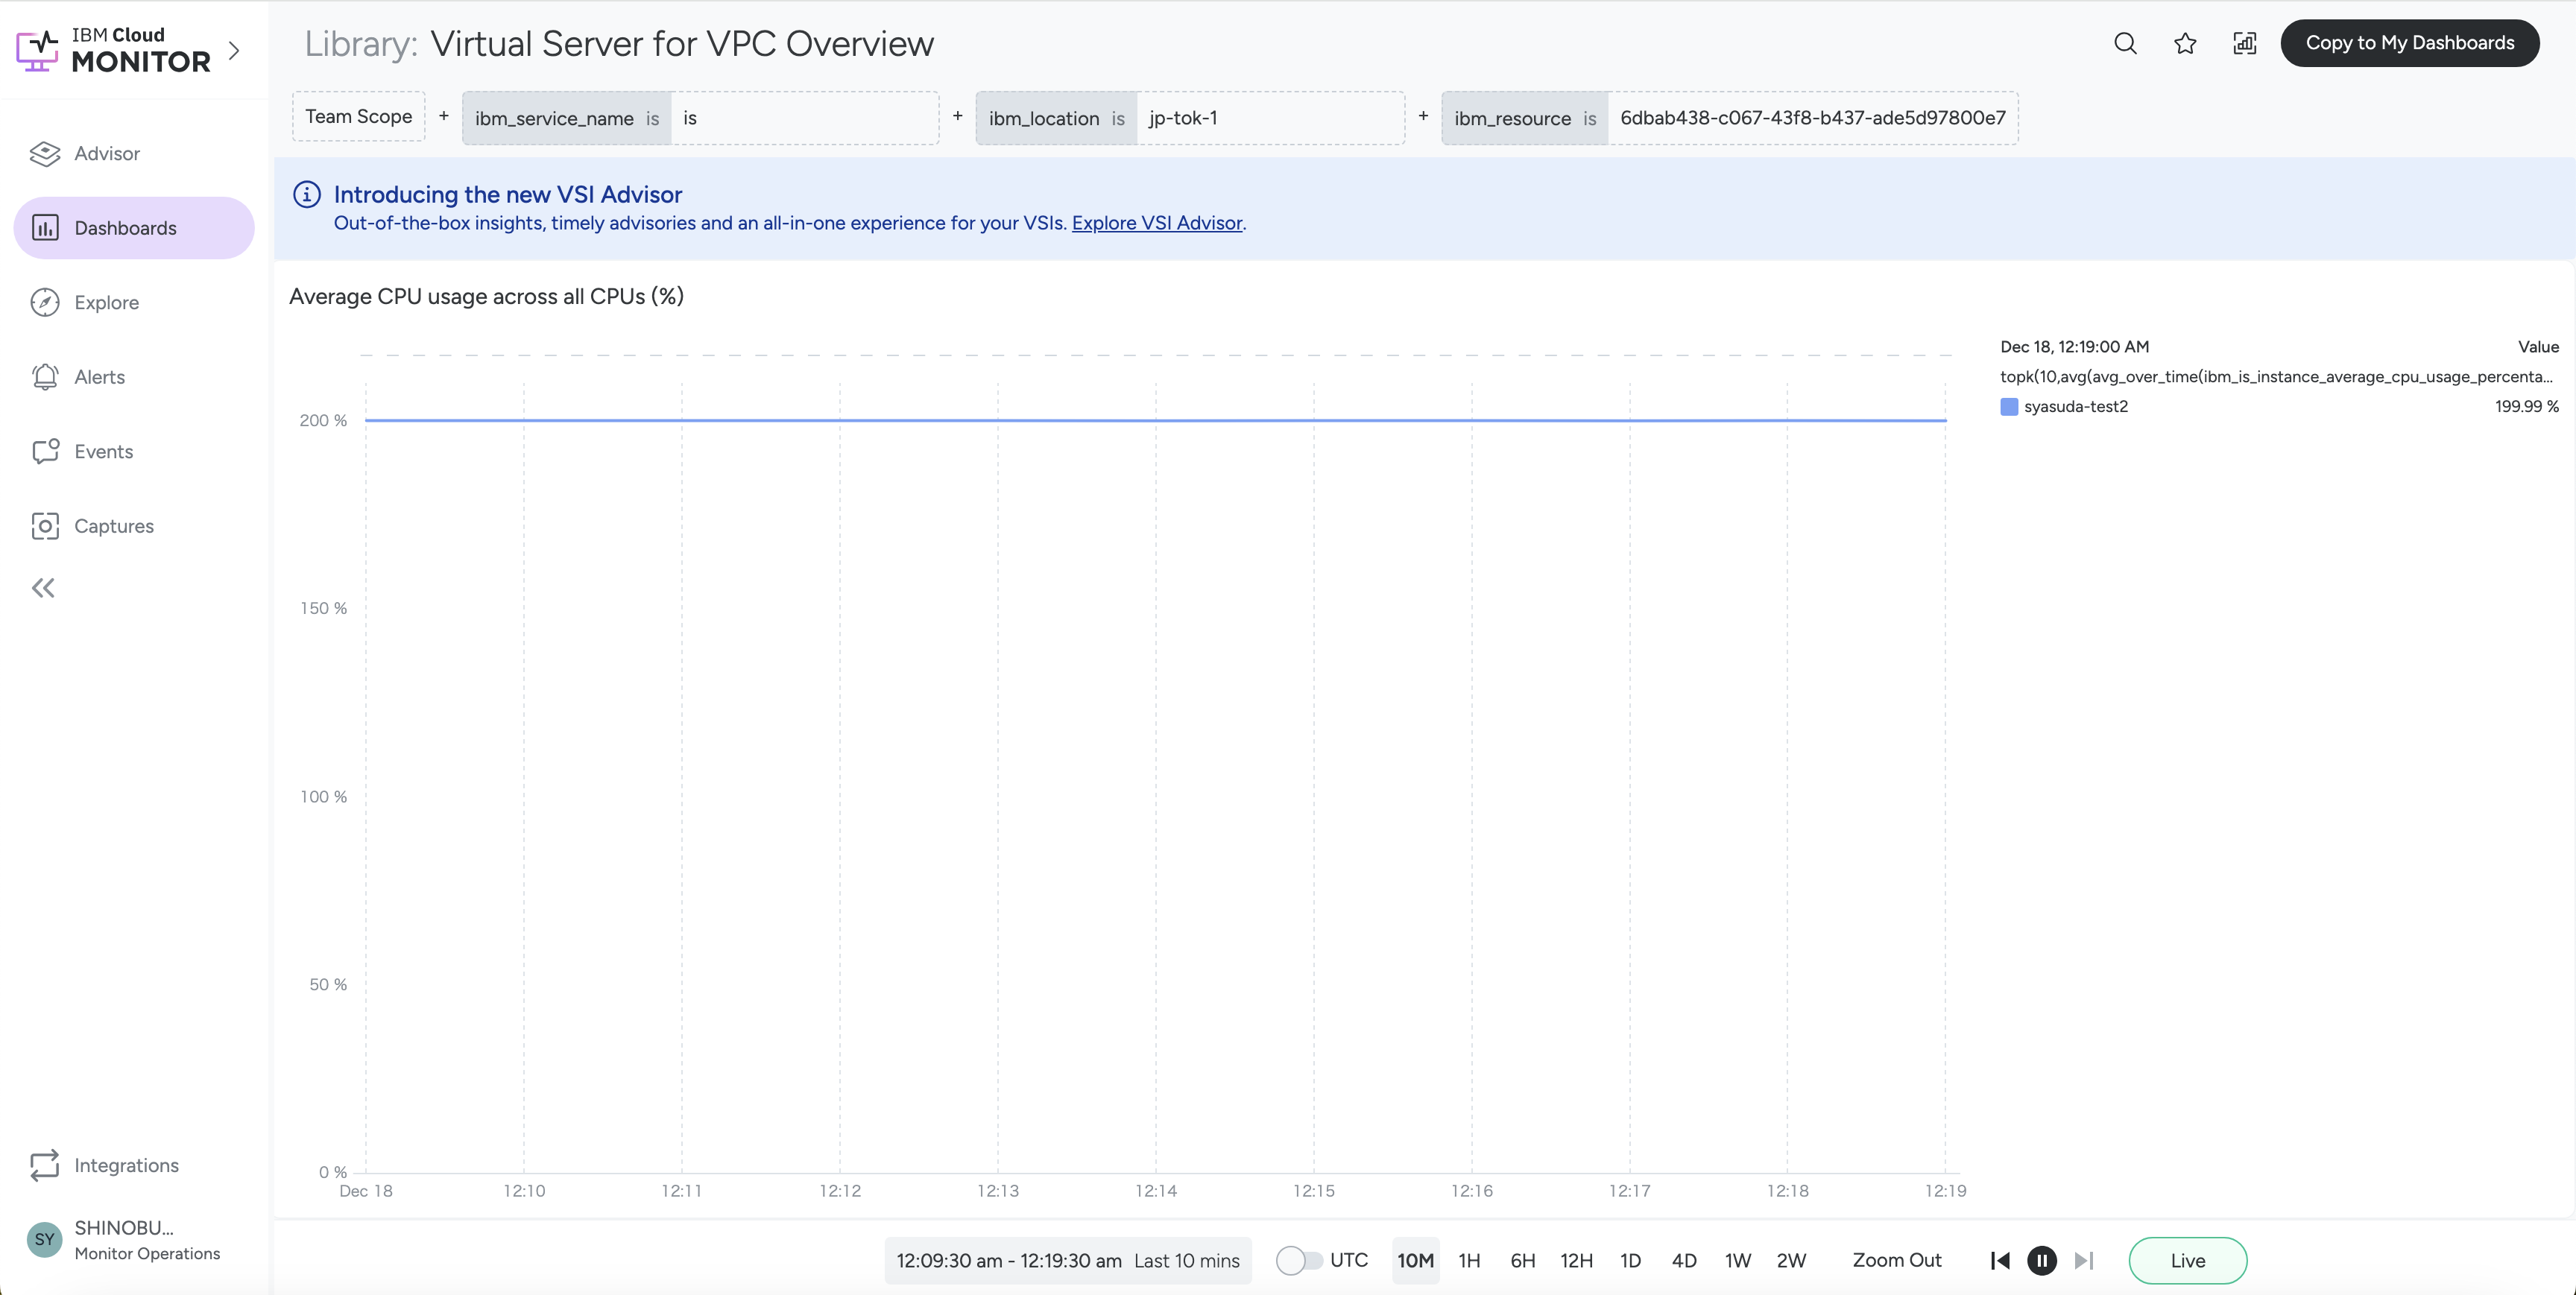
- IBM Cloud Monitoring
- IBM Cloud Portal
IBM Cloud Monitoringの平均CPU使用率は、ibm_is_instance_average_cpu_usage_percentage というメトリックを使っていますが、これはHypervisorレベルで取得している値のようです。VMに割り当てられた基準の2倍使われていれば200%であり(つまりBurstableであればCPUを使い切っていれば200%)、基準通りなら100%と表示されるだけかもしれません。
https://community.ibm.com/community/user/blogs/neil-delima1/2024/03/20/golden-signals-for-cloud-service-observability
In the case of VPC VSIs, the metric:
ibm_is_instance_average_cpu_usage_percentage
which is the average percentage usage across all CPUs for the VSI is an indicator of resource utilization. This metric produced by the IBM Cloud VPC service and available in IBM Cloud monitoring is collected at the Hypervisor level and should be identified as a Golden signal for saturation.
nxf-2x2 : 10% baseline vCPUを利用した場合
- 2vCPU環境
- yes > /dev/nullを8個実行してCPUを使い切ろうとしても、vmstatではus+sysは20%を超えることがなく(baseline x 2に収まっているので想定通り)、stが大量に発生してCPU待ちになっている状態。
[root@syasuda-burst-test3 ~]# lscpu |grep "CPU(s)"
CPU(s):                                  2
On-line CPU(s) list:                     0,1
NUMA node0 CPU(s):                       0,1

[root@syasuda-burst-test3 ~]# ps -ef|grep yes |grep -v grep
root        1311    1278  7 23:05 pts/0    00:00:01 yes
root        1312    1278  6 23:05 pts/0    00:00:01 yes
root        1313    1278  5 23:05 pts/0    00:00:00 yes
root        1314    1278  5 23:05 pts/0    00:00:00 yes
root        1315    1278  5 23:05 pts/0    00:00:00 yes
root        1316    1278  5 23:05 pts/0    00:00:00 yes
root        1317    1278  5 23:05 pts/0    00:00:00 yes
root        1318    1278  5 23:05 pts/0    00:00:00 yes

[root@syasuda-burst-test3 ~]# vmstat -w 1
--procs-- -----------------------memory---------------------- ---swap-- -----io---- -system-- --------cpu--------
   r    b         swpd         free         buff        cache   si   so    bi    bo   in   cs  us  sy  id  wa  st
   9    0            0      1374996         3124       183728    0    0    50     3  293  132   5  13   3   0  79
   8    0            0      1374996         3124       183728    0    0     0     0  666  277   4  14   0   0  82
   9    0            0      1374996         3124       183728    0    0     0     0  665  283   4  13   0   0  83
   8    0            0      1374996         3124       183728    0    0     0     0  608  233   5  13   0   0  82
   8    0            0      1374996         3124       183728    0    0     0     0  553  196   4  13   0   0  83
   8    0            0      1374996         3124       183728    0    0     0     0  556  192   5  13   0   0  82
   8    0            0      1374996         3124       183728    0    0     0     0  550  190   6  12   0   0  82
   8    0            0      1374996         3124       183728    0    0     0     0  557  188   5  13   0   0  82
   8    0            0      1374996         3124       183728    0    0     0     0  551  189   4  13   0   0  83
   8    0            0      1374996         3124       183728    0    0     0     0  540  201   5  13   0   0  83
   8    0            0      1374996         3124       183728    0    0     0     0  557  191   5  13   0   0  83
   8    0            0      1374996         3124       183728    0    0     0     0  560  200   4  14   0   0  82
   8    0            0      1374996         3124       183728    0    0     0     0  546  186   5  13   0   0  82
   8    0            0      1374996         3124       183728    0    0     0     0  547  191   4  13   0   0  83
   8    0            0      1374996         3124       183728    0    0     0     0  553  190   5  14   0   0  82
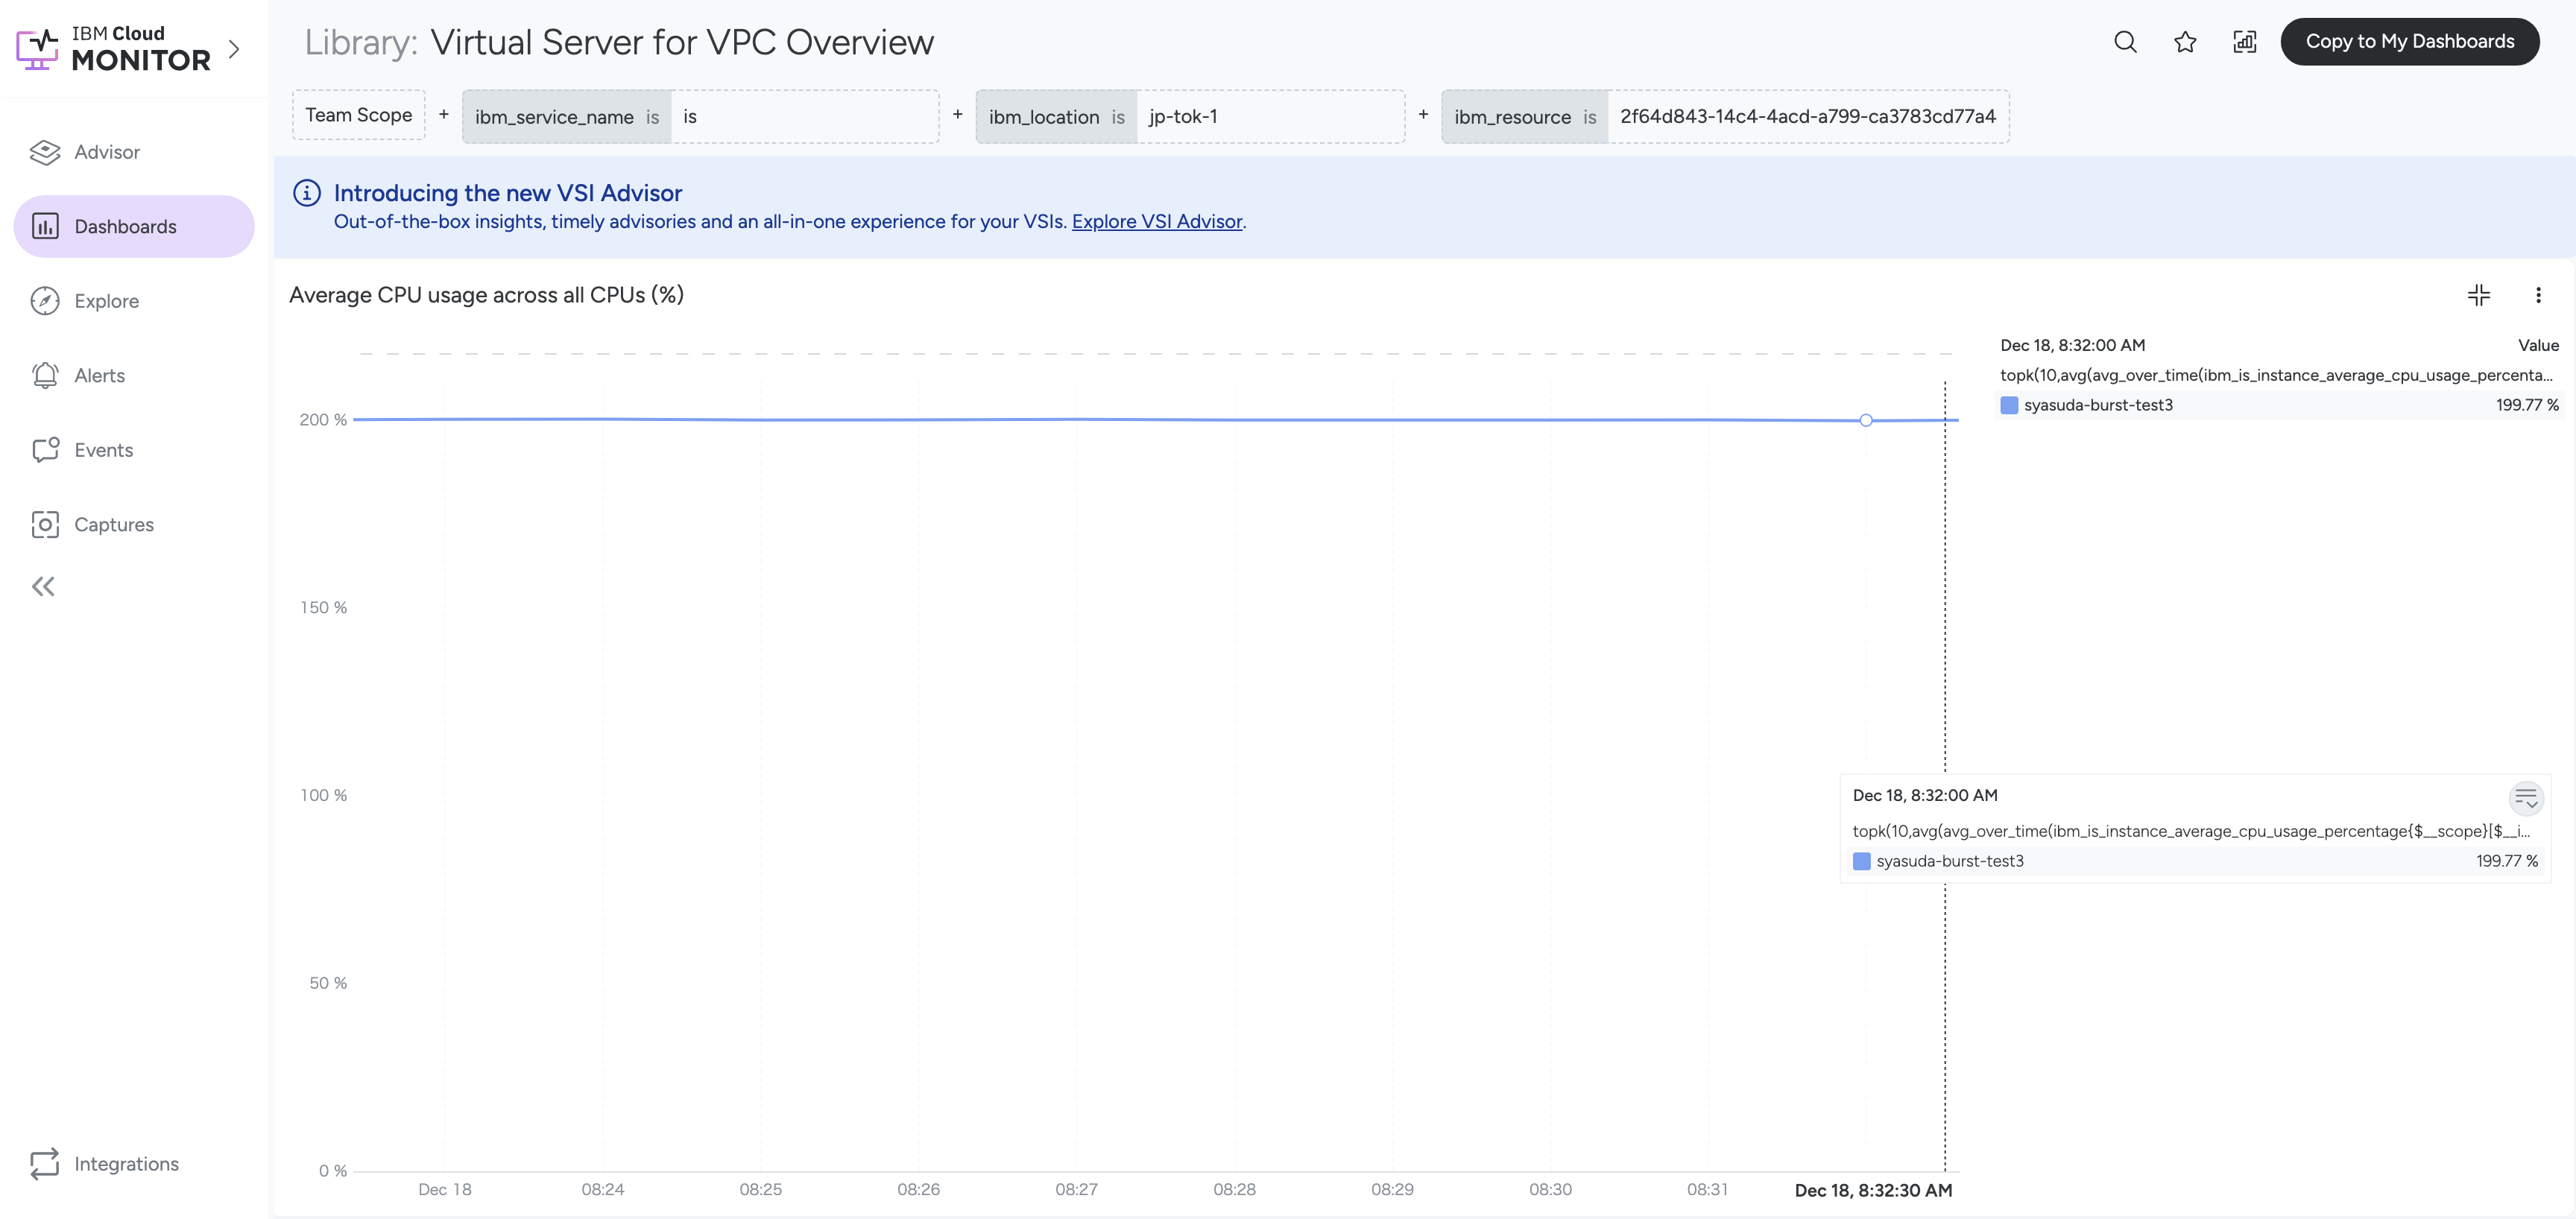
- こちらも、IBM Cloud PortalやIBM Cloud Monitoringの平均CPU使用率は200%になっている。
- IBM Cloud Portal
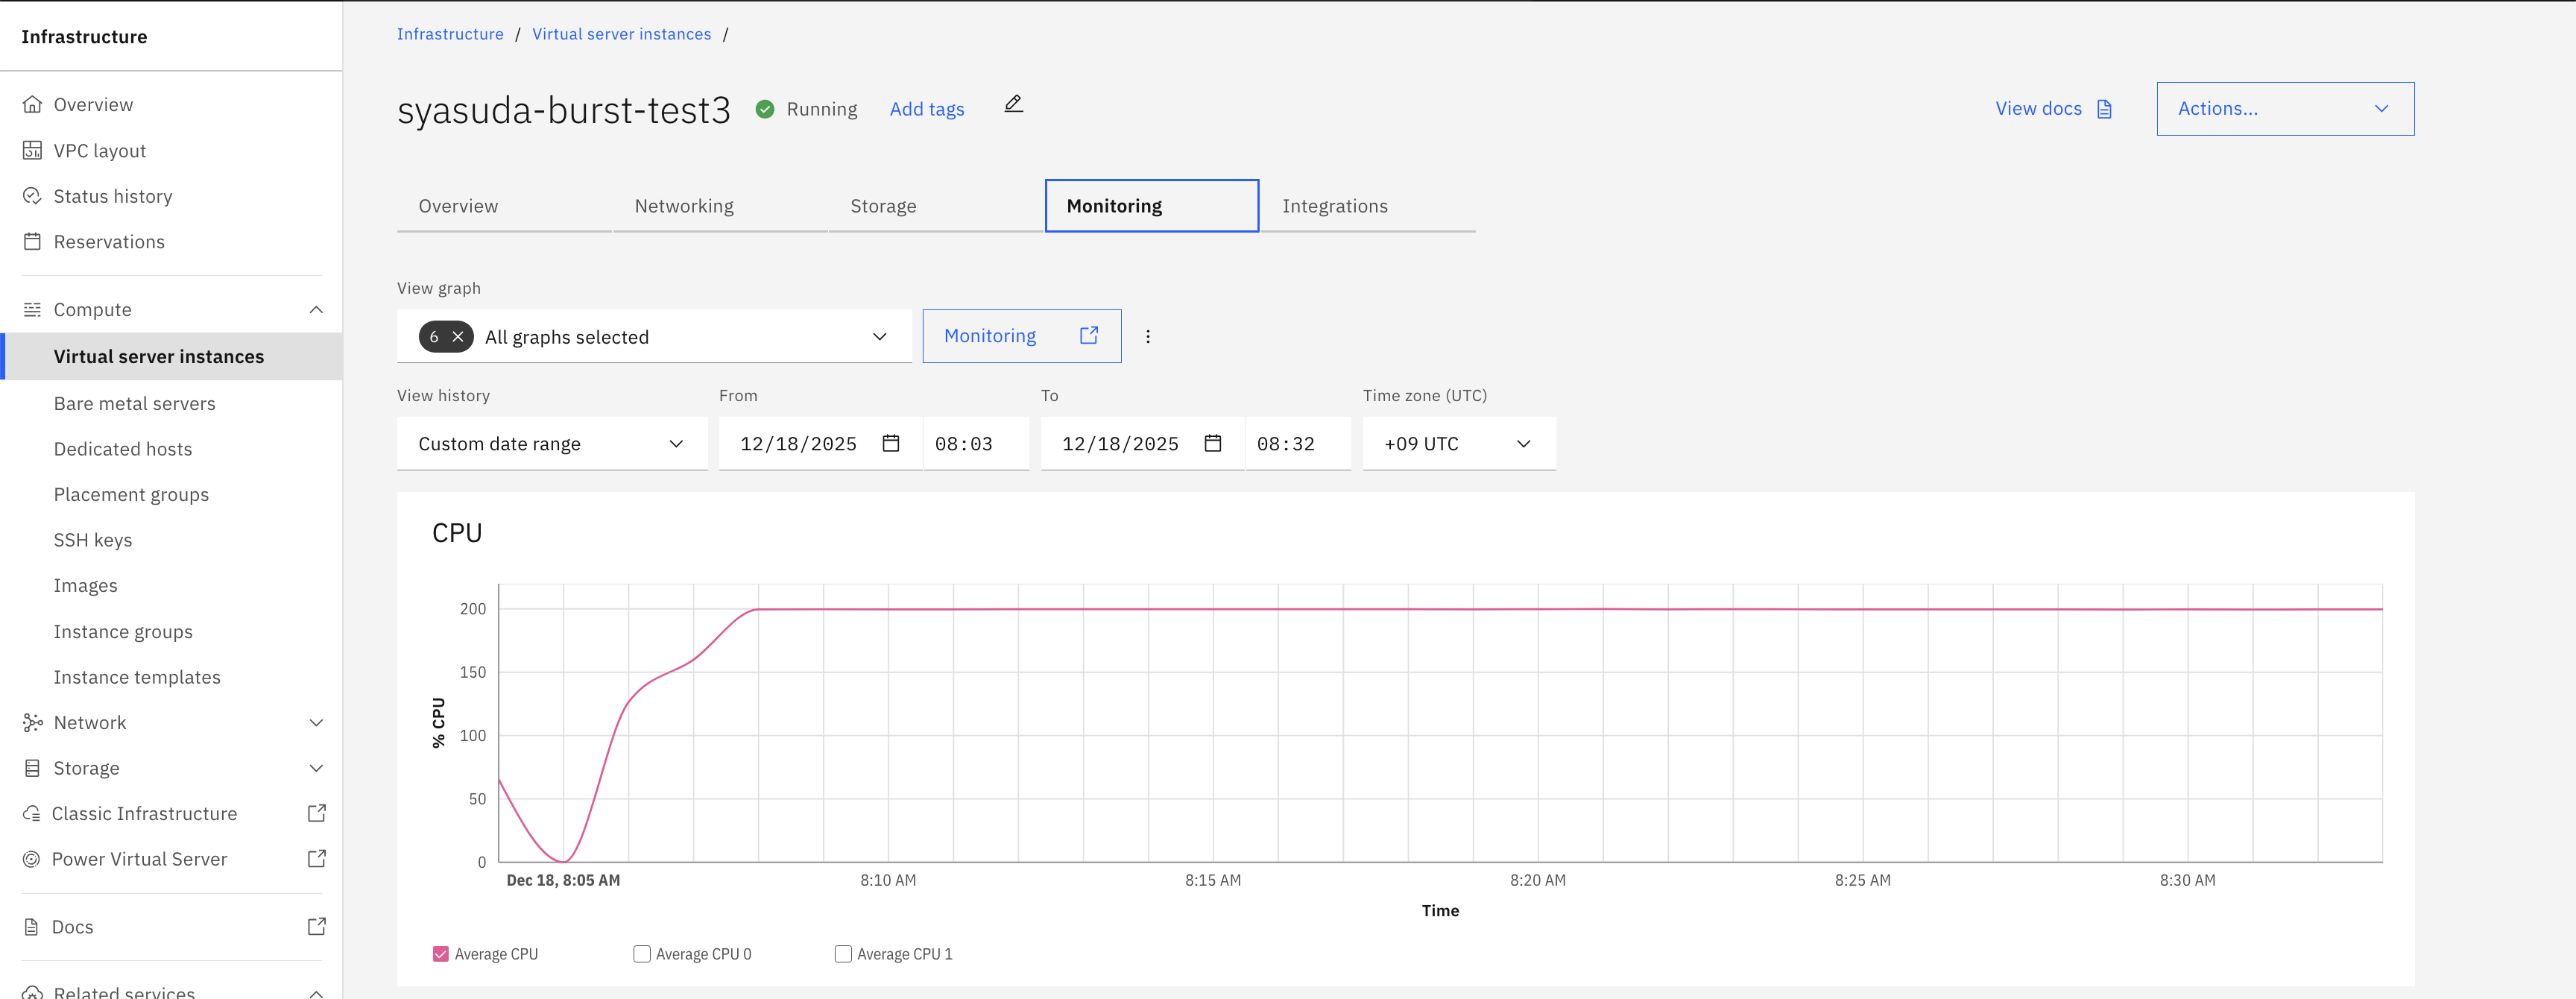
- IBM Cloud Monitoring
- IBM Cloud Portal