ボリュームあたり最大 300,000 IOPS および 2,680 MB/秒のスループットを備えた Ultra High Performance Volumes (UHP) ブロック ボリュームを、サポートされているコンピューティング インスタンスでこのパフォーマンスを活用できます。
ということで、Oracle Cloud Infrastructure Block Volumeサービスのパフォーマンス・テストを実行するために使用できる FIOコマンド で IOPS と スループットを計測してみてみます。
■ 超高パフォーマンス・ボリュームのためのアタッチメントの構成
超高パフォーマンス・レベルで構成されたボリュームをアタッチして、最適なパフォーマンスを実現するには、ボリューム・アタッチメントをマルチパス対応にする必要があります。
ブロック・ボリューム・サービスでは、ボリュームをアタッチする際に、アタッチメントがマルチパス対応になるよう試行します。満たしていない前提条件があると、ボリューム・アタッチメントはマルチパス対応になりません。
● マルチパス対応のiSCSIアタッチメント前提条件
マルチパス対応のiSCSIボリュームアタッチメントを構成するために必要な前提条件
・サポートされているシェイプ
・サポートされてるイメージ
・インスタンスに、同じインスタンスの別のマルチパス対応アタッチメントが存在しないこと。
・インスタンスのブロック・ボリューム管理プラグインを有効化
・ブロック・ボリューム管理プラグインのパブリックIPアドレスまたはサービス・ゲートウェイを設定
・権限の構成
・一貫性のあるデバイス・パスを使用
■ 権限の構成
ブロック・ボリューム管理プラグインが、マルチパス対応iSCSIアタッチメントのiSCSI設定の結果をレポートできるよう、権限を構成する必要があります
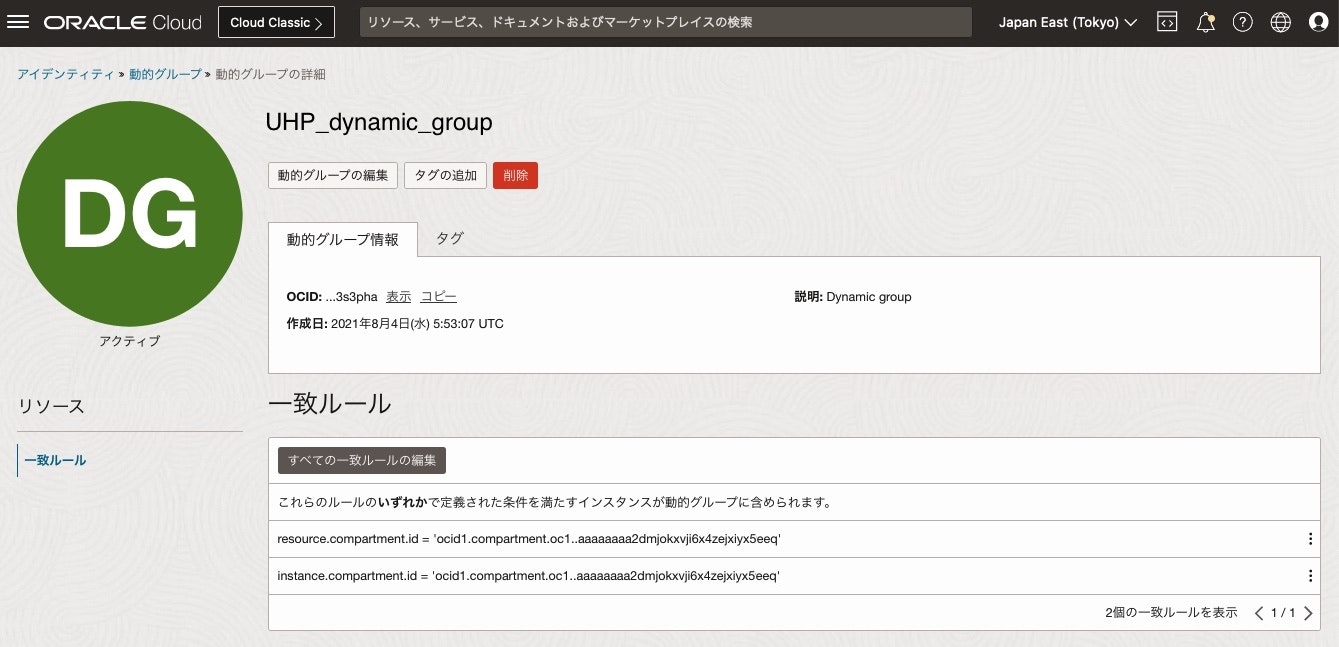
1) 動的グループの作成
次のコード・サンプルの一致ルールを使用して動的グループを作成し、指定したコンパートメント内のすべてのインスタンスを追加します
ANY {instance.compartment.id = '<テナンシOCID>', instance.compartment.id = '<コンパートメントOCID>'}
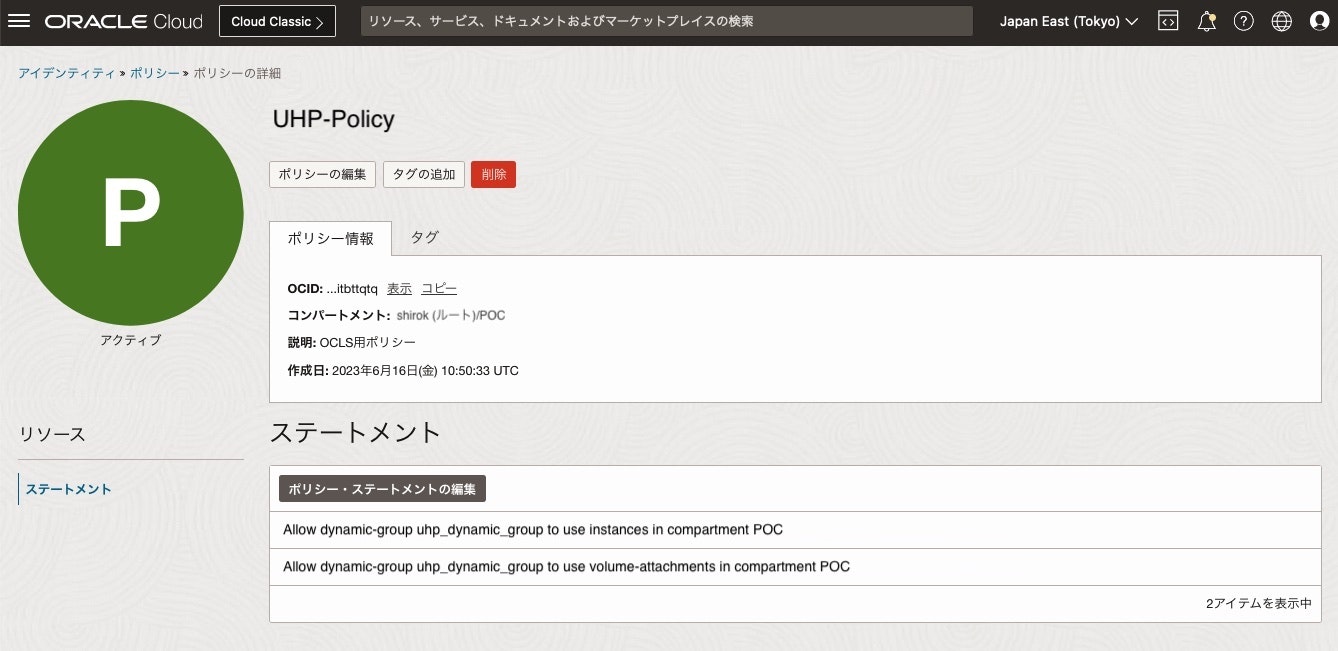
2) 動的グループのポリシーの構成
前のステップで作成した動的グループに権限を付与するポリシーを構成して、インスタンス・エージェントによるアクセスを可能にし、ブロック・ボリューム・サービスをコールして、アタッチメント構成を取得できるようにします。
Allow dynamic-group InstantAgent to use instances in tenancy <テナンシ名>
Allow dynamic-group InstantAgent to use volume-attachments in tenancy <テナンシ名>
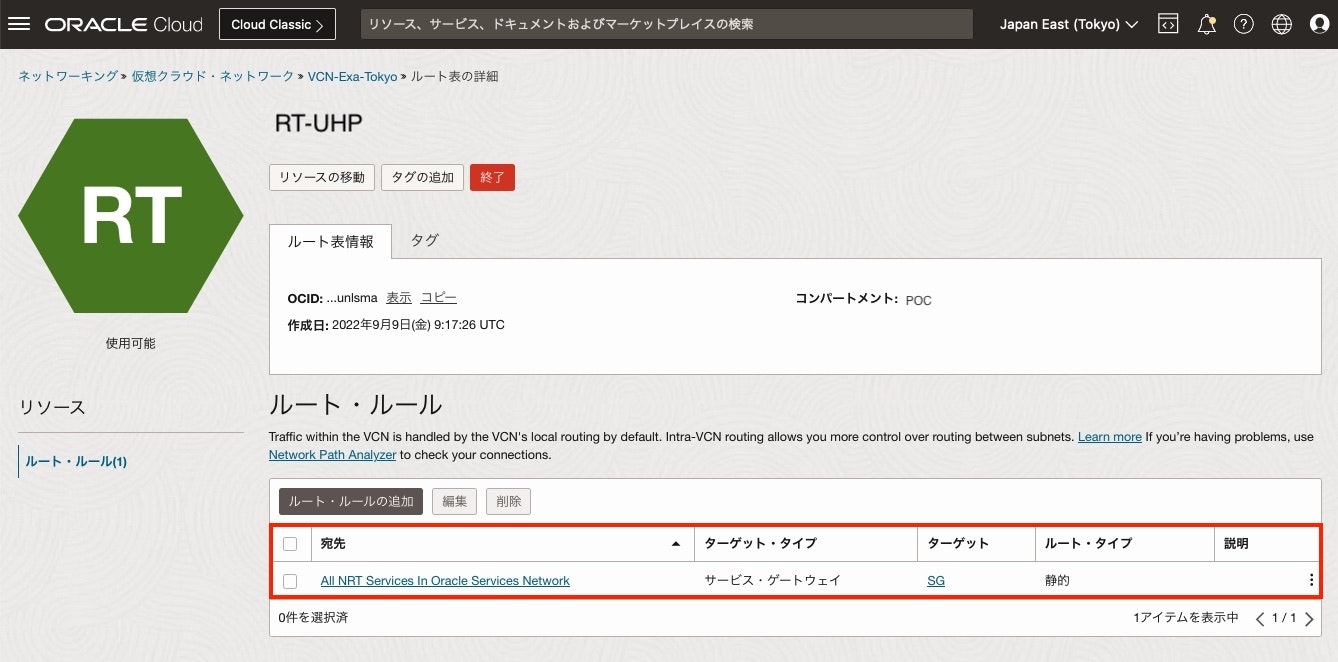
■ サービス・ゲートウェイ設定
コンピュート・インスタンスがOracleサービス (OCN) にアクセスできるよう
サービス・ゲートウェイを作成して、インスタンス配置するサブネットの ルート・ルールへ「 All Oracle Services Network Service」を設定します。
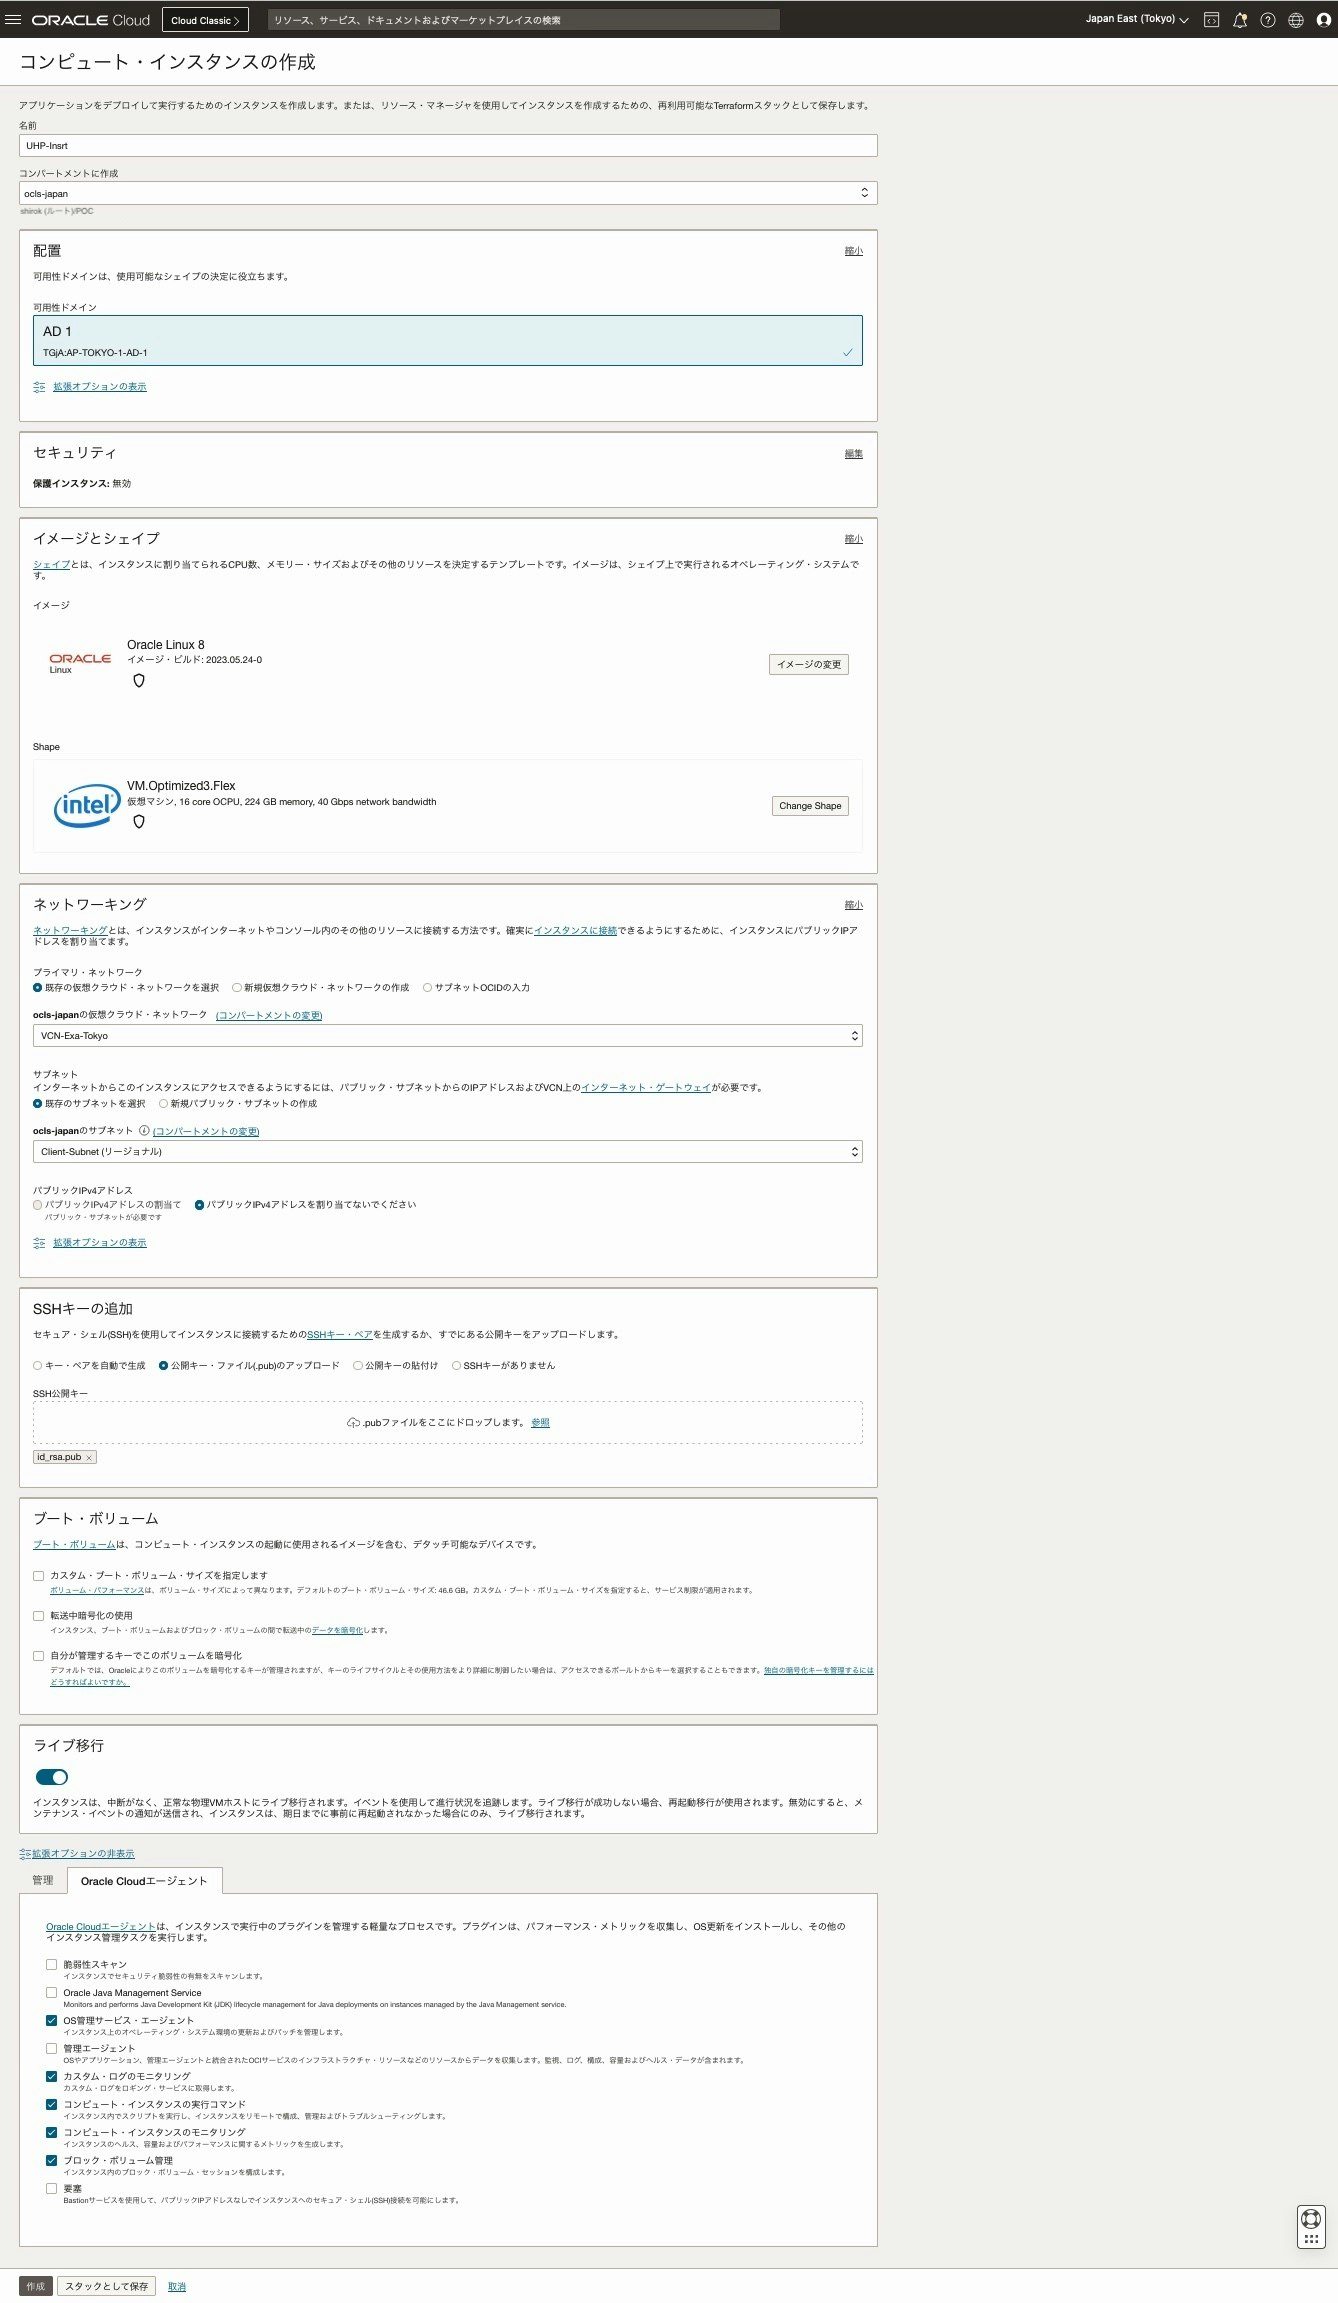
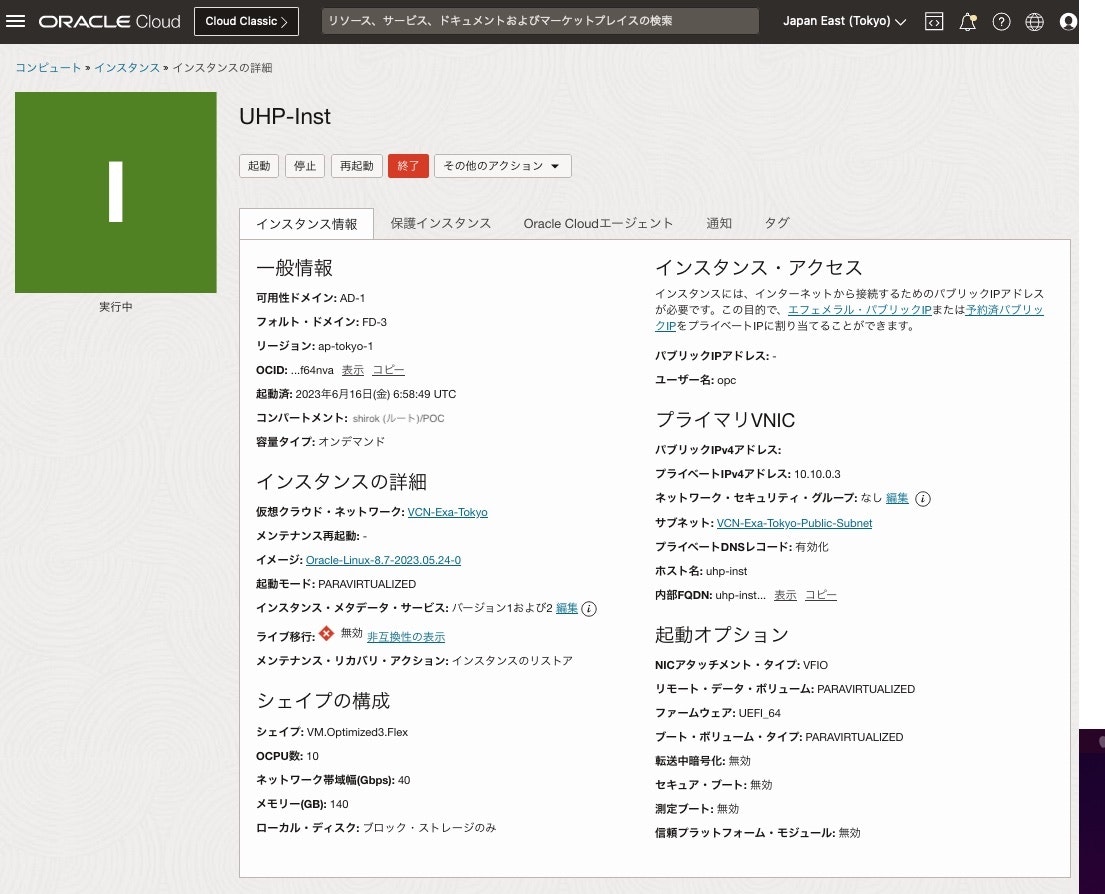
■ インスタンス作成
1) インスタンス作成
マルチパス有効化するために 以下項目を設定して作成
・サポートされているシェイプ: Oracle Linux 8
・サポートされてるイメージ: 16 OCPU の VM.Optimized3.Flex
・インスタンスのブロック・ボリューム管理プラグイン: 有効化
2) 作成完了
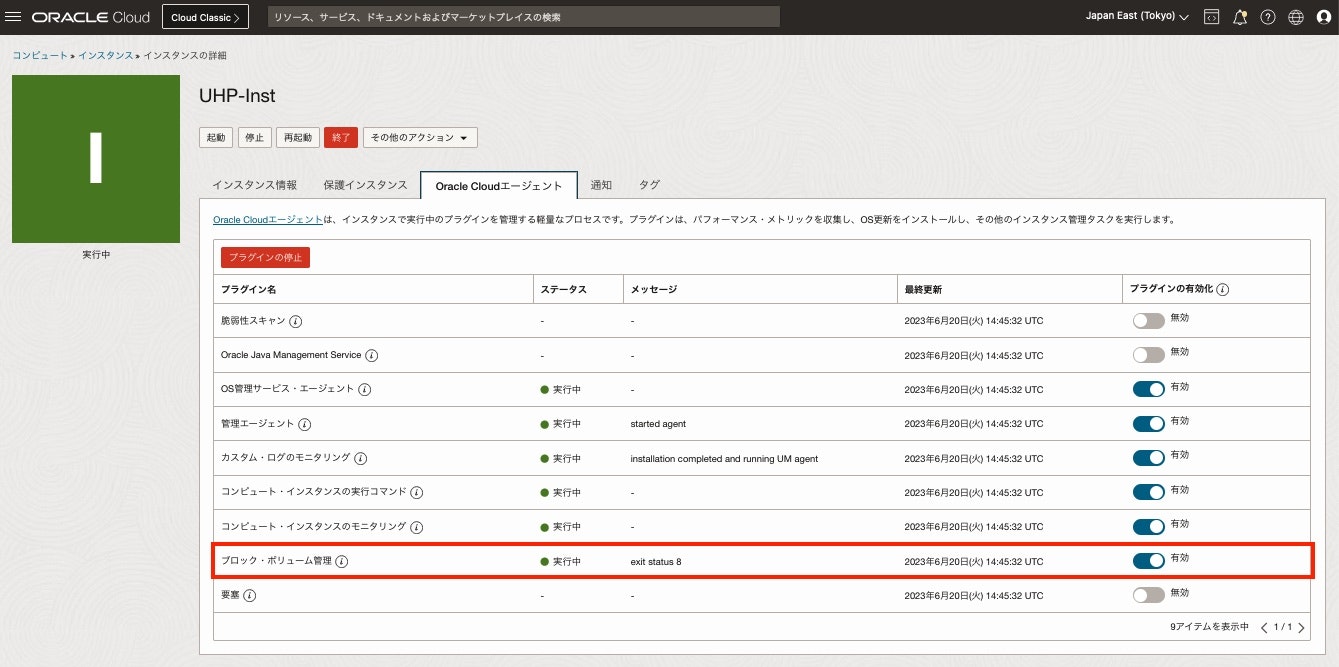
3) インスタンスのブロック・ボリューム管理プラグイン 有効化確認
作成したインスタンス画面にある[Oracle Cloudエージェント]タブをクリックして、ブロック・ボリューム管理のステータスが "実行中" であることを確認
■ UHP ブロック・ボリューム作成
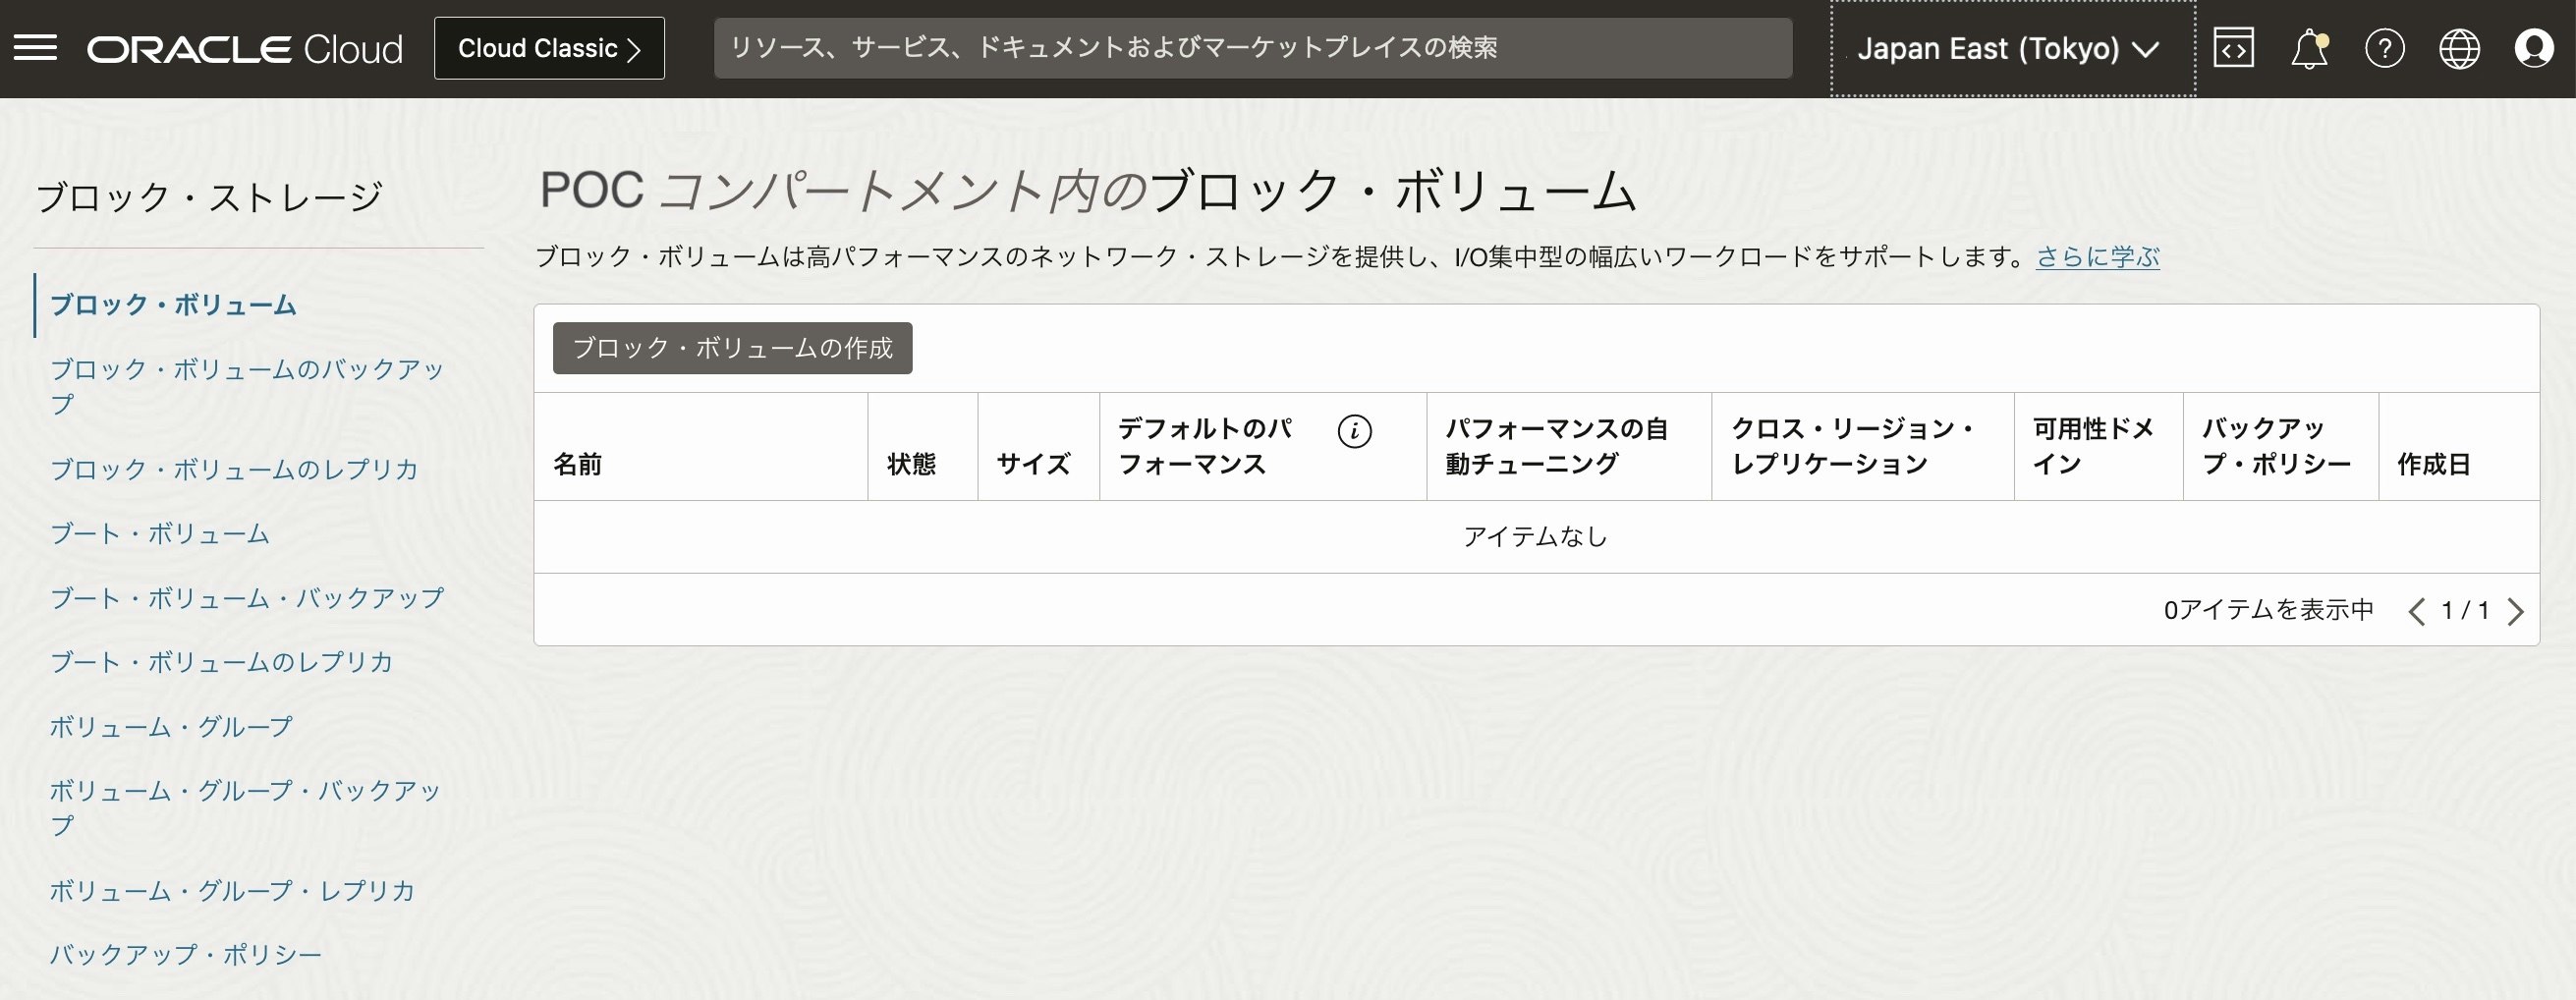
1) ブロック・ボリューム画面
ブロック・ボリュームの作成をクリック
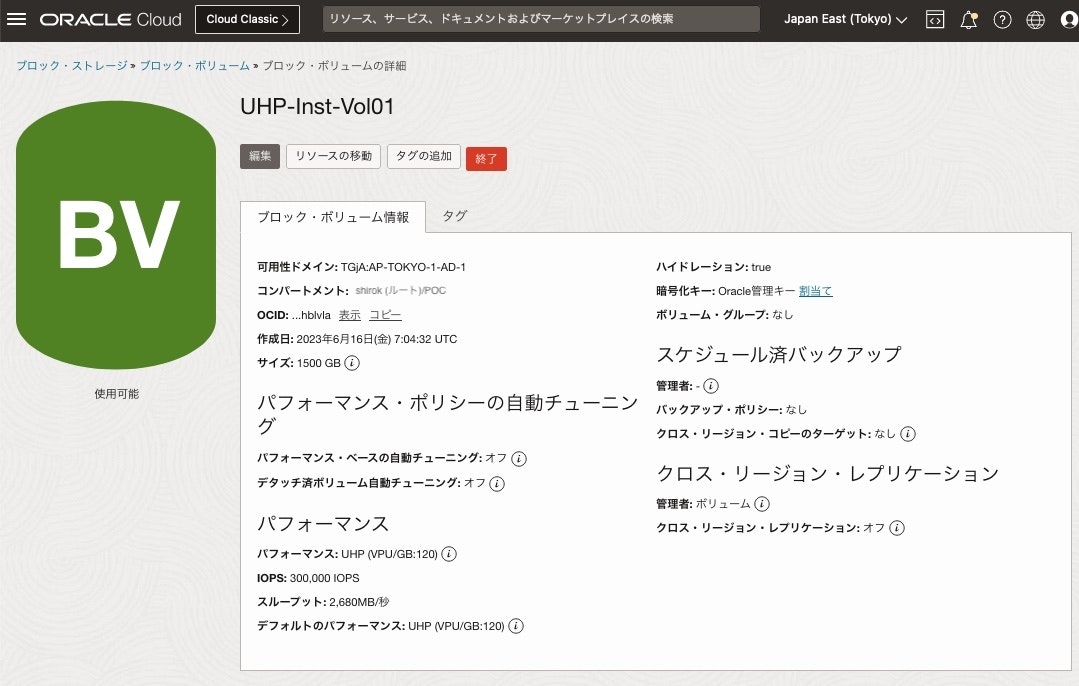
2) ブロック・ボリュームの作成画面
UHPのボリューム当たりの最大IOPS が出るように次を設定し、[ブロック・ボリュームの作成]をクリック
・ボリューム・サイズ(GB): 1333 以上を設定
・VPU/GB: 120 を設定
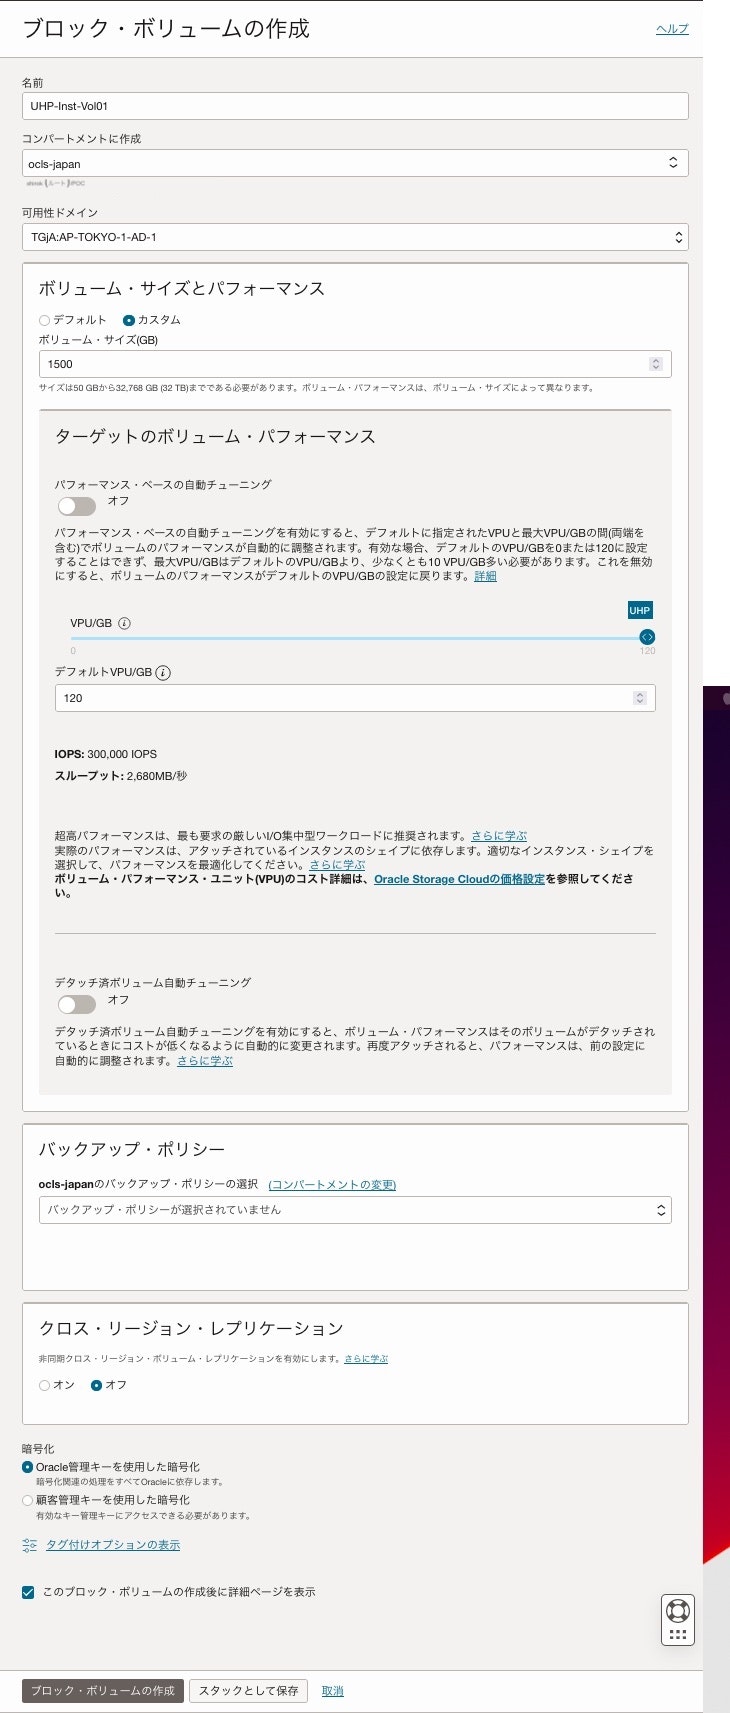
2) ブロック・ボリュームの作成確認
■ ブロック・ボリュームのアタッチ
⚫︎ インスタンスへブロック・ボリュームをアタッチ
1) インスタンス画面
リソース欄にある[アタッチされたブロック・ボリューム]をクリックし、[ブロック・ボリューム]のアタッチをクリック
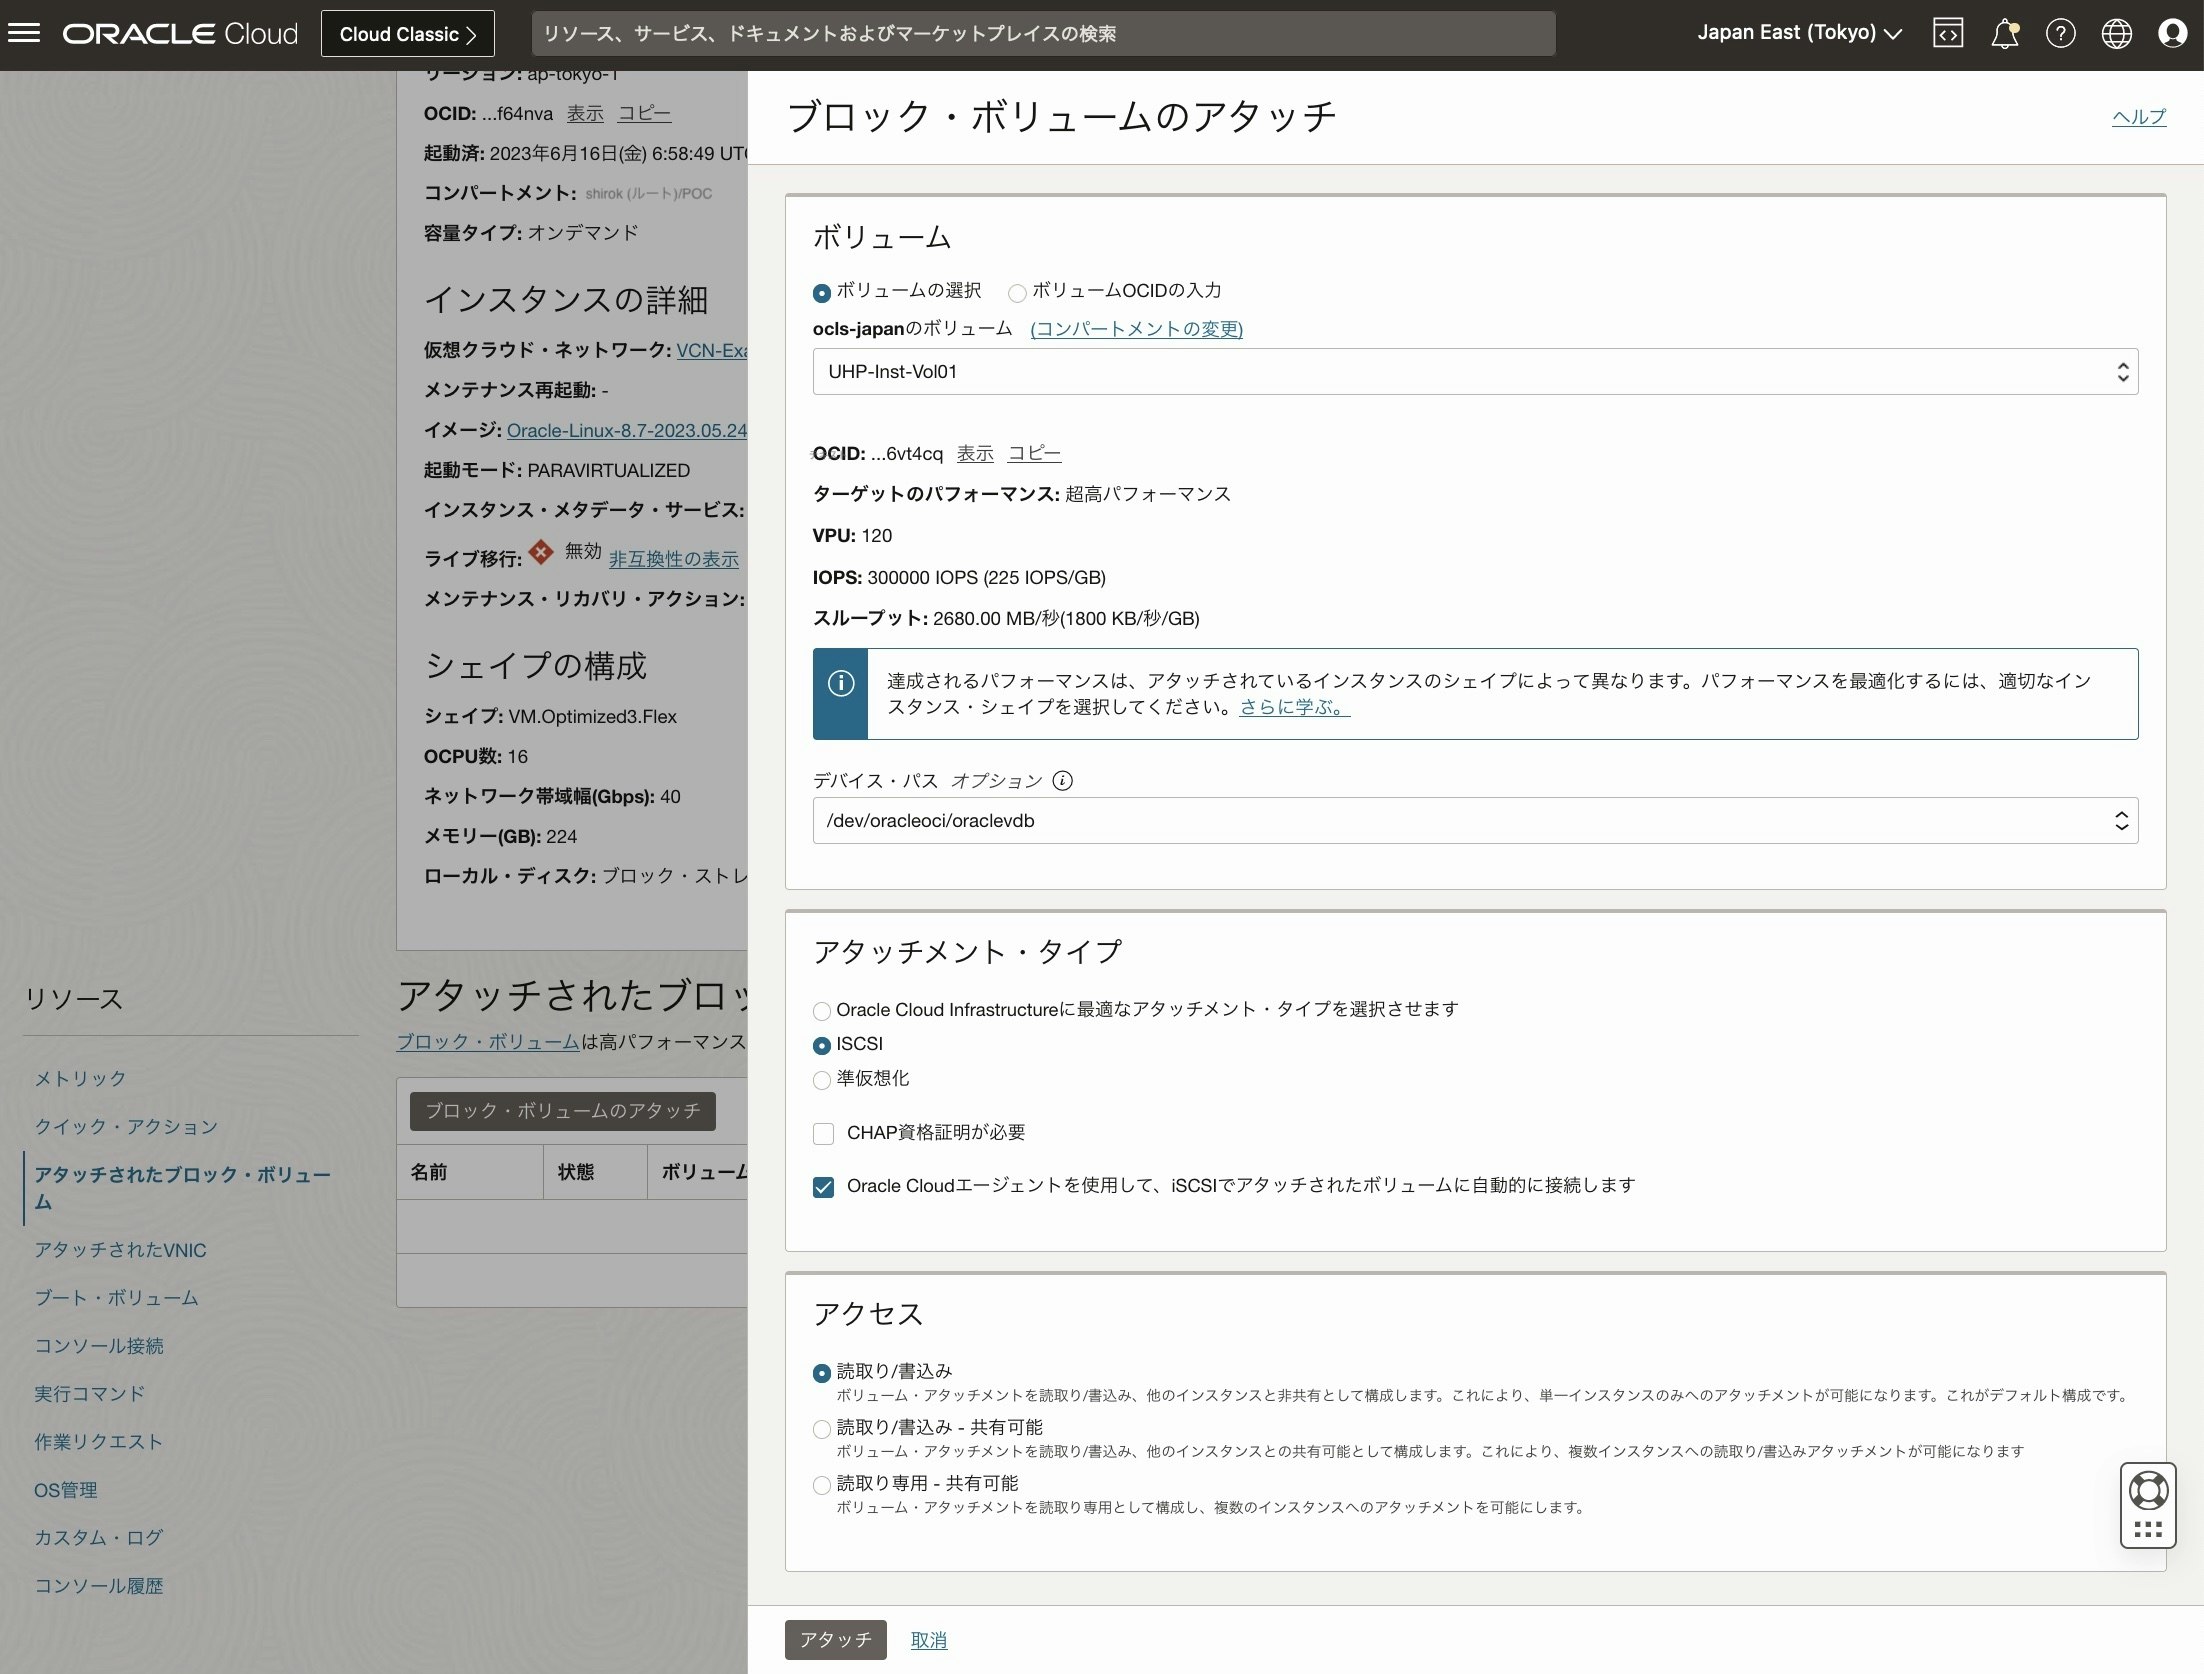
2) ブロック・ボリュームのアタッチ画面
マルチパス対応のiSCSIボリュームアタッチメントを構成するように次の項目を設定し、[アタッチ]をクリック
・ ボリューム: アタッチするボリュームを選択
・ デバイス・パス: マルチパス条件で必要なため、任意のパスを選択
・ アタッチメント・タイプ: ここでは iSCSIを選択
・ Oracle Cloudエージェントを使用して、iSCSIでアタッチされたボリュームに自動的に接続します: チェック
・ アクセス: 任意の項目を選択
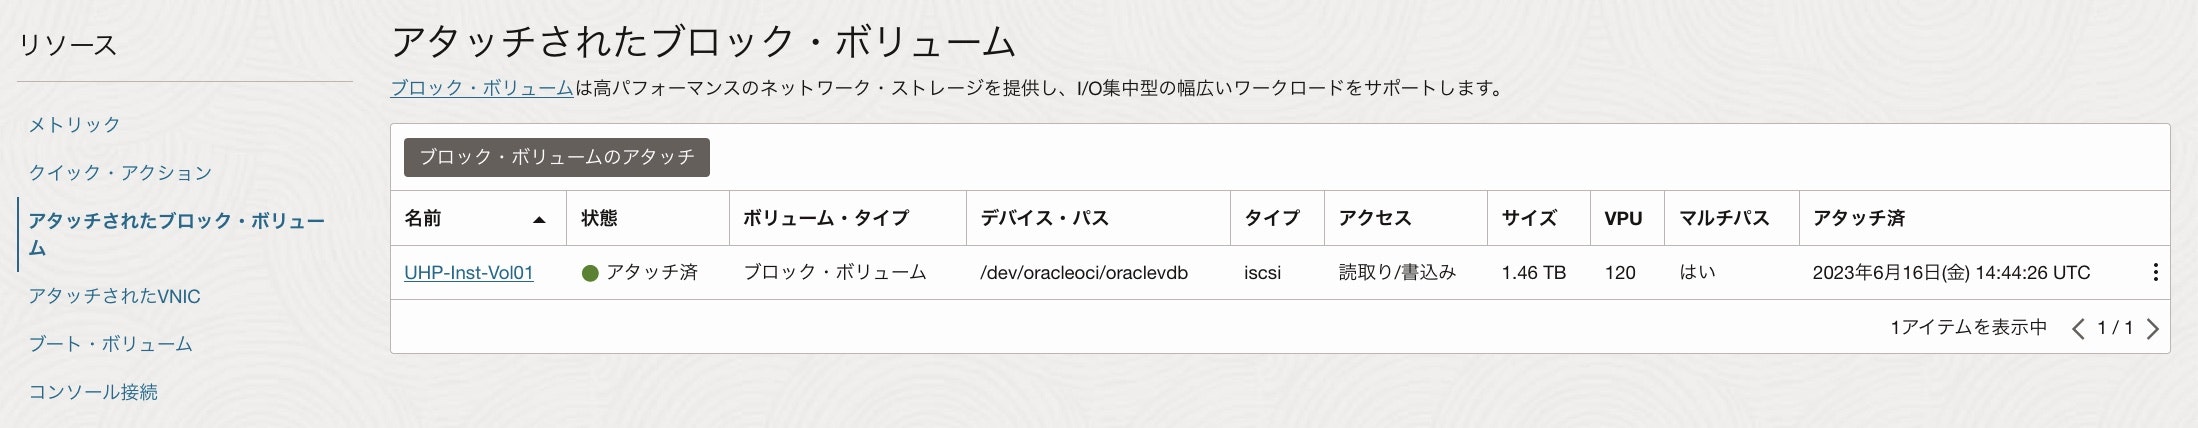
3) アタッチ確認
アタッチしたインスタンスのコンピュート画面にある[アタッチされたブロック・ボリューム]をクリックし、アタッチしたブロック・ボリュームのマルチパスの項目が ”はい” であることを確認。'いいえ'の場合は、ボリューム・アタッチメントがマルチパス対応かどうかのチェックを確認してトラブルシュートします。
4) OSコマンドで物理ボリューム確認
物理ボリュームの情報を表示して追加した /dev/oracleoci/oraclevdb があることを確認
・ 物理ボリュームの情報
[root@uhp-inst ~]# pvs -a
  PV                       VG        Fmt  Attr PSize  PFree
  /dev/oracleoci/oraclevdb                ---      0     0
  /dev/sda1                               ---      0     0
  /dev/sda2                               ---      0     0
  /dev/sda3                ocivolume lvm2 a--  45.47g    0
・ 各物理ボリュームの詳細
[root@uhp-inst ~]# pvdisplay
  --- Physical volume ---
  PV Name               /dev/sda3
  VG Name               ocivolume
  PV Size               <45.48 GiB / not usable 4.00 MiB
  Allocatable           yes (but full)
  PE Size               4.00 MiB
  Total PE              11641
  Free PE               0
  Allocated PE          11641
  PV UUID               hEVNRk-tDES-K596-8pgT-sHjd-PonS-NmRcVJ

  --- Physical volume ---
  PV Name               /dev/oracleoci/oraclevdb
  VG Name               vg1
  PV Size               1.46 TiB / not usable 4.00 MiB
  Allocatable           yes
  PE Size               4.00 MiB
  Total PE              383999
  Free PE               383999
  Allocated PE          0
  PV UUID               Hc8bEB-XQha-5gdb-G64c-9O0H-jkOc-LuAgV1
・ LVM ブロックデバイスをすべてスキャン
[root@uhp-inst ~]# pvscan
  PV /dev/sda3                  VG ocivolume       lvm2 [45.47 GiB / 0    free]
  PV /dev/oracleoci/oraclevdb   VG vg1             lvm2 [1.46 TiB / 1.46 TiB free]
  Total: 2 [<1.51 TiB] / in use: 2 [<1.51 TiB] / in no VG: 0 [0   ]
・ 物理ボリュームに使用できるブロックデバイスを一覧表示
[root@uhp-inst ~]# lvmdiskscan
  /dev/sda1                [     100.00 MiB]
  /dev/sda2                [       1.00 GiB]
  /dev/sda3                [     <45.48 GiB] LVM physical volume
  /dev/oracleoci/oraclevdb [       1.46 TiB]
  1 disk
  2 partitions
  0 LVM physical volume whole disks
  1 LVM physical volume
・ ブロックデバイス確認
[root@uhp-inst ~]# lsblk
    NAME               MAJ:MIN RM  SIZE RO TYPE  MOUNTPOINT
	sda                  8:0    0 46.6G  0 disk
	|-sda1               8:1    0  100M  0 part  /boot/efi
	|-sda2               8:2    0    1G  0 part  /boot
	`-sda3               8:3    0 45.5G  0 part
	  |-ocivolume-root 252:0    0 35.5G  0 lvm   /
	  `-ocivolume-oled 252:1    0   10G  0 lvm   /var/oled
	sdb                  8:16   0  1.5T  0 disk
	`-mpatha           252:2    0  1.5T  0 mpath
	sdc                  8:32   0  1.5T  0 disk
	`-mpatha           252:2    0  1.5T  0 mpath
	sdd                  8:48   0  1.5T  0 disk
	`-mpatha           252:2    0  1.5T  0 mpath
	sde                  8:64   0  1.5T  0 disk
	`-mpatha           252:2    0  1.5T  0 mpath
	sdf                  8:80   0  1.5T  0 disk
	`-mpatha           252:2    0  1.5T  0 mpath
	sdg                  8:96   0  1.5T  0 disk
	`-mpatha           252:2    0  1.5T  0 mpath
	sdh                  8:112  0  1.5T  0 disk
	`-mpatha           252:2    0  1.5T  0 mpath
	sdi                  8:128  0  1.5T  0 disk
	`-mpatha           252:2    0  1.5T  0 mpath
	sdj                  8:144  0  1.5T  0 disk
	`-mpatha           252:2    0  1.5T  0 mpath
	sdk                  8:160  0  1.5T  0 disk
	`-mpatha           252:2    0  1.5T  0 mpath
⚫︎ マルチパスの構成確認
・ マルチパスのステータス確認
[root@uhp-inst ~]# mpathconf
    multipath is enabled
    find_multipaths is yes
    user_friendly_names is enabled
    default property blacklist is disabled
    enable_foreign is not set (all foreign multipath devices will be shown)
    dm_multipath module is loaded
    multipathd is running
・ マルチパス構成表示
[root@uhp-inst ~]# sudo multipath -ll
	Aug 08 05:04:40 | /etc/multipath.conf line 15, value for fast_io_fail_tmo too small, capping at 1
	mpatha (3606e401d16b84ea7a15f336e057b986f) dm-2 ORACLE,BlockVolume
	size=1.5T features='4 queue_if_no_path retain_attached_hw_handler queue_mode bio' hwhandler='0' wp=rw
	`-+- policy='queue-length 0' prio=1 status=active
	  |- 3:0:0:2  sdb 8:16  active ready running
	  |- 4:0:0:2  sdc 8:32  active ready running
	  |- 5:0:0:2  sdd 8:48  active ready running
	  |- 6:0:0:2  sde 8:64  active ready running
	  |- 7:0:0:2  sdf 8:80  active ready running
	  |- 8:0:0:2  sdg 8:96  active ready running
	  |- 9:0:0:2  sdh 8:112 active ready running
	  |- 10:0:0:2 sdi 8:128 active ready running
	  |- 11:0:0:2 sdj 8:144 active ready running
	  `- 12:0:0:2 sdk 8:160 active ready running
・ マルチパス構成ファイル確認
[root@uhp-inst ~]# cat /etc/multipath.conf
defaults {
  user_friendly_names yes
  find_multipaths yes
  rr_weight uniform
  path_selector "queue-length 0"
  path_grouping_policy multibus
  polling_interval 30
  path_checker tur
  checker_timeout 300
  failback immediate
  verbosity 2
  rr_min_io 1
  rr_min_io_rq 1
  dev_loss_tmo 9000
  fast_io_fail_tmo -1
  no_path_retry queue
  skip_kpartx no
  features "2 queue_mode bio"
}
[root@uhp-inst ~]# cat /usr/share/doc/device-mapper-multipath/multipath.conf
    # This is a basic configuration file with some examples, for device mapper
	# multipath.
	#
	# For a complete list of the default configuration values, run either
	# multipath -t
	# or
	# multipathd show config
	#
	# For a list of configuration options with descriptions, see the multipath.conf
	# man page

	## By default, devices with vendor = "IBM" and product = "S/390.*" are
	## blacklisted. To enable mulitpathing on these devies, uncomment the
	## following lines.
	#blacklist_exceptions {
	#	device {
	#		vendor	"IBM"
	#		product	"S/390.*"
	#	}
	#}

	## Use user friendly names, instead of using WWIDs as names.
	defaults {
		user_friendly_names yes
		find_multipaths yes
	}
	##
	## Here is an example of how to configure some standard options.
	##
	#
	#defaults {
	#	udev_dir		/dev
	#	polling_interval 	10
	#	selector		"round-robin 0"
	#	path_grouping_policy	multibus
	#	prio			alua
	#	path_checker		readsector0
	#	rr_min_io		100
	#	max_fds			8192
	#	rr_weight		priorities
	#	failback		immediate
	#	no_path_retry		fail
	#	user_friendly_names	yes
	#}
	##
	## The wwid line in the following blacklist section is shown as an example
	## of how to blacklist devices by wwid.  The 2 devnode lines are the
	## compiled in default blacklist. If you want to blacklist entire types
	## of devices, such as all scsi devices, you should use a devnode line.
	## However, if you want to blacklist specific devices, you should use
	## a wwid line.  Since there is no guarantee that a specific device will
	## not change names on reboot (from /dev/sda to /dev/sdb for example)
	## devnode lines are not recommended for blacklisting specific devices.
	##
	#blacklist {
	#       wwid 26353900f02796769
	#	devnode "^(ram|raw|loop|fd|md|dm-|sr|scd|st)[0-9]*"
	#	devnode "^hd[a-z]"
	#}
	#multipaths {
	#	multipath {
	#		wwid			3600508b4000156d700012000000b0000
	#		alias			yellow
	#		path_grouping_policy	multibus
	#		path_checker		readsector0
	#		path_selector		"round-robin 0"
	#		failback		manual
	#		rr_weight		priorities
	#		no_path_retry		5
	#	}
	#	multipath {
	#		wwid			1DEC_____321816758474
	#		alias			red
	#	}
	#}
	#devices {
	#	device {
	#		vendor			"COMPAQ  "
	#		product			"HSV110 (C)COMPAQ"
	#		path_grouping_policy	multibus
	#		path_checker		readsector0
	#		path_selector		"round-robin 0"
	#		hardware_handler	"0"
	#		failback		15
	#		rr_weight		priorities
	#		no_path_retry		queue
	#	}
	#	device {
	#		vendor			"COMPAQ  "
	#		product			"MSA1000         "
	#		path_grouping_policy	multibus
	#	}
	#}
■ FIOのインストール
1) install fio
Oracle LinuxまたはCentOSシステムにFIOをインストールして構成するには、次のコマンドを実行します
[root@uhp-inst ~]# dnf install fio -y
This system is receiving updates from OSMS server.
Last metadata expiration check: 1:52:21 ago on Mon 19 Jun 2023 06:00:03 AM GMT.
Dependencies resolved.
================================================================================================================================================
Package Architecture Version Repository Size
================================================================================================================================================
Installing:
fio x86_64 3.19-4.el8 ol8_appstream-x86_64 538 k
Installing dependencies:
boost-iostreams x86_64 1.66.0-13.el8 ol8_appstream-x86_64 42 k
boost-program-options x86_64 1.66.0-13.el8 ol8_appstream-x86_64 141 k
boost-random x86_64 1.66.0-13.el8 ol8_appstream-x86_64 22 k
daxctl-libs x86_64 71.1-4.el8 ol8_baseos_latest-x86_64 42 k
libpmem x86_64 1.6.1-1.el8 ol8_appstream-x86_64 79 k
libpmemblk x86_64 1.6.1-1.el8 ol8_appstream-x86_64 92 k
librados2 x86_64 1:12.2.7-9.0.1.el8 ol8_appstream-x86_64 2.9 M
librbd1 x86_64 1:12.2.7-9.0.1.el8 ol8_appstream-x86_64 1.1 M
librdmacm x86_64 41.0-1.el8 ol8_baseos_latest-x86_64 78 k
ndctl-libs x86_64 71.1-4.el8 ol8_baseos_latest-x86_64 80 k
Transaction Summary
================================================================================================================================================
Install 11 Packages
Total download size: 5.0 M
Installed size: 17 M
Downloading Packages:
(1/11): ndctl-libs-71.1-4.el8.x86_64.rpm 836 kB/s | 80 kB 00:00
(2/11): libpmem-1.6.1-1.el8.x86_64.rpm 16 MB/s | 79 kB 00:00
(3/11): librdmacm-41.0-1.el8.x86_64.rpm 760 kB/s | 78 kB 00:00
(4/11): libpmemblk-1.6.1-1.el8.x86_64.rpm 22 MB/s | 92 kB 00:00
(5/11): librbd1-12.2.7-9.0.1.el8.x86_64.rpm 50 MB/s | 1.1 MB 00:00
(6/11): daxctl-libs-71.1-4.el8.x86_64.rpm 323 kB/s | 42 kB 00:00
(7/11): boost-iostreams-1.66.0-13.el8.x86_64.rpm 11 MB/s | 42 kB 00:00
(8/11): boost-random-1.66.0-13.el8.x86_64.rpm 11 MB/s | 22 kB 00:00
(9/11): fio-3.19-4.el8.x86_64.rpm 63 MB/s | 538 kB 00:00
(10/11): librados2-12.2.7-9.0.1.el8.x86_64.rpm 56 MB/s | 2.9 MB 00:00
(11/11): boost-program-options-1.66.0-13.el8.x86_64.rpm 495 kB/s | 141 kB 00:00
------------------------------------------------------------------------------------------------------------------------------------------------
Total 12 MB/s | 5.0 MB 00:00
Running transaction check
Transaction check succeeded.
Running transaction test
Transaction test succeeded.
Running transaction
Preparing : 1/1
Installing : boost-random-1.66.0-13.el8.x86_64 1/11
Running scriptlet: boost-random-1.66.0-13.el8.x86_64 1/11
Installing : boost-program-options-1.66.0-13.el8.x86_64 2/11
Running scriptlet: boost-program-options-1.66.0-13.el8.x86_64 2/11
Installing : boost-iostreams-1.66.0-13.el8.x86_64 3/11
Running scriptlet: boost-iostreams-1.66.0-13.el8.x86_64 3/11
Installing : librados2-1:12.2.7-9.0.1.el8.x86_64 4/11
Running scriptlet: librados2-1:12.2.7-9.0.1.el8.x86_64 4/11
Installing : libpmem-1.6.1-1.el8.x86_64 5/11
Running scriptlet: libpmem-1.6.1-1.el8.x86_64 5/11
Installing : daxctl-libs-71.1-4.el8.x86_64 6/11
Running scriptlet: daxctl-libs-71.1-4.el8.x86_64 6/11
Installing : ndctl-libs-71.1-4.el8.x86_64 7/11
Running scriptlet: ndctl-libs-71.1-4.el8.x86_64 7/11
Installing : libpmemblk-1.6.1-1.el8.x86_64 8/11
Running scriptlet: libpmemblk-1.6.1-1.el8.x86_64 8/11
Installing : librbd1-1:12.2.7-9.0.1.el8.x86_64 9/11
Running scriptlet: librbd1-1:12.2.7-9.0.1.el8.x86_64 9/11
Installing : librdmacm-41.0-1.el8.x86_64 10/11
Running scriptlet: librdmacm-41.0-1.el8.x86_64 10/11
Installing : fio-3.19-4.el8.x86_64 11/11
Running scriptlet: fio-3.19-4.el8.x86_64 11/11
Verifying : daxctl-libs-71.1-4.el8.x86_64 1/11
Verifying : librdmacm-41.0-1.el8.x86_64 2/11
Verifying : ndctl-libs-71.1-4.el8.x86_64 3/11
Verifying : libpmem-1.6.1-1.el8.x86_64 4/11
Verifying : libpmemblk-1.6.1-1.el8.x86_64 5/11
Verifying : librados2-1:12.2.7-9.0.1.el8.x86_64 6/11
Verifying : librbd1-1:12.2.7-9.0.1.el8.x86_64 7/11
Verifying : boost-iostreams-1.66.0-13.el8.x86_64 8/11
Verifying : boost-program-options-1.66.0-13.el8.x86_64 9/11
Verifying : boost-random-1.66.0-13.el8.x86_64 10/11
Verifying : fio-3.19-4.el8.x86_64 11/11
Installed:
boost-iostreams-1.66.0-13.el8.x86_64 boost-program-options-1.66.0-13.el8.x86_64 boost-random-1.66.0-13.el8.x86_64
daxctl-libs-71.1-4.el8.x86_64 fio-3.19-4.el8.x86_64 libpmem-1.6.1-1.el8.x86_64
libpmemblk-1.6.1-1.el8.x86_64 librados2-1:12.2.7-9.0.1.el8.x86_64 librbd1-1:12.2.7-9.0.1.el8.x86_64
librdmacm-41.0-1.el8.x86_64 ndctl-libs-71.1-4.el8.x86_64
Complete!
■ 計測:FIOコマンド
● IOPSパフォーマンス・テスト
IOPSパフォーマンスをテストするには、次のFIOサンプル・コマンドを使用します。
・ 順次読取りのテスト
データベース・ワークロードなど、順次アクセス・パターンを利用できるワークロードに対しては、順次読取りをテストすることにより、このパターンのパフォーマンスを確認できます。
fio --filename=/dev/oracleoci/oraclevdb --direct=1 --rw=read --bs=4k --ioengine=libaio --iodepth=256 --runtime=120 --numjobs=4 --time_based --group_reporting --name=iops-test-job --eta-newline=1 --readonly
1) 実行
[root@uhp-inst ~]# sudo fio --filename=/dev/oracleoci/oraclevdb --direct=1 --rw=read --bs=4k --ioengine=libaio --iodepth=256 --runtime=120 --numjobs=4 --time_based --group_reporting --name=iops-test-job --eta-newline=1 --readonly
iops-test-job: (g=0): rw=read, bs=(R) 4096B-4096B, (W) 4096B-4096B, (T) 4096B-4096B, ioengine=libaio, iodepth=256
...
fio-3.19
Starting 4 processes
Jobs: 4 (f=4): [R(4)][2.5%][r=2202MiB/s][r=564k IOPS][eta 01m:58s]
Jobs: 4 (f=4): [R(4)][3.3%][r=1173MiB/s][r=300k IOPS][eta 01m:57s]
Jobs: 4 (f=4): [R(4)][4.1%][r=1172MiB/s][r=300k IOPS][eta 01m:56s]
・・・
Jobs: 4 (f=4): [R(4)][99.2%][r=1172MiB/s][r=300k IOPS][eta 00m:01s]
Jobs: 4 (f=4): [R(4)][100.0%][r=1172MiB/s][r=300k IOPS][eta 00m:00s]
Jobs: 4 (f=0): [f(4)][100.0%][r=1140MiB/s][r=292k IOPS][eta 00m:00s]
iops-test-job: (groupid=0, jobs=4): err= 0: pid=10602: Fri Jun 16 15:21:45 2023
  read: IOPS=305k, BW=1191MiB/s (1249MB/s)(140GiB/120024msec)
    slat (nsec): min=1439, max=1805.1k, avg=4589.40, stdev=2863.25
    clat (usec): min=95, max=354659, avg=3352.81, stdev=6727.57
     lat (usec): min=181, max=354662, avg=3357.51, stdev=6727.55
    clat percentiles (usec):
     |  1.00th=[   265],  5.00th=[   314], 10.00th=[   355], 20.00th=[   412],
     | 30.00th=[   465], 40.00th=[   523], 50.00th=[   594], 60.00th=[   701],
     | 70.00th=[  1020], 80.00th=[  4293], 90.00th=[ 12649], 95.00th=[ 21365],
     | 99.00th=[ 24773], 99.50th=[ 25035], 99.90th=[ 25560], 99.95th=[ 39060],
     | 99.99th=[149947]
   bw (  MiB/s): min=  424, max= 2771, per=99.99%, avg=1191.09, stdev=44.92, samples=956
   iops        : min=108728, max=709497, avg=304919.50, stdev=11500.60, samples=956
  lat (usec)   : 100=0.01%, 250=0.55%, 500=35.65%, 750=26.51%, 1000=7.02%
  lat (msec)   : 2=6.24%, 4=3.45%, 10=7.75%, 20=7.64%, 50=5.17%
  lat (msec)   : 100=0.01%, 250=0.02%, 500=0.01%
  cpu          : usr=8.53%, sys=46.80%, ctx=8094914, majf=0, minf=1084
  IO depths    : 1=0.1%, 2=0.1%, 4=0.1%, 8=0.1%, 16=0.1%, 32=0.1%, >=64=100.0%
     submit    : 0=0.0%, 4=100.0%, 8=0.0%, 16=0.0%, 32=0.0%, 64=0.0%, >=64=0.0%
     complete  : 0=0.0%, 4=100.0%, 8=0.0%, 16=0.0%, 32=0.0%, 64=0.0%, >=64=0.1%
     issued rwts: total=36600827,0,0,0 short=0,0,0,0 dropped=0,0,0,0
     latency   : target=0, window=0, percentile=100.00%, depth=256

Run status group 0 (all jobs):
   READ: bw=1191MiB/s (1249MB/s), 1191MiB/s-1191MiB/s (1249MB/s-1249MB/s), io=140GiB (150GB), run=120024-120024msec
2) 実行確認
iops の測定結果は次の行確認します
avg=304919.50 あることが確認できます。
iops : min=108728, max=709497, avg=304919.50, stdev=11500.60, samples=956
● スループット・パフォーマンス・テスト
スループット・パフォーマンスをテストするには、次のFIOサンプル・コマンドを使用します。
・ 順次読取りのテスト
データベース・ワークロードなど、順次アクセス・パターンを利用できるワークロードに対しては、順次読取りをテストすることにより、このパターンのパフォーマンスを確認できます。
sudo fio --filename=/dev/oracleoci/oraclevdb --direct=1 --rw=read --bs=64k --ioengine=libaio --iodepth=64 --runtime=120 --numjobs=4 --time_based --group_reporting --name=throughput-test-job --eta-newline=1 --readonly
1) 実行
[root@uhp-inst ~]# sudo fio --filename=/dev/oracleoci/oraclevdb --direct=1 --rw=read --bs=64k --ioengine=libaio --iodepth=64 --runtime=120 --numjobs=4 --time_based --group_reporting --name=throughput-test-job --eta-newline=1 --readonly
throughput-test-job: (g=0): rw=read, bs=(R) 64.0KiB-64.0KiB, (W) 64.0KiB-64.0KiB, (T) 64.0KiB-64.0KiB, ioengine=libaio, iodepth=64
...
fio-3.19
Starting 4 processes
Jobs: 4 (f=4): [R(4)][2.5%][r=4814MiB/s][r=77.0k IOPS][eta 01m:58s]
Jobs: 4 (f=4): [R(4)][3.3%][r=2618MiB/s][r=41.9k IOPS][eta 01m:57s]
Jobs: 4 (f=4): [R(4)][4.1%][r=2618MiB/s][r=41.9k IOPS][eta 01m:56s]
・・・
Jobs: 4 (f=4): [R(4)][98.3%][r=2618MiB/s][r=41.9k IOPS][eta 00m:02s]Jobs: 4 (f=4): [R(4)][99.2%][r=2618MiB/s][r=41.9k IOPS][eta 00m:01s]
Jobs: 4 (f=4): [R(4)][100.0%][r=2617MiB/s][r=41.9k IOPS][eta 00m:00s]
throughput-test-job: (groupid=0, jobs=4): err= 0: pid=14033: Fri Jun 16 15:28:41 2023
  read: IOPS=42.6k, BW=2660MiB/s (2789MB/s)(312GiB/120008msec)
    slat (usec): min=2, max=398, avg= 8.31, stdev= 3.94
    clat (usec): min=533, max=38592, avg=6006.25, stdev=1486.27
     lat (usec): min=541, max=38597, avg=6014.69, stdev=1486.03
    clat percentiles (usec):
     |  1.00th=[ 2376],  5.00th=[ 3490], 10.00th=[ 3752], 20.00th=[ 4555],
     | 30.00th=[ 5211], 40.00th=[ 5735], 50.00th=[ 6652], 60.00th=[ 6849],
     | 70.00th=[ 7046], 80.00th=[ 7308], 90.00th=[ 7439], 95.00th=[ 7504],
     | 99.00th=[ 7963], 99.50th=[ 9241], 99.90th=[13173], 99.95th=[15664],
     | 99.99th=[21890]
   bw (  MiB/s): min= 2608, max= 5895, per=99.98%, avg=2659.33, stdev=86.47, samples=956
   iops        : min=41732, max=94334, avg=42549.25, stdev=1383.52, samples=956
  lat (usec)   : 750=0.01%, 1000=0.01%
  lat (msec)   : 2=0.37%, 4=11.56%, 10=87.70%, 20=0.35%, 50=0.02%
  cpu          : usr=2.19%, sys=15.66%, ctx=3405974, majf=0, minf=2096
  IO depths    : 1=0.1%, 2=0.1%, 4=0.1%, 8=0.1%, 16=0.1%, 32=0.1%, >=64=100.0%
     submit    : 0=0.0%, 4=100.0%, 8=0.0%, 16=0.0%, 32=0.0%, 64=0.0%, >=64=0.0%
     complete  : 0=0.0%, 4=100.0%, 8=0.0%, 16=0.0%, 32=0.0%, 64=0.1%, >=64=0.0%
     issued rwts: total=5107251,0,0,0 short=0,0,0,0 dropped=0,0,0,0
     latency   : target=0, window=0, percentile=100.00%, depth=64

Run status group 0 (all jobs):
   READ: bw=2660MiB/s (2789MB/s), 2660MiB/s-2660MiB/s (2789MB/s-2789MB/s), io=312GiB (335GB), run=120008-120008msec
2) 実行確認
スループット・パフォーマンス の測定結果は次の行確認します
bw=2660MiB/s (2789MB/s) あることが確認できます。
READ: bw=2660MiB/s (2789MB/s), 2660MiB/s-2660MiB/s (2789MB/s-2789MB/s), io=312GiB (335GB), run=120008-120008msec
■ 超高パフォーマンス・ボリュームで 100万IOPS, 5GB/sスループット出してみる
ボリュームあたり最大 300,000 IOPS および 2,680 MB/秒のスループットを備えた Ultra High Performance Volumes (UHP) ブロック ボリュームを複数ストライプ化すれば、よりパフォーマンスが出ます。
■ 参考
・ブロック・ボリューム・パフォーマンス
・iSCSIでアタッチされたボリュームのVMシェイプ
・超高パフォーマンス・ボリュームのためのアタッチメントの構成
・超高パフォーマンス・ボリューム・アタッチメントのトラブルシューティング
・ボリューム・アタッチメントがマルチパス対応かどうかのチェック
・権限の構成
・一貫性のあるデバイス・パスを使用したボリュームへの接続
・Linuxベース・インスタンスでブロック・ボリューム・パフォーマンス・テストを行うためのサンプルFIOコマンド
・効率的なストレージのためのマルチパスの使用