初めに
数学ガールの秘密ノート「行列が描くもの」
第4章トランスフォームで「リサ」が行う線形変換のデモンストレーションを
Pythonで行ってみました
動作環境
Python3
実装例と結果
以下、本書の記述順に記載しています
点を表示
グラフ上に点(2, 1)に表示
import matplotlib.pyplot as plt
import numpy as np

p21 = np.array([2, 1])
plt.plot(p21[0], p21[1], marker='.')

plt.show()

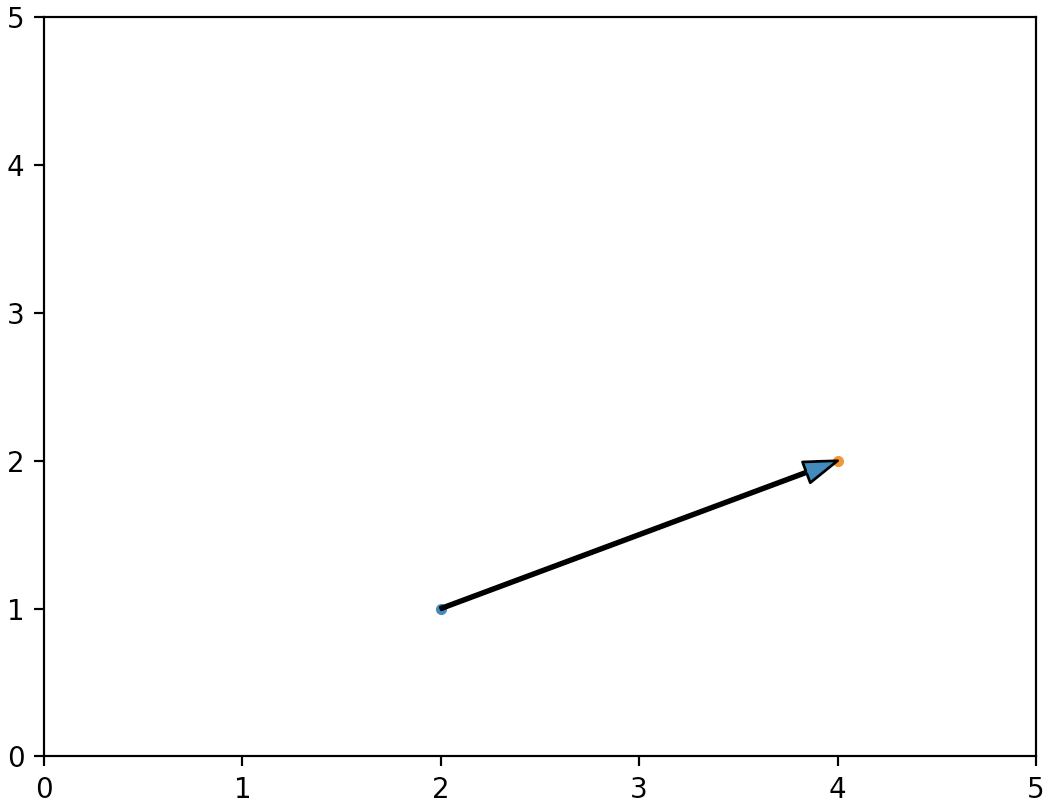
点を移動
点(2, 1)を行列
\begin{pmatrix}
2 & 0 \\
0 & 2
\end{pmatrix}
で線形変換して点(4, 2)に移す
import matplotlib.pyplot as plt
import numpy as np

p21 = np.array([2, 1])
p21to42 = np.array([[2, 0], [0, 2]]) @ p21

fig = plt.figure()
ax = fig.add_subplot(111)
ax.annotate('', xy=p21to42,
                xytext=p21,
                arrowprops=dict(shrink=0, width=1, headwidth=8))
ax.set_xlim([0, 5])
ax.set_ylim([0, 5])

plt.plot(p21[0], p21[1], marker='.')
plt.plot(p21to42[0], p21to42[1], marker='.')

plt.show()
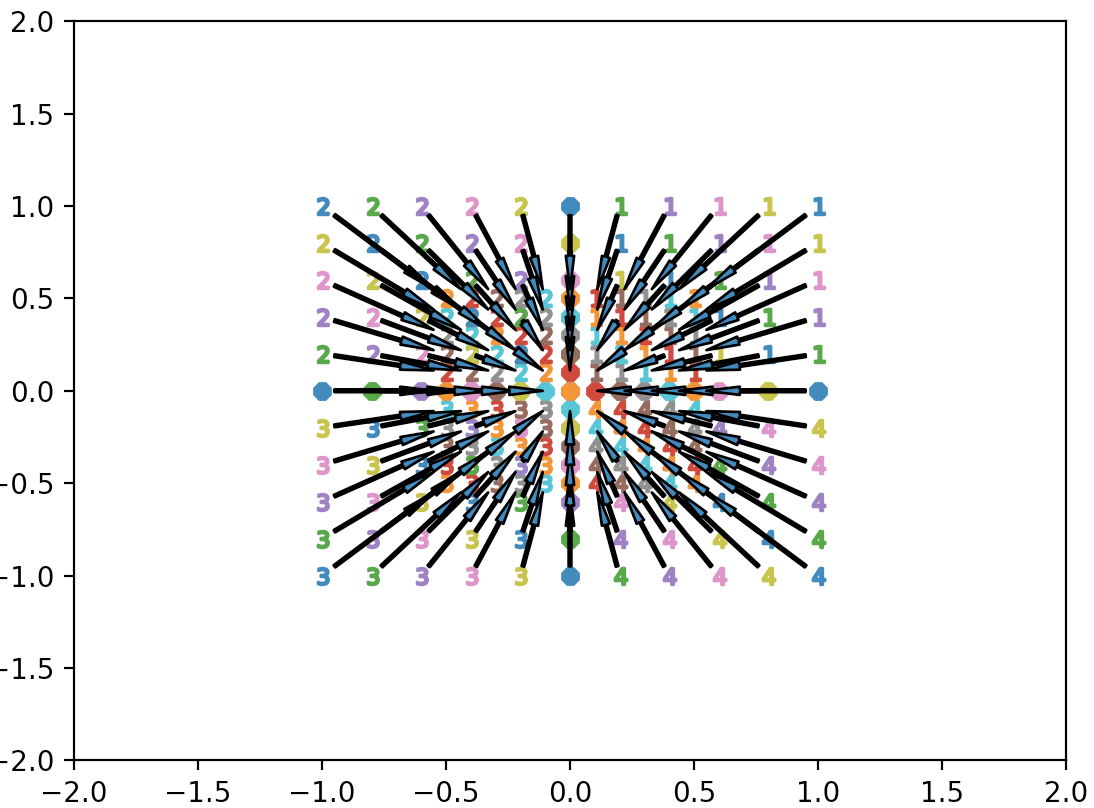
複数の点を移動
複数の点を行列
\begin{pmatrix}
2 & 0 \\
0 & 2
\end{pmatrix}
で線形変換する
import matplotlib.pyplot as plt
import numpy as np

fig = plt.figure()
ax = fig.add_subplot(111)

for x in np.linspace(-1, 1, 11):
    for y in np.linspace(-1, 1, 11):
        marker = '8'
        if x > 0 and y > 0:
            marker = '$1$'
        elif x < 0 and y > 0:
            marker = '$2$'
        elif x < 0 and y < 0:
            marker = '$3$'
        elif x > 0 and y < 0:
            marker = '$4$'

        pOrg = np.array([x, y])
        pTra = np.array([[2, 0], [0, 2]]) @ pOrg

        ax.annotate('', xy=pTra,
                        xytext=pOrg,
                        arrowprops=dict(shrink=0.1, width=1, headwidth=3))

        plt.plot(pOrg[0], pOrg[1], marker = marker)
        plt.plot(pTra[0], pTra[1], marker = marker)

ax.set_xlim([-2, 2])
ax.set_ylim([-2, 2])
plt.show()

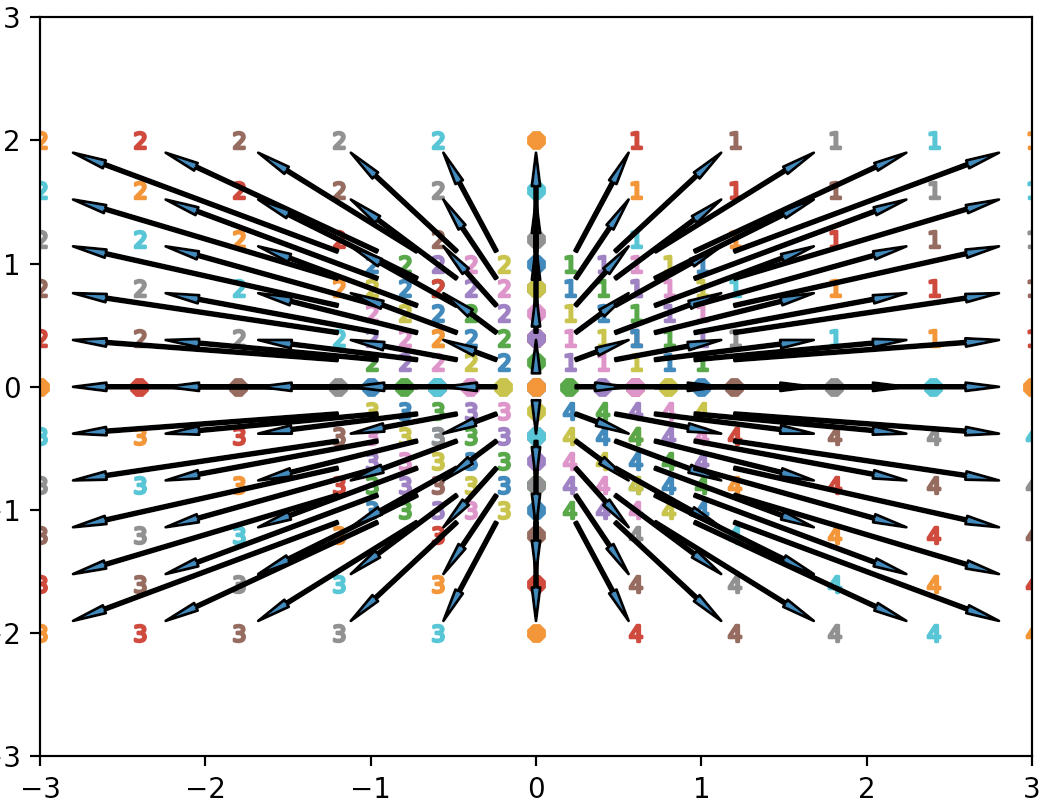
\begin{pmatrix}
1/2 & 0 \\
0 & 1/2
\end{pmatrix}
で線形変換すると
\begin{pmatrix}
3 & 0 \\
0 & 2
\end{pmatrix}
で線形変換すると
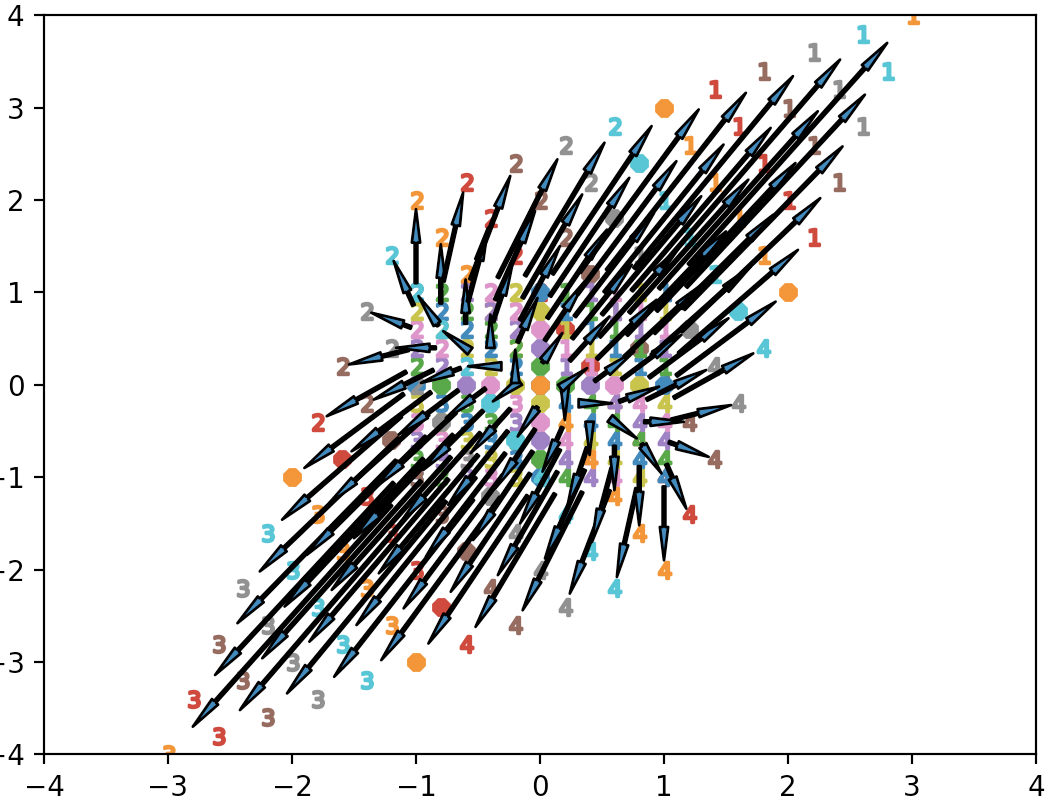
\begin{pmatrix}
2 & 1 \\
1 & 3
\end{pmatrix}
で線形変換すると
線形変換の合成
(0, 0),(1, 0),(1, 1),(0, 1)で囲まれる図形を行列
\begin{pmatrix}
2 & 1 \\
1 & 3
\end{pmatrix}
で変換した後、行列
\begin{pmatrix}
0 & -1 \\
1 & 0
\end{pmatrix}
で変換する
import matplotlib.pyplot as plt
import numpy as np

fig = plt.figure()
ax1 = fig.add_subplot(131)
ax2 = fig.add_subplot(132)
ax3 = fig.add_subplot(133)

original = np.array([[0, 0], [0, 1], [1, 1], [1, 0], [0, 0]])
trans1 = np.array([[0, 0]])
trans2 = np.array([[0, 0]])
for ele in original:
    _ele1 = np.array([[2, 1], [1, 3]]) @ ele
    _ele2 = np.array([[0, -1], [1, 0]]) @ _ele1
    trans1 = np.vstack((trans1, np.array([_ele1])))
    trans2 = np.vstack((trans2, np.array([_ele2])))

ax1.plot(original[:,0], original[:,1], marker = ".", label='original')
ax2.plot(trans1[:,0], trans1[:,1], marker = ".", label='trans1')
ax3.plot(trans2[:,0], trans2[:,1], marker = ".", label='trans2')

ax1.legend(loc = 'upper center')
ax2.legend(loc = 'upper center')
ax3.legend(loc = 'upper center')
ax1.set_xlim([-4, 4])
ax1.set_ylim([-4, 4])
ax2.set_xlim([-4, 4])
ax2.set_ylim([-4, 4])
ax3.set_xlim([-4, 4])
ax3.set_ylim([-4, 4])
plt.show()
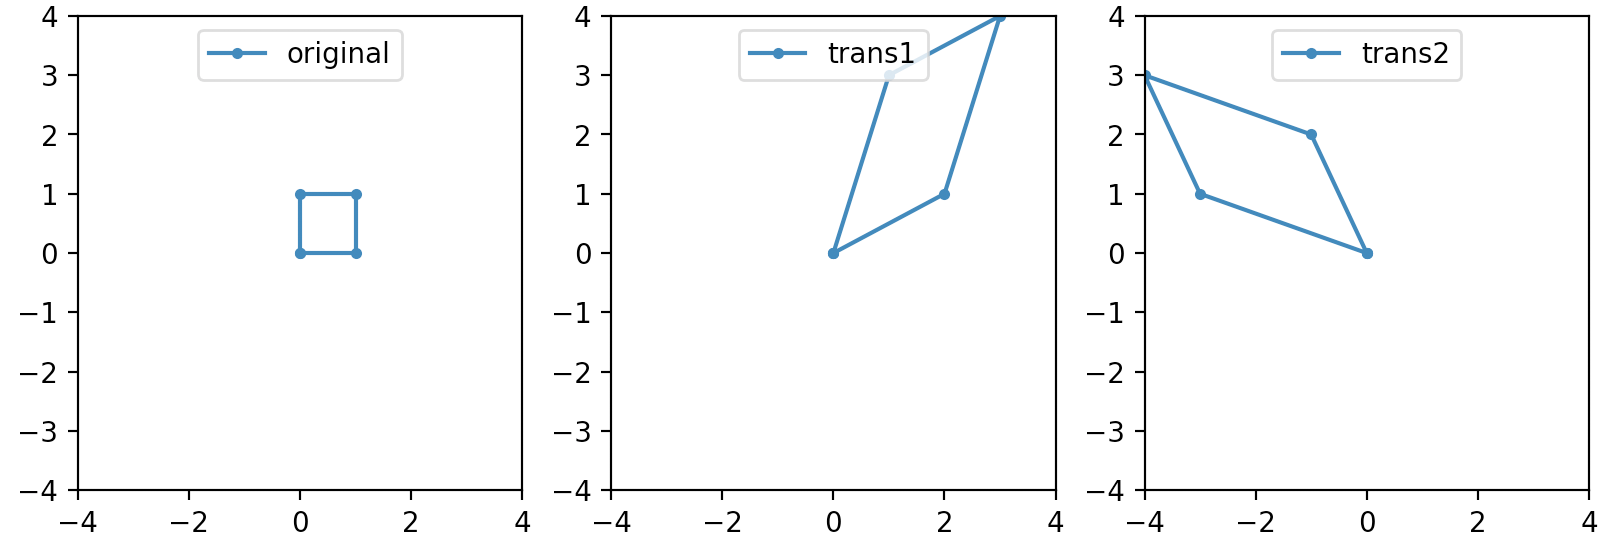
下図のように変換順が異なると、図形も異なる
通常の数式のようにABx = BAxが成り立たないことがわかります
