はじめに
2025年、AWSはAIエージェントとの連携を大きく進化させました。その中心の1つがAWS MCP Serversだと私は考えています。
この記事では、re:Invent2025のタイミングでPreview版が公開されたAWS MCP Serverについて、従来のAWS MCP Servers(AWS Knowledge MCPやAWS CLI MCP等)との違い、提供される機能、そして実際の使用感をお伝えします。
読んでいて混乱された方もいらっしゃると思います。私も最初、混乱しました。
AWS MCP Serversが既にGAしていたのに、AWS MCP ServerがPreviewで登場というのは、どういうことなのかと。
ややこしいのですが、AWS MCP Server「s」(複数形・以前からあるOSSのMCP Server群)とAWS MCP Server(単数形・Preview版)が存在することになり、名前の違いは末尾の 「s」 があるか、ないかだけです。
注意
AWS MCP Server(Preview)は2026/1時点でプレビュー状態ですので、内容が随時変わる可能性があります。最新のドキュメントをご確認いただき、ご利用ください。
1. MCPとは何か
今更ですが、まず、MCPとは何かという点から振り返ります。
Model Context Protocol(MCP)は、Anthropic社が2024年11月にオープンソース化したプロトコルです。
MCPは、LLM(大規模言語モデル)アプリケーションと外部データソース・ツールを接続する標準規格です。
私がMCPを使うと便利と感じているポイントは以下です。
- 最新情報へのアクセス: LLMの学習データは古くなるが、MCPで最新ドキュメントを参照可能なのでより正しい回答が得られやすくなる
- ツール実行: AIエージェントが実際にコマンドを実行し、稼働している環境からより正確な情報が得られる
- 標準化されている: 各ツールで異なる連携方法を設定する必要がない
2. AWS MCP Serversの歴史と進化
続いて、MCP誕生からAWS MCP Server(Preview)登場までの変遷について、振り返っておきます。
タイムライン
| 時期 | イベント | 詳細 |
|---|---|---|
| 2024年11月 | MCP オープンソース化 | Anthropic社がMCPを公開 |
| 2025年4月 | AWS MCP Servers発表 | awslabs/mcpリポジトリ公開 |
| 2025年5月 | Serverless/Container MCP | Lambda、ECS、EKS対応 |
| 2025年7月 | AWS API MCP Server GA | 15,000以上のAWS APIに対応 |
| 2025年10月 | AWS Knowledge MCP GA | フルマネージドリモートサーバーの提供 |
| 2025年11月 | AWS MCP Server (Preview) | Knowledge + API + SOPsを統合 |
こうしてみると、2024年11月に登場して以降、わずか1年強で一気に広がっています。最近ではMCP Serverを自作されている方もいらっしゃるので、私ももっと勉強していきたいです。
AWS MCP Serversについても、登場以来、ただ増殖し続けているという訳ではなく、AWS CDK MCP Server(cdk-mcp-server)がAWS IaC MCP Server(aws-iac-mcp-server)に移行したり、LLMが高性能になったことに伴って、Code Documentation Generation MCP Serverが廃止となるなど、時代に合わせて既存のツールも改良、精査されてきています。
3. AWS MCP Server(Preview)の主要機能
それでは、AWS MCP Server(Preview)の主要機能を確認します。
AWS Knowledge(知識)
最新のAWSドキュメント、ベストプラクティス、リージョン情報にアクセスできます。
提供されるツール:
-
search_documentation: ドキュメント検索 -
read_documentation: ドキュメント取得(Markdown形式) -
recommend: 関連コンテンツの推薦 -
list_regions: リージョン一覧取得 -
get_regional_availability: サービス/APIのリージョン別可用性
参照ソース:
- AWS公式ドキュメント
- What's New投稿
- AWSブログ
- Well-Architectedガイダンス
- Builder Centerコンテンツ
AWS API(実行)
15,000以上のAWS APIを自然言語で実行できます。
特徴:
- SigV4認証による安全な実行
- 構文的に正しいCLIコマンドの自動生成
- エラーハンドリング
- IAMポリシーに基づくアクセス制御
Agent SOPs(ワークフロー)
複雑なマルチステップタスクを事前定義されたSOPs(Standard Operating Procedures)というワークフローが準備されていて、エージェント経由で利用できます。
4. 従来のMCP Serverとの比較
AWS MCP Serverの概要を把握したところで、既存の個別MCP ServerとAWS MCP Server(Preview)の比較をしていきたいと思います。
AWS MCP Server(Preview)に含まれているKnowledgeとAPIのMCPで見ていきます。
Before: AWS Knowledge MCP + AWS API MCP(個別設定)
AWS MCP Server(Preview)が登場する前は、AWS Knowledge MCPとAWS API MCPを個別に設定する必要がありました。
{
  "mcpServers": {
      "aws-knowledge-mcp-server": {
      "type": "http",
      "url": "https://knowledge-mcp.global.api.aws",
      "autoApprove": [
        "aws___search_documentation",
        "aws___read_documentation",
        "aws___recommend",
        "aws___get_regional_availability",
        "aws___list_regions"
      ]
    },
      "awslabs.aws-api-mcp-server": {
      "command": "uvx",
      "args": [
        "awslabs.aws-api-mcp-server@latest"
      ],
      "disabled": false,
      "autoApprove": [],
      "env": {
        "AWS_REGION": "us-east-1"
      }
    }
  }
}
特徴:
- Knowledge(ドキュメント検索)とAPI(実行)が分離
- 2つのServerを個別に設定・管理
aws-api-mcp-sererの構成イメージです。ローカルに作成されるMCP Server経由でAWSサービスをAWS APIで操作する形になります。

After: AWS MCP Server(Preview)
一方で、2025年11月に発表されたAWS MCP Server(Preview)は、従来のMCP Serverを組み合わせて効率的に利用できるようになっています。
公式ドキュメントからの引用
The AWS MCP Server consolidates capabilities from existing MCP servers (AWS Knowledge MCP and AWS API MCP) into a single, unified interface that reduces configuration complexity while improving AI agent effectiveness across multi-service AWS workflows.
AWS MCP サーバーは、既存の MCP サーバー (AWS Knowledge MCP および AWS API MCP) の機能を単一の統合インターフェイスに統合し、構成の複雑さを軽減しながら、マルチサービス AWS ワークフロー全体で AI エージェントの有効性を向上させます。
実際の定義例は以下になります。
{
  "mcpServers": {
    "aws-mcp": {
      "command": "uvx",
      "timeout": 100000,
      "transport": "stdio",
      "args": [
        "mcp-proxy-for-aws@latest",
        "https://aws-mcp.us-east-1.api.aws/mcp",
        "--metadata", "AWS_REGION=us-east-1"
      ]
    }
  }
}
特徴:
- 単一エンドポイントで全機能にアクセス可能
- IAM認証によるセキュリティ管理
- MCP Server自体へのアクセスがCloudTrailに記録される
- Agent SOPs(事前定義ワークフロー)の提供
今回の定義を確認している中で、2025年10月にリリースされたMCP Proxy for AWSが設定されていました。
私の理解では、以下の形でリモートのMCP Serverに対してSigV4署名を用いて安全にリクエストできるよう、Proxyをローカルに起動するイメージです。

比較してみると以下になります。
| 項目 | ローカルMCP (従来のKnowledge + API) |
リモートMCP (AWS MCP Server(Preview)) |
|---|---|---|
| 設定の複雑さ | 2つのサーバーを個別設定 | 1つの設定のみ |
| 認証 | ユーザーのAWS Profile / 環境変数 | IAM Role (サービス専用ロールあり) |
| CloudTrail記録 | AWS API呼び出しのみ | 認証フロー (AssumeRole + GetCallerIdentity) + AWS API呼び出し |
| 実行ロール | ユーザーのSSO/IAMロール | AWS管理ポリシーAWSMcpServiceActionsFullAccess等をアタッチ |
| マルチサービス連携 | 手動で調整 | Agent SOPsで自動化 |
| 管理 | ローカルで個別管理 | マネージドサービス(管理不要) |
| 共有性 | 個人環境ごとに設定 | エンドポイント指定のみで全員が利用可能 |
| 更新管理 | 手動更新が必要 | 自動更新(管理不可) |
リモートのAWS MCP Server側はマネージドなので、個別の管理をしなくて良い・エンドポイントを指定するだけでみんなが同じMCP Serverを使えるというメリットが享受できます。(一方で、見えない部分で更新が行われていくので、管理できないといった部分をデメリットと捉えることもできると思います)
(補足)SigV4(Signature Version 4)とは?
SigV4は、AWSへのAPIリクエストに「署名」を付けて、リクエストの送信者が本人であることを証明する仕組みです。AWS CLIやSDKを使う場合、SigV4署名は以下の流れで自動的に作成されます。
- ~/.aws/credentials からアクセスキーを読み込み
- リクエスト内容からSigV4署名を計算
- 署名付きリクエストをAWSに送信
MCP Serverでも同様に、ローカルMCP ServerやMCP Proxy for AWSがSigV4署名を自動的に処理してくれます。
SigV4署名の材料
- アクセスキーID(公開鍵のようなもの)
- シークレットアクセスキー(秘密鍵)
- リクエスト内容(何をしたいか)
- タイムスタンプ(いつリクエストしたか)
- リージョン(どこのAWSリージョンか)
これらを組み合わせてハッシュ計算し、一意の署名文字列を生成します。
CloudTrail・監査ログ視点での違い
今回のPreview版発表でCloudTrailの記録ということが触れられていました。この点について、あれ?以前のAWS API MCPでもCloudTrailに記録されていたのでは?と私は疑問に思い、先ほどのイメージ図を起こした上で、実際のCloudTrailログを確認しました。
ap-northeast-1のEC2インスタンスをリストアップするよう、Kiro-cliで依頼し、CloudTrailを確認しました。
ローカルMCP Server使用時のCloudTrail記録
実行されたAWS API:DescribeInstances → ap-northeast-1に出力
ローカルMCP Server(AWS API MCP Server)で東京リージョンのEC2インスタンス一覧を取得
{
    "eventVersion": "1.11",
    "userIdentity": {***},
    "eventTime": "2026-01-03T16:54:11Z",
    "eventSource": "ec2.amazonaws.com",
    "eventName": "DescribeInstances",
    "awsRegion": "ap-northeast-1",
    "sourceIPAddress": "***",
    "userAgent": "Boto3/1.42.34 md/Botocore#1.42.34 md/awscrt#0.29.2 ua/2.1 os/macos#24.6.0 md/arch#arm64 lang/python#3.11.13 md/pyimpl#CPython m/F,C,Z,e,b cfg/retry-mode#adaptive Botocore/1.42.34 awslabs/mcp/AWS-API-MCP-server/1.3.7 via/AWS-API-MCP MCPClient/Q DEV CLI#1.0.0 cfg/ro#0 cfg/consent#0 cfg/scripts#0",
    "requestParameters": {
        "instancesSet": {},
        "filterSet": {}
    },
    "responseElements": null,
    "requestID": "6b3d9ee2-87a9-48b6-99c2-52b6ff8e80c1",
    "eventID": "b5319bf7-6bb3-40dc-8a6f-08eab8d699ae",
    "readOnly": true,
    "eventType": "AwsApiCall",
    "managementEvent": true,
    "recipientAccountId": "***",
    "eventCategory": "Management",
    ""tlsVersion": "TLSv1.3",
        "cipherSuite": "TLS_AES_128_GCM_SHA256",
        "clientProvidedHostHeader": "ec2.ap-northeast-1.amazonaws.com"
    }
}
記録されていた内容
- どこからアクセスしたかのクライアント側IPアドレス
- userAgentの情報
実行されたAWS API(DescribeInstances)はわかりますが、「MCP Serverを使った」という情報は記録されていません。
リモートMCP Server(AWS MCP Server(Preview))使用時のCloudTrail記録
リモートMCP Serverを使用した場合、大きく2種類のイベントが記録されました。
1. MCP Serverへのアクセス(MCP関連)
初期化の際に出力:Initialize → us-east-1に出力
{
    "eventVersion": "1.11",
    "userIdentity": {***},
    "eventTime": "2026-01-03T10:27:42Z",
    "eventSource": "aws-mcp.amazonaws.com",
    "eventName": "Initialize",
    "awsRegion": "us-east-1",
    "sourceIPAddress": "***",
    "userAgent": "python-httpx/0.28.1",
    "requestParameters": {
        "jsonrpc": "2.0",
        "method": "initialize",
        "id": 0,
        "params": "***"
    },
    "responseElements": {
        "jsonrpc": "2.0",
        "id": 0,
        "result": "***"
    },
    "requestID": "b048481d-4318-4d04-a051-c08f4dca973c",
    "eventID": "f1a543c0-c080-413d-a2ec-c1a8fc7ebb34",
    "readOnly": false,
    "eventType": "AwsMcpEvent",
    "managementEvent": true,
    "recipientAccountId": "***",
    "eventCategory": "Management"
}
ツール利用の際に出力:CallReadWriteTool → us-east-1に出力
{
    "eventVersion": "1.11",
    "userIdentity": {},
    "eventTime": "2026-01-03T10:28:42Z",
    "eventSource": "aws-mcp.amazonaws.com",
    "eventName": "CallReadWriteTool",
    "awsRegion": "us-east-1",
    "sourceIPAddress": "",
    "userAgent": "python-httpx/0.28.1",
    "requestParameters": {
        "jsonrpc": "2.0",
        "method": "tools/call",
        "id": 8,
        "params": {
            "name": "aws___call_aws",
            "_meta": "***",
            "arguments": "※※※"
        }
    },
    "responseElements": {
        "jsonrpc": "2.0",
        "id": 8,
        "result": "***"
    },
    "requestID": "5c64f983-0e87-4492-80bc-799dae35633d",
    "eventID": "f4bb1b4b-ad4b-4fb0-b6fc-1430dd75d617",
    "readOnly": false,
    "eventType": "AwsMcpEvent",
    "managementEvent": true,
    "recipientAccountId": "***",
    "eventCategory": "Management"
}
2. 実行されたAWS API:DescribeInstances → ap-northeast-1に出力
{
    "eventVersion": "1.11",
    "userIdentity": {***},
        "invokedBy": "aws-mcp.amazonaws.com"
    },
    "eventTime": "2026-01-03T10:28:42Z",
    "eventSource": "ec2.amazonaws.com",
    "eventName": "DescribeInstances",
    "awsRegion": "ap-northeast-1",
    "sourceIPAddress": "aws-mcp.amazonaws.com",
    "userAgent": "aws-mcp.amazonaws.com",
    "requestParameters": {
        "instancesSet": {},
        "filterSet": {}
    },
    "responseElements": null,
    "requestID": "4fa5b6d3-534f-419e-afc1-a21bb77934cb",
    "eventID": "bd4560a4-ab0f-4541-9da0-a561ebd7fb27",
    "readOnly": true,
    "eventType": "AwsApiCall",
    "managementEvent": true,
    "recipientAccountId": "***",
    "eventCategory": "Management"
}
記録されていた内容
- MCP Serverへのアクセス(
Initialize、CallReadWriteTool)と使用したツール名 - 実行されたAWS API(
DescribeInstances) - 実際のAWS APIのuserIdentityに
"invokedBy": "aws-mcp.amazonaws.com"という情報が追加
AWS MCP Server(Preview)ではMCP Serverへの接続・認証フローがCloudTrailに記録され、「誰が」「いつ」「どのサービス経由で」AWS APIを実行したかを追跡できます。一方で、実際のユーザー識別はサービスロール経由となるため、セッション名やタイムスタンプでの相関分析が必要になることがわかりました。
エンタープライズ観点では、統一された実行環境と認証フローの可視化により、より体系的な監査が可能になる方向に進化していると言えます。
なお、MCP Server側のCloudTrailのログについて、ドキュメントに記載されている内容と実際に出力された内容が異なっていました。この辺りはGAに向けてアップデートされていくものと考えます。
5. Agent SOPs一覧
第3項で記載していた通り、Agent SOPsは、AIエージェントがマルチステップのAWSタスクを実行する際に活用される、事前構築済みのワークフローです。構造化された手順で、パラメータ化された入力により、進捗の追跡・再利用ができる形にしたものとなります。
Strands AgentのAgent SOPsに関するAWSブログですが、以下を参考にしました。
利用可能なAgent SOPs
マニュアルに記載のある通り、AIエージェントに以下のように質問することで、利用可能なAgent SOPsを確認できます。
What Agent SOPs do you have available?
以下、AIエージェントの回答を折りたたんで記載しておきます。回答の冒頭に「27個のSOP」と言っていて、おぉ!さっそく先月より増えたのかな?とワクワクしたのですが、数えたら25個しかありませんでした…。残念。
AIエージェントの回答(原文)
> I have 27 Agent SOPs available, organized by category:

## **Compute & Containers**
- launch-ec2-instance-with-best-practices - Launch EC2 with security and cost best practices
- ec2-instance-profile-setup - Configure IAM roles for EC2 instances
- efs-ec2-mount - Create and mount encrypted EFS on EC2

## **Networking**
- create_production_vpc_multi_az - Production VPC with multi-AZ setup
- vpc-peering-connection - Establish VPC peering connections
- configure_vpc_endpoints_for_private_aws_service_access - Configure VPC endpoints
- route53-cloudfront-routing - Map custom domains to CloudFront

## **Serverless**
- lambda-gateway-api - Create API Gateway + Lambda integration
- lambda-vpc-internet-access - Enable internet access for VPC Lambda
- lambda-timeout-debugging - Debug Lambda timeout issues

## **Storage & Database**
- secure-s3-buckets - Apply security best practices to S3
- create_amazon_aurora_db_cluster_with_instances - Create Aurora DB cluster
- efs-ec2-mount - EFS file system setup

## **Security & Secrets**
- create-secrets-using-best-practices - AWS Secrets Manager setup
- cloudtral-mutli-region-setup - Multi-region CloudTrail configuration
- ec2-instance-profile-setup - IAM role configuration

## **Deployment & CI/CD**
- deploy-webapp - Deploy static web apps (entry point)
- deploy-frontend-app - S3 + CloudFront deployment workflow
- setup-pipeline - CI/CD pipeline with CodePipeline
- document-deployment - Track deployment progress

## **Amplify**
- amplify-backend-implementation - Amplify Gen2 backend creation
- amplify-frontend-integration - Integrate Amplify with existing frontend
- amplify-deployment-guide - Amplify deployment and configuration

## **Monitoring & Troubleshooting**
- application-failure-troubleshooting - Analyze CloudWatch logs for failures
- lambda-timeout-debugging - Debug Lambda timeouts
- setup_cloudwatch_alarm_notifications - Configure CloudWatch alarms

## **API Management**
- lambda-gateway-api - API Gateway setup
- create_api_gateway_stage - Create API Gateway stages

## **Cost Management**
- create-budget - Create AWS Budgets with alerts

Each SOP provides step-by-step guidance with AWS CLI commands, error handling, and best practices built in.
 ▸ Credits: 0.56 • Time: 23s
得られた回答を元に、2026年1月時点で利用可能なAgent SOPsを一覧化しました。
| カテゴリ | SOP名 | 説明 |
|---|---|---|
| コンピューティング | launch-ec2-instance-with-best-practices | セキュアで費用効率の良いデフォルト設定でEC2インスタンスを起動 |
| コンピューティング | ec2-instance-profile-setup | EC2インスタンスがAWSサービスを安全に呼び出せるようIAMロールを設定 |
| コンピューティング | efs-ec2-mount | 暗号化されたEFSファイルシステムを作成しEC2にマウント |
| ネットワーキング | create_production_vpc_multi_az | マルチAZ対応の本番環境用VPCを作成(Well-Architected準拠) |
| ネットワーキング | vpc-peering-connection | VPC間のセキュアなプライベート接続を確立 |
| ネットワーキング | configure_vpc_endpoints_for_private_aws_service_access | インターネットゲートウェイなしでAWSサービスにアクセスするVPCエンドポイントを設定 |
| ネットワーキング | route53-cloudfront-routing | Route 53を使用してカスタムドメインをCloudFrontにマッピング |
| サーバーレス | lambda-gateway-api | REST API GatewayとLambda関数を接続してHTTP呼び出しを有効化 |
| サーバーレス | lambda-vpc-internet-access | VPCサブネット内のLambda関数にインターネットアクセスを提供 |
| ストレージ・データベース | secure-s3-buckets | S3バケットに最小権限のセキュリティ制御を適用 |
| ストレージ・データベース | create_amazon_aurora_db_cluster_with_instances | Aurora DBクラスターとインスタンスを適切な順序で作成 |
| セキュリティ・認証情報 | create-secrets-using-best-practices | AWS Secrets Managerでシークレットを作成(ローテーション、暗号化、監査を含む) |
| セキュリティ・認証情報 | cloudtral-mutli-region-setup | 全リージョンでCloudTrailを有効化し、CloudWatch Logs Insightsでログ分析を設定 |
| デプロイメント・CI/CD | deploy-webapp | 静的Webアプリ(Lovable等)をAWSにデプロイ(エントリーポイント) |
| デプロイメント・CI/CD | deploy-frontend-app | 静的WebサイトをS3 + CloudFrontにデプロイする完全なワークフロー |
| デプロイメント・CI/CD | setup-pipeline | CDKアプリケーション用のCI/CDパイプラインをCodePipelineで作成 |
| デプロイメント・CI/CD | document-deployment | デプロイ進捗を追跡管理するためのデプロイメントプランを作成 |
| Amplify | amplify-backend-implementation | Amplify Gen2バックエンドインフラをTypeScriptで作成(認証、データモデル、AI機能等) |
| Amplify | amplify-frontend-integration | 既存のフロントエンドコード(React、Vue等)にAmplify Gen2を統合 |
| Amplify | amplify-deployment-guide | Amplify Gen2のデプロイ、環境設定、トラブルシューティング |
| 監視・トラブルシューティング | application-failure-troubleshooting | CloudWatchログを分析してアプリケーション障害のエラーパターンと根本原因を特定 |
| 監視・トラブルシューティング | lambda-timeout-debugging | Lambda関数のタイムアウト障害をデバッグし根本原因を特定 |
| 監視・トラブルシューティング | setup_cloudwatch_alarm_notifications | CloudWatchアラームの通知チャネルをSNSで設定(メール、SMS等) |
| API管理 | create_api_gateway_stage | REST APIのステージを作成し、ログ記録とステージ変数を適切に設定 |
| コスト管理 | create-budget | AWS Budgetsをインテリジェントなデフォルト設定とアラートで作成 |
環境を作る際に、APIで作っても良いのですが、IaCのコードを生成した上でデプロイした方が繰り返し使えて良いのではないかと思うこともあり、今回は監視・トラブルシューティングのapplication-failure-troubleshootingを見てみることにしました。
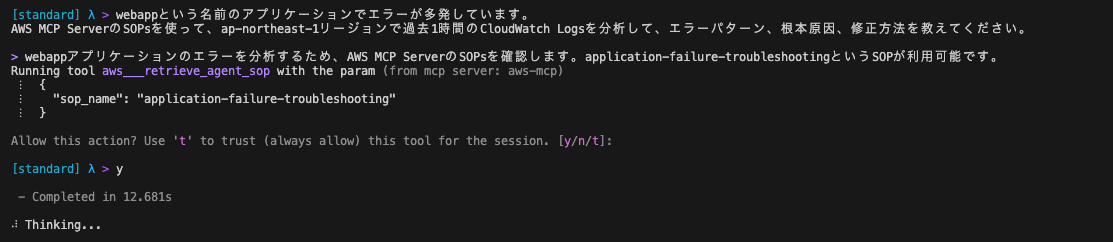
6. application-failure-troubleshootingを深掘ってみる
application-failure-troubleshootingについて、実際のSOPの中身が見たいと依頼したら、aws___retrieve_agent_sopツールを使用して、回答してくれました。
9つのステップを踏んで、順次分析をしていくこと、回答の出力方も指定されており、実践的な内容になっているように感じました。また、パラメータとして何を指定するかも記載がありました。
日本語に要約してもらったものが以下です。
## **概要**
CloudWatch ログ分析を通じて、障害が発生しているアプリケーションの包括的なトラブルシューティングを提供します。
## **パラメータ**
- **application_name** (必須): 障害が発生しているアプリケーション名
- **region** (必須): アプリケーションがデプロイされている AWS リージョン
- **time_window_hours** (オプション, デフォルト: 2): 分析対象の時間範囲(時間単位)
## **9つのステップ**
### **1. 依存関係の確認**
- call_aws ツールの存在確認
- AWS 認証情報の検証
### **2. 関連ロググループの検出**
- アプリケーション名を含む CloudWatch ロググループを検索
- Lambda, API Gateway, ECS, ALB などの一般的なパターンを検索
- ユーザーに関連するロググループの確認を依頼
### **3. ロググループの検証と可用性チェック**
- 選択されたロググループの存在確認
- ログストリームの一覧取得
- lastEventTimestamp から最新のアクティビティを判断
- 分析時間範囲の調整
### **4. アプリケーションログの分析**
- エラーパターンの検索クエリ実行
- 例外とスタックトレースの検索クエリ実行
- CloudWatch Logs Insights を使用
### **5. ログクエリ結果の待機**
- クエリステータスのポーリング
- 完了まで待機
- 結果の保存
### **6. エラーパターンと頻度の分析**
- エラーをタイプ別に分類:
- アプリケーション例外
- 接続エラー
- 認証/認可エラー
- リソースエラー
- 外部サービスエラー
- 設定エラー
- 頻度のカウント
- タイミングパターンの分析
### **7. 根本原因分析の生成**
- 頻度と重大度に基づく優先順位付け
- 問題の分類:
- アプリケーションコードの問題
- インフラストラクチャの問題
- 設定の問題
- 依存関係の問題
- 各根本原因の証拠提示
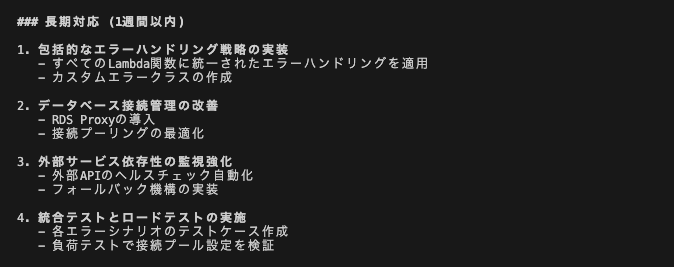
### **8. 実行可能な推奨事項の作成**
- 優先度別の推奨事項:
- **即時対応**: 進行中の障害を停止
- **短期対応**: 再発防止
- **長期対応**: アーキテクチャ改善
- 具体的な AWS CLI コマンドや設定変更
- 監視とアラート設定の推奨
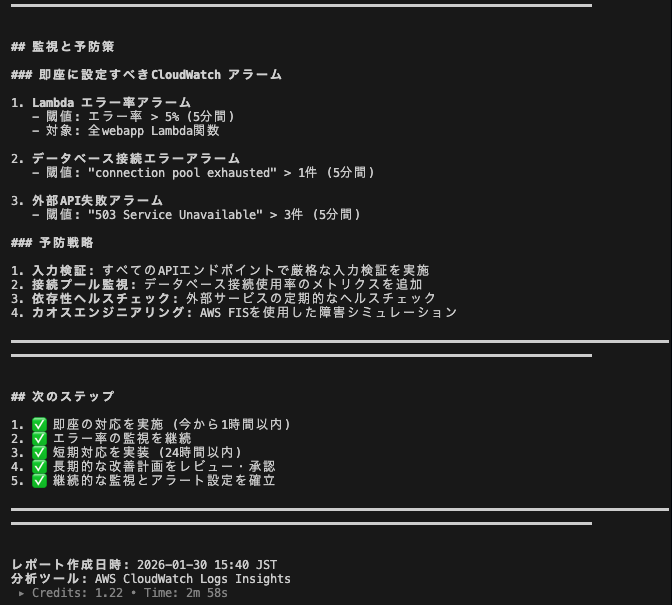
### **9. 包括的なレポートの作成**
- エグゼクティブサマリー
- 分析したロググループ
- エラーパターン分析
- 具体的なエラーメッセージとスタックトレース
- 根本原因分析
- 優先順位付けされたアクションプラン
- コード修正と設定変更の推奨
- 監視とアラートの推奨
## **出力例の特徴**
実際の出力例では、payment-service の分析結果として:
- 847 エラーを検出
- 主要原因: コネクションプール枯渇(67%)
- 副次原因: NullPointerException(23%)
- 具体的なコード修正例
- 即時/短期/長期のアクションプラン
英語の原文はこちらになります。
application-failure-troubleshooting SOP定義(原文)
> # Application Failure Troubleshooting

## Overview

This SOP provides comprehensive troubleshooting for failing applications through CloudWatch log analysis. It discovers log
groups related to the application name, searches for error patterns, analyzes stack traces and exceptions, and provides
specific recommendations based on the findings in the logs.

## Parameters

Prompt the user in a single message to provide all required parameters at once. Clearly list the required parameters and their
descriptions, and include any optional parameters with their default values. Do not proceed until you have received and
confirmed all required parameters. If any required parameter is missing or unclear, you MUST explicitly request the missing
information before moving forward.

- **application_name** (required): The name of the failing application (e.g., "user-api", "payment-service", "web-app")
- **region** (required): The AWS region where the application is deployed
- **time_window_hours** (optional, default: 2): Number of hours to look back for analysis (e.g., 1, 2, 4, 8, 12, 24)

Only proceed to the steps below if you have all required information.

## Steps

### 1. Verify Dependencies

Check for required tools and warn the user if any are missing.

Constraints:
- You MUST verify the following tools are available in your context:
  - call_aws
- You MUST ONLY check for tool existence and MUST NOT attempt to run the tools because running tools during verification could
cause unintended side effects, consume resources unnecessarily, or trigger actions before the user is ready
- You MUST inform the user about any missing tools with a clear message
- You MUST ask if the user wants to proceed anyway despite missing tools
- You MUST respect the user's decision to proceed or abort

### 2. Discover Relevant Log Groups

Search for CloudWatch log groups that are related to the application name.

Constraints:
- You MUST search for log groups that contain the application name using: aws logs describe-log-groups --region ${region}
- You MUST filter the results to find log groups that contain the application_name in their log group name
- You MUST also search for common AWS service log group patterns that might be related:
  - /aws/lambda/*${application_name}*
  - /aws/apigateway/*${application_name}*
  - /aws/ecs/*${application_name}*
  - /aws/applicationelb/*${application_name}*
  - *${application_name}* (custom application log groups)
- You MUST present all discovered log groups to the user and ask them to confirm which ones are relevant to the application
- You MUST handle cases where no log groups are found and ask the user to provide specific log group names
- You MUST save the confirmed log groups for analysis
- If no relevant log groups are found, You MUST ask the user to provide specific log group names manually

### 3. Validate Log Groups and Check Availability

Verify the selected log groups exist and determine the available time range for analysis.

Constraints:
- You MUST validate each confirmed log group using:
aws logs describe-log-groups --log-group-name-prefix ${log_group_name} --region ${region}
- You MUST list available log streams for each log group:
aws logs describe-log-streams --log-group-name ${log_group_name} --order-by LastEventTime --descending --max-items 10 --region ${region}
- You MUST verify that log streams exist before attempting any log queries
- You MUST calculate the effective time range based on log retention and creation time
- You MUST extract the lastEventTimestamp from log streams to determine the most recent activity
- You MUST inform the user if any log groups are empty or have no recent activity
- You MUST inform the user if the requested time window exceeds available log data
- You MUST adjust the analysis time window to fit within the available log data range

### 4. Analyze Application Logs

Search CloudWatch logs for error patterns and failure indicators.

Constraints:
- You MUST only proceed with log analysis if log streams were found in the previous step
- You MUST derive timestamps from existing AWS response data rather than calculating independently
- You MUST use the lastEventTimestamp from the log streams as the reference point for time calculations
- You MUST convert the validated time window to Unix timestamps (milliseconds since epoch)
- **Timestamp Derivation Process:**
  1. Extract lastEventTimestamp from the log streams response (step 3)
  2. Use this as your end time for the analysis window
  3. Calculate start time by subtracting the desired time window in milliseconds
  4. Use these derived timestamps for all CloudWatch Logs Insights queries
- You MUST start queries to search for errors and failure patterns:
  - **Error Query**:
aws logs start-query --log-group-name ${log_group_name} --start-time ${start_timestamp} --end-time ${end_timestamp} --query-string 'fields @timestamp, @message | filter @message like /(?i)(error|fail|exception|timeout|unable|denied|invalid)/ | sort @timestamp desc | limit 100' --region ${region}
  - **Exception Query**:
aws logs start-query --log-group-name ${log_group_name} --start-time ${start_timestamp} --end-time ${end_timestamp} --query-string 'fields @timestamp, @message | filter @message like /(?i)(exception|stack trace|caused by|at .+\\.java:|at .+\\.py:)/ | sort @timestamp desc | limit 100' --region ${region}
- You MUST remember all query IDs for result retrieval
- You MUST handle cases where log groups don't exist or are empty
- You MUST handle query errors gracefully and adjust time ranges if needed

### 5. Wait for Log Query Results

Poll for completion and retrieve results from all CloudWatch Logs queries.

Constraints:
- You MUST poll each query status using: aws logs get-query-results --query-id ${query_id} --region ${region}
- You MUST wait for all queries to reach "Complete" status before proceeding
- You MUST handle query failures and timeouts appropriately
- You MUST save all log results for pattern analysis
- You MUST extract key error patterns, stack traces, and failure indicators from the results
- You MUST identify the most frequent error messages and their timestamps

### 6. Analyze Error Patterns and Frequency

Analyze the collected log data to identify error patterns, frequency, and trends.

Constraints:
- You MUST categorize the errors found in the logs by type:
  - **Application Exceptions**: Unhandled exceptions, stack traces, runtime errors
  - **Connection Errors**: Network timeouts, connection failures, service unavailable
  - **Authentication/Authorization Errors**: Access denied, invalid credentials, permission errors
  - **Resource Errors**: Memory exhaustion, disk space, file system errors
  - **External Service Errors**: API call failures, timeout errors, third-party service issues
  - **Configuration Errors**: Missing configuration, invalid settings, environment issues
- You MUST count the frequency of each error type and identify the most common issues
- You MUST analyze the timing patterns to identify if errors are:
  - Consistent throughout the time period
  - Occurring in bursts or spikes
  - Correlated with specific time periods
- You MUST extract specific error messages, stack traces, and context information
- You MUST identify any correlation between different types of errors

### 7. Generate Root Cause Analysis

Identify the most likely root causes based on all collected evidence.

Constraints:
- You MUST prioritize root causes based on:
  - Frequency and severity of errors
  - Correlation with infrastructure metrics
  - Timing alignment with recent changes
  - Impact on user experience
- You MUST categorize issues into:
  - **Application Code Issues**: Unhandled exceptions, logic errors, resource leaks
  - **Infrastructure Issues**: Service outages, capacity limits, network problems
  - **Configuration Issues**: Incorrect settings, security group rules, timeout values
  - **Dependency Issues**: Database problems, external service failures, API limits
- You MUST provide evidence for each identified root cause
- You MUST estimate the impact and urgency of each issue

### 8. Create Actionable Recommendations

Develop specific, prioritized recommendations to resolve the application failures.

Constraints:
- You MUST create recommendations organized by priority and implementation complexity:
  - **Immediate Actions**: Critical fixes to stop ongoing failures
  - **Short-term Actions**: Important fixes to prevent recurrence
  - **Long-term Actions**: Architectural improvements and monitoring enhancements
- You MUST provide specific AWS CLI commands or configuration changes where applicable
- You MUST include monitoring and alerting recommendations to prevent future issues
- You MUST address the most common application failure causes:
  - Application code bugs and unhandled exceptions
  - Connection issues and timeouts
  - Resource exhaustion and capacity limits
  - Configuration errors and security issues
  - External dependency failures
  - Authentication and authorization problems
- You MUST include rollback procedures if recent changes are identified as the cause

### 9. Compile Comprehensive Report

Create a detailed troubleshooting report with findings and recommendations.

Constraints:
- You MUST create a structured report containing:
  - Executive summary of application failure analysis
  - Log groups analyzed and their relevance
  - Error pattern analysis with frequency and trends
  - Specific error messages and stack traces found
  - Root cause analysis based on log evidence
  - Prioritized action plan with specific steps
  - Code fixes and configuration changes recommended
  - Monitoring and alerting recommendations
- You MUST format the results in a clear, actionable manner for both technical and non-technical stakeholders
- You MUST include specific commands, configurations, and code examples where relevant
- You MUST present the results to the user in a well-organized format

## Examples

### Example Input
application_name: payment-service
region: us-west-2
time_window_hours: 4


### Example Output
# Application Failure Troubleshooting Report

**Application:** payment-service
**Region:** us-west-2
**Analysis Period:** Last 4 hours

## Executive Summary
- 847 errors detected across 3 log groups in the last 4 hours
- Peak error period: 2:15 PM - 2:45 PM UTC
- Primary root cause: Connection pool exhaustion (67% of errors)
- Secondary cause: Unhandled NullPointerException in validation (23% of errors)
- Tertiary cause: External service timeout (10% of errors)

## Log Groups Analyzed
- **/aws/lambda/payment-service-processor**: 456 errors (Lambda function logs)
- **/aws/lambda/payment-service-validator**: 234 errors (Validation service logs)
- **/payment-service/application**: 157 errors (Custom application logs)

## Error Pattern Analysis
### Error Frequency and Trends
- **Total errors**: 847 across all log groups
- **Error spike**: 2:15 PM - 2:45 PM (423 errors in 30 minutes)
- **Baseline errors**: 15-20 errors per hour outside spike period
- **Most affected component**: payment-service-processor (54% of errors)

### Specific Error Messages Found
1. **Connection Pool Exhaustion** (567 occurrences - 67%):

  ERROR: could not obtain a database connection within 30 seconds
  java.sql.SQLException: Connection pool exhausted
  at com.payment.db.ConnectionManager.getConnection(ConnectionManager.java:45)


2. **Null Pointer Exception in Validation** (198 occurrences - 23%):

  ERROR: NullPointerException in payment validation
  java.lang.NullPointerException: Cannot invoke "PaymentRequest.getAmount()" because "request" is null
  at com.payment.validator.PaymentValidator.validate(PaymentValidator.java:23)


3. **External Service Timeout** (82 occurrences - 10%):

  ERROR: Payment gateway timeout after 30 seconds
  java.net.SocketTimeoutException: Read timed out
  at com.payment.gateway.StripeClient.processPayment(StripeClient.java:67)


## Root Cause Analysis
### Primary Cause: Connection Pool Exhaustion
- **Evidence**: 567 "Connection pool exhausted" errors in logs, concentrated during traffic spike
- **Impact**: High - affects 67% of all errors
- **Urgency**: Critical - immediate action required
- **Location**: ConnectionManager.java:45 in payment-service-processor

### Secondary Cause: Null Pointer Exception in Validation
- **Evidence**: 198 NullPointerException errors when PaymentRequest.getAmount() is called on null object
- **Impact**: Medium - affects 23% of errors
- **Urgency**: High - code fix needed
- **Location**: PaymentValidator.java:23 in payment-service-validator

### Tertiary Cause: External Service Timeouts
- **Evidence**: 82 SocketTimeoutException errors from external API calls
- **Impact**: Low - affects 10% of errors
- **Urgency**: Medium - configuration and retry logic needed
- **Location**: StripeClient.java:67 in payment-service-processor

## Action Plan

### Immediate Actions
1. **Increase Connection Pool Size**:
   - Update ConnectionManager configuration to increase max connections from 20 to 50
   - Add connection pool monitoring and alerting
   - Deploy configuration change immediately

2. **Add Null Check in Validator**:

java
  // Fix in PaymentValidator.java:23
  public void validate(PaymentRequest request) {
      if (request == null) {
          throw new IllegalArgumentException("PaymentRequest cannot be null");
      }
      // existing validation logic...
  }


3. **Increase External Service Timeout**:
   - Update client timeout from 30 to 60 seconds
   - Add retry logic with exponential backoff

### Short-term Actions
1. **Implement Proper Error Handling**: Add comprehensive try-catch blocks around connection operations
2. **Add Input Validation**: Validate all incoming requests before processing
3. **Connection Pool Monitoring**: Add CloudWatch metrics for connection pool usage
4. **Circuit Breaker Pattern**: Implement circuit breaker for external service calls

### Long-term Actions
1. **Comprehensive Testing**: Add unit tests for null input scenarios and edge cases
2. **Load Testing**: Implement load testing to identify capacity limits
3. **Monitoring Enhancement**: Add detailed application metrics and alerting

## Monitoring & Prevention
### Immediate Monitoring Setup
1. **CloudWatch Log Alarms**:
   - Alert on "Connection pool exhausted" errors >10 per hour
   - Alert on "NullPointerException" errors >5 per hour
   - Alert on "SocketTimeoutException" errors >5 per hour

2. **Custom Metrics**: Create custom metrics from log patterns for real-time monitoring

### Prevention Strategies
1. **Input Validation**: Implement comprehensive input validation at API entry points
2. **Connection Pool Monitoring**: Add metrics and alerting for database connection usage
3. **Code Quality Gates**: Implement static code analysis to catch null pointer issues
4. **Load Testing**: Regular load testing to identify capacity limits before they cause issues

## Next Steps
1. Execute immediate actions within the next hour
2. Monitor error rates for improvement
3. Schedule short-term actions for implementation
4. Review and approve long-term architectural changes
5. Set up ongoing monitoring and alerting


## Troubleshooting

### No Log Groups Found
If no log groups are discovered for the application name, ask the user to provide specific log group names. Common patterns
include /aws/lambda/function-name, /aws/apigateway/api-name, or custom application log groups.

### No Logs Available
If CloudWatch logs are empty, check if logging is enabled for the application. Verify that the application is actually running
and generating logs during the specified time window.

### Access Denied Errors
Verify AWS credentials have permissions for CloudWatch Logs service, specifically logs:DescribeLogGroups,
logs:DescribeLogStreams, logs:StartQuery, and logs:GetQueryResults.

### High Volume Log Analysis
For applications with high log volumes, consider using shorter time windows (1-2 hours) or more specific log queries to avoid
timeouts and improve performance.

### Query Timeouts
If CloudWatch Logs Insights queries timeout, reduce the time window or limit the number of results. Large log groups may
require multiple smaller queries.

### Multi-Region Applications
For applications spanning multiple regions, run the analysis in each region separately since CloudWatch Logs are region-
specific.

### Log Retention Issues
If the requested time window exceeds log retention settings, adjust the analysis period to fit within the available log data
range.
定義内では、前述のAgent SOPsのAWSブログに記載されていた通り、RFC2119キーワード(MUST)を使用して制約を与えていたり、具体的なAWSコマンドの例示も記載されていて、エージェントに対してStep by Stepのワークフローで指示を与える際の参考にもなると感じました。
application-failure-troubleshootingを使う
実際に簡易Webアプリをベースに障害解析を実施してもらいました。Webアプリにはあらかじめ処理に失敗するようにいくつかエラーを仕込んでおきました。
Kiro-cliにAWS MCP Server(Preview)をセットして問い合わせながら確認していきます。
最初にシンプルに調査を依頼したら、aws___call_awsツールが呼ばれてしまい、SOPsを使ってもらえませんでした。

これだと先に進まないなと思い、SOPsを使って欲しいと少しだけ具体的にオーダーしました。そうすると、application-failure-troubleshootingを使うと回答があり、aws___retrieve_agent_sopでエージェントがSOPの情報を取得してくれました。この段階で、SOPの定義をエージェントが読み込んだことがわかります。
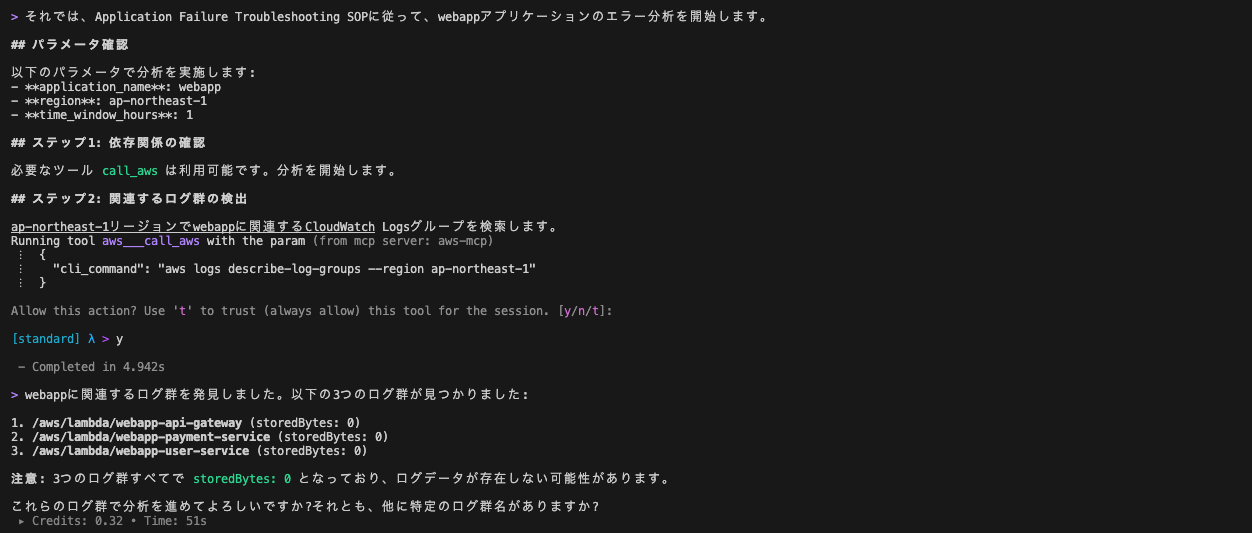
その後、SOP定義に書かれている必要なパラメータ(application_name、region、time_window_hours)を認識して、分析を開始しました。
ステップ1:依存関係の確認
call_awsツールが利用可能か確認
ステップ2: 関連するログ群の検出
SOP定義"You MUST search for log groups using: aws logs describe-log-groups --region ${region}" に沿って動いていることが確認できます。
そして、ロググループを発見しました。
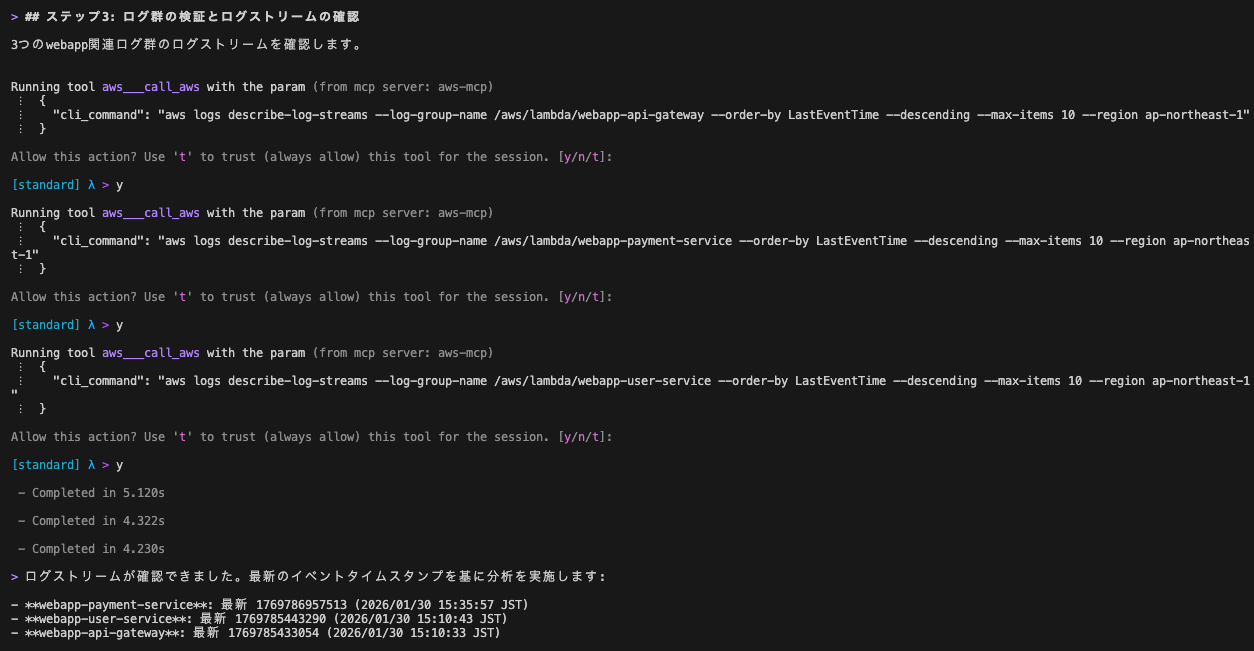
ステップ3: ログ群の検証とログストリームの確認
ここでも、SOP定義"You MUST list log streams using: aws logs describe-log-streams..."に沿って動いて、ログストリームを特定しました。
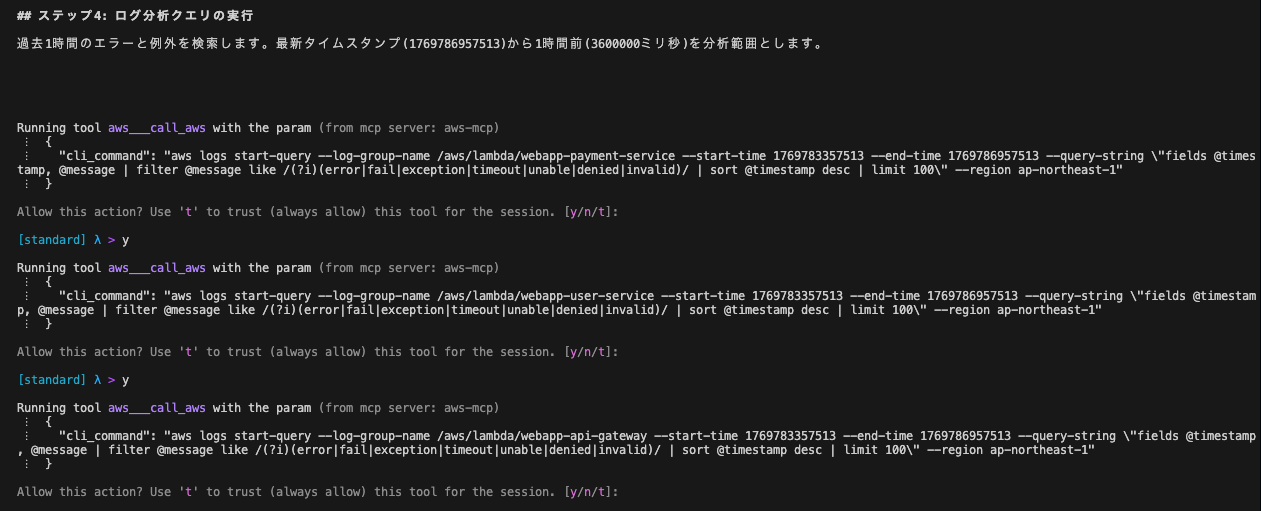
ステップ4: ログ分析クエリの実行
SOP定義"You MUST start queries to search for errors..."に沿って、エラークエリと例外クエリの2つを実行しています。
ステップ5: クエリ結果の取得
SOP定義"You MUST poll each query status using: aws logs get-query-results..."という記載の通り、ステップ4で実行したクエリの結果を確認していきます。

トラブルシューティングレポート
出力されたレポートが以下になります。
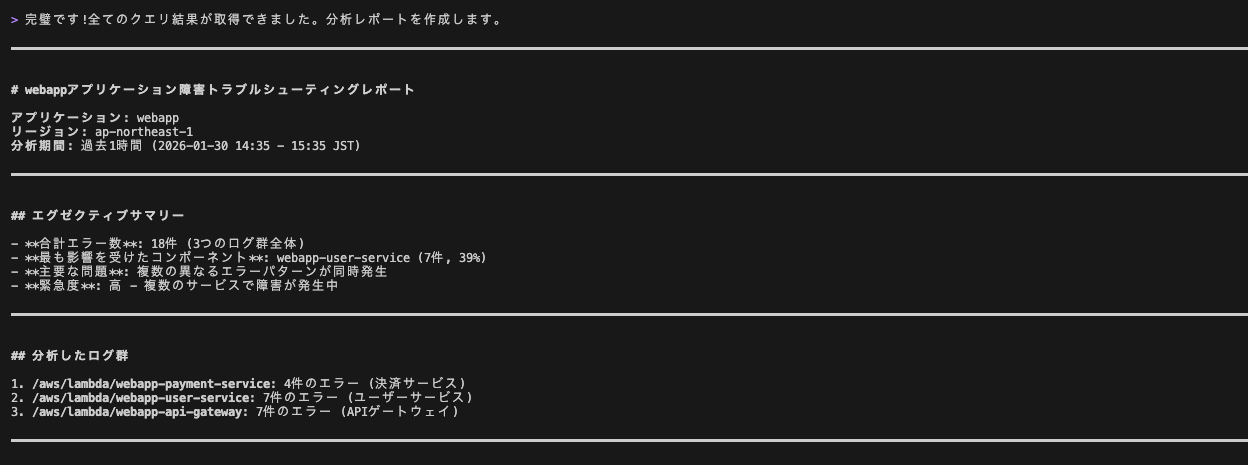
エラーパターン、頻度・回数を分類、分析してくれています。

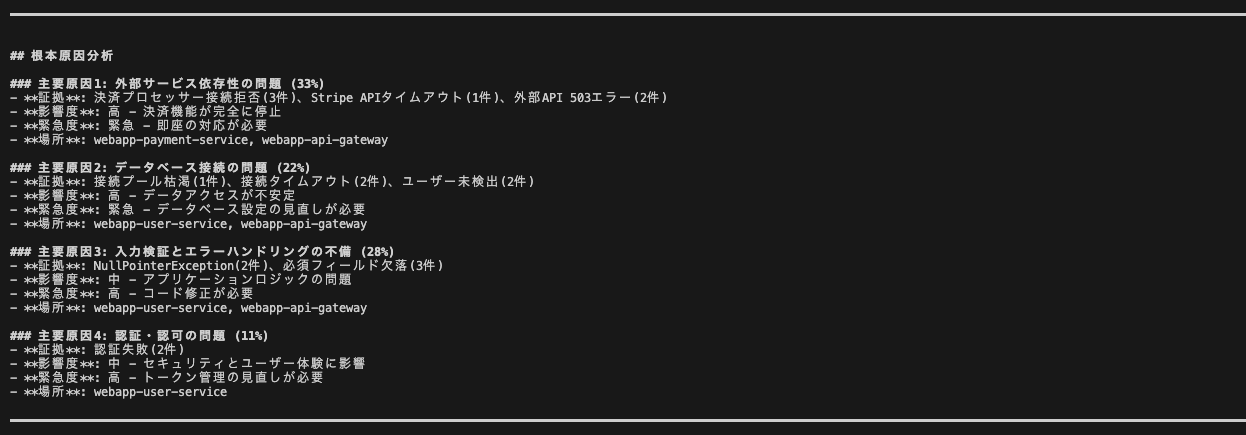
根本原因を推定しています。実際には存在しないDBなどのリソースに関する記載もあり、出力されたログ、ソースから想定していることがわかります。リソースを調査して、アーキテクチャ全体を把握するという形にSOPが定義されていないため、それ自体は正しい動きだと理解しました。
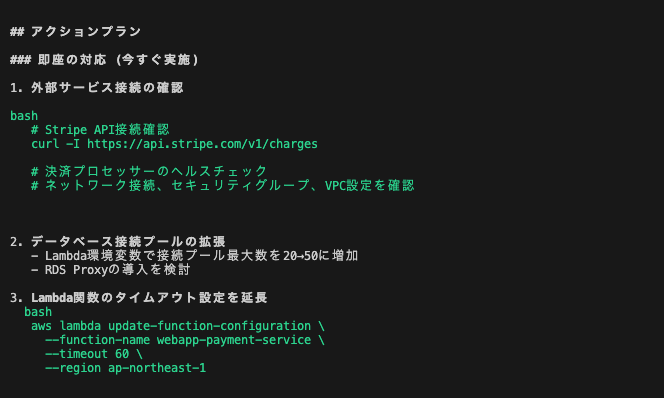
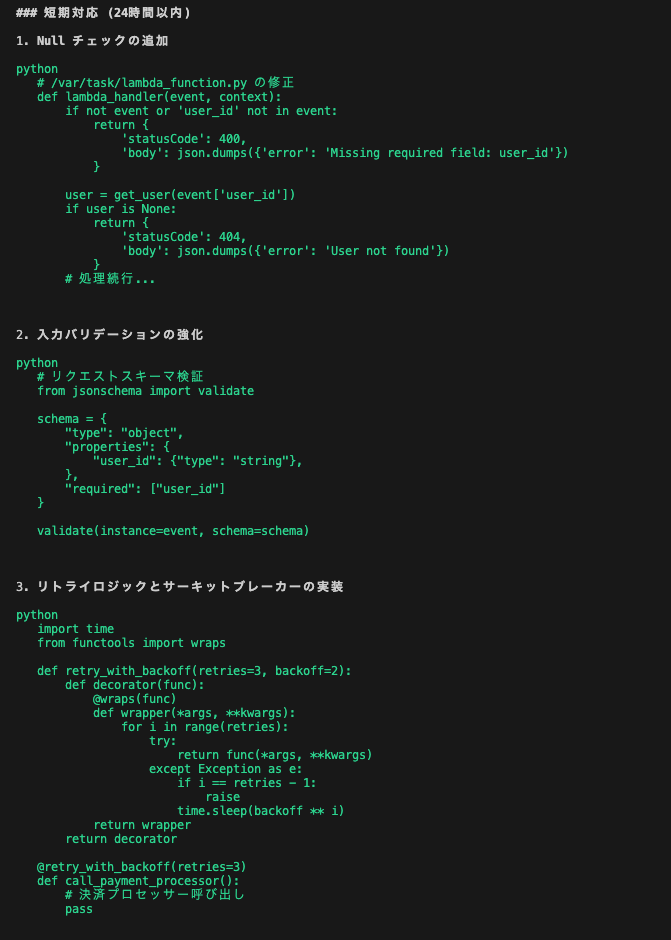
推奨事項がアクションプランとして生成されています。すぐ実施するもの、24時間以内、1週間以内と優先順位付けがされて、コード例も提供されています。
このレポートをファイルに出力して、別のエージェントに仕込んだ内容とともに読み込ませて、レポートを評価してもらいました。
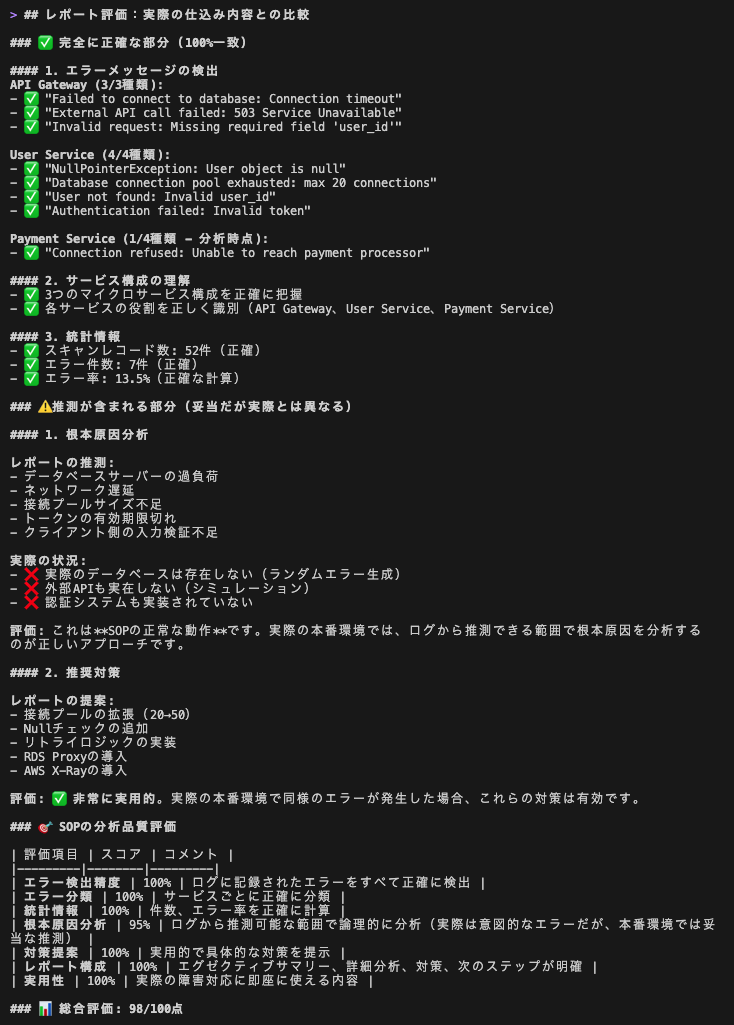
結果は100点満点中、98点の高得点でした。
私としては、SOPの定義にしっかり従って動きつつも、全てのエラーを漏れなく検知しているだけでなく、優先度付けされた対処方をコード例とともに具体的に示されている点が評価できると感じました。
なお、ログをベースに分析、解析をしているので、ログにないもの(今回はDBや外部APIなど)をコードから想像するのは仕方ない部分と判断しました。
今後、SOPが充実してきて、自社のルール、システムの特色に合わせたカスタマイズの定義が登録できると便利になるのではないかと感じました。
使い所を考えてみる
SOPsについて見てみたところで、AWS MCP Server(Preview)と専門MCP Serverの使い分けについて考えてみました。
| シナリオ | 考えられる選択肢 |
|---|---|
| 汎用的なAWS操作 | AWS MCP Server(Preview) |
| 特定サービスに特化した開発・運用 | 専門MCP Server(Cfn、Application Insights等) |
| 設定をシンプルにしたい | AWS MCP Server(Preview) |
以下、どちらを使うにしても、注意していく事柄です。
- 必要なMCP Serverのみを有効化する: 使わないMCP Serverは設定から除外して、ツールの内容でコンテキストを無駄に消費してしまうことを避ける必要があります。また、AWS MCP Server(Preview)とAWS API MCP Server・AWS Knowledge MCPとの併用も避けるよう、ドキュメントに書かれていました。
- 実際に試して比較する: Preview版と専用MCP Serverの両方を試し、自分のユースケースに合ったものを選択することが大切だと感じました
- Agent SOPsを活用する: 複雑なマルチステップタスクはPreview版のAgent SOPsが便利だなと感じました。他のSOPsは試していませんので、いろいろ試行しているうちに使いどころが具体的に見えてくるかもしれません。
7. まとめ
AWS MCP Server(Preview)のポイント
AWS MCP Serverのメリットを改めて振り返ってみます。
- 統合: AWS Knowledge + AWS API + Agent SOPsが1つのServerに統合
- 簡単: 設定は数行、自然言語でAWS操作が可能。MCP Serverの管理はAWSマネージド
- 安全: IAM認証、MCP Serverへのアクセス自体がCloudTrailに記録される
気になった点
私の環境に起因するものかもしれませんが、AWS MCP Server(Preview)を使っていて、従来のローカルMCP Serverと比べて遅いと感じました。MCP Serverまでの通信が不安定(おそらく私のWifi環境が悪い)なのか、回答が返ってことがローカルMCP Serverよりも多くなったように感じました。この辺りはPreview中ですし、改善の余地があるかもしれません。(的外れかもしれませんが、要望は挙げてみました)
最後に
AWS MCP Serverは、AIエージェントとAWSの連携を改善するツールです。特にAWS MCP Server(Preview)の登場により、設定の複雑さが解消され、セキュリティと監査機能も強化されたと感じました。今後はAgent SOPsのワークフローが拡充されていく、自分で定義を追加できるといったことを期待しています。
本内容が、これからAWS MCP Serverを触ってみるどなたかの参考になれば幸いです。