Kerasを始めましたのでメモ.
Kerasのインストール
pip install -U tensorflow
pip install -U keras
モデルの保存をするときに,HDF5が必要らしいので一緒にインストール
pip install h5py
パーセプトロン&MNIST で実装
構文の確認なので,簡単なモデルを実装する
# encoding: utf-8

from keras.datasets import mnist
from keras.models import Sequential
from keras.layers.core import Dense, Activation
from keras.utils import np_utils

# kerasのMNISTデータの取得

(X_train, y_train), (X_test, y_test) = mnist.load_data()


# 配列の整形と,色の範囲を0-255 -> 0-1に変換
X_train = X_train.reshape(60000, 784) / 255
X_test = X_test.reshape(10000, 784) / 255


# 正解ラベルをダミー変数に変換
y_train = np_utils.to_categorical(y_train)
y_test = np_utils.to_categorical(y_test)

# ネットワークの定義

model = Sequential([
        Dense(512, input_shape=(784,)),
        Activation('sigmoid'),
        Dense(10),
        Activation('softmax')
        ])

# 損失関数,最適化アルゴリズムなどの設定 + モデルのコンパイルを行う
model.compile(loss='categorical_crossentropy', optimizer='sgd', metrics=['accuracy'])

# 学習処理の実行 -> 変数histに進捗の情報が格納される
# validation_split=0.1 ---> 0.1(10%)の訓練データが交差検証に使われる
hist = model.fit(X_train, y_train, batch_size=200, verbose=1, epochs=3, validation_split=0.1)

# 予測
score = model.evaluate(X_test, y_test, verbose=1)
print("")
print('test accuracy : ', score[1])
これだけでMNISTを中間層1層のパーセプトロンが実装できる
最後のprintは以下のように出力される.
test accuracy : 0.8057
それと, model.evaluateの変数verboseに1を入れると以下のような学習の進捗を表示してくれる.
Epoch 2/3
  200/54000 [..............................] - ETA: 4s - loss: 1.8869 - acc: 0.7250
 1000/54000 [..............................] - ETA: 3s - loss: 1.8868 - acc: 0.6890
 2000/54000 [>.............................] - ETA: 3s - loss: 1.8867 - acc: 0.6865
 3000/54000 [>.............................] - ETA: 3s - loss: 1.8813 - acc: 0.6877
 3800/54000 [=>............................] - ETA: 3s - loss: 1.8776 - acc: 0.6847
 4600/54000 [=>............................] - ETA: 3s - loss: 1.8705 - acc: 0.6907
 ...
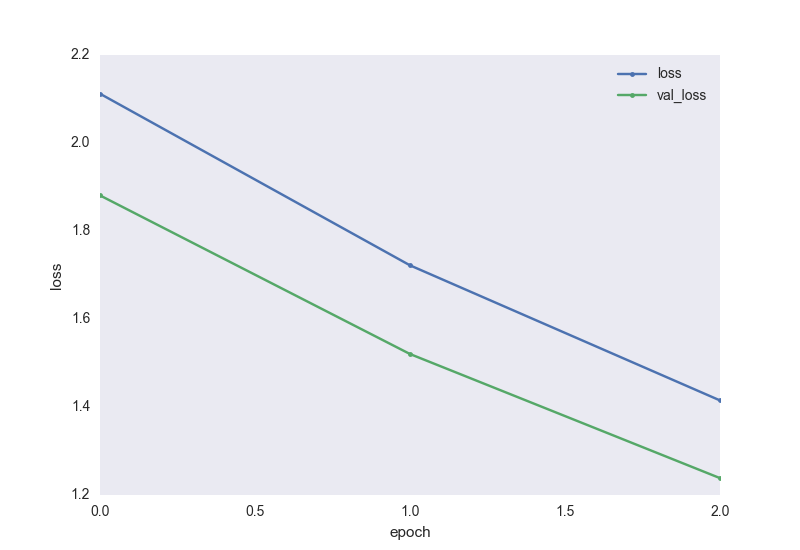
推移のプロット
model.fit()の返り値を出力を変数に格納すると学習過程のパラメータの推移をプロットできる.
先ほどのコードでは,変数"hist"に格納している.
Loss
import matplotlib.pyplot as plt
loss = hist.history['loss']
val_loss = hist.history['val_loss']

# lossのグラフ
plt.plot(range(3), loss, marker='.', label='loss')
plt.plot(range(3), val_loss, marker='.', label='val_loss')
plt.legend(loc='best', fontsize=10)
plt.grid()
plt.xlabel('epoch')
plt.ylabel('loss')
plt.show()
Accuracy
acc = hist.history['acc']
val_acc = hist.history['val_acc']

# accuracyのグラフ
plt.plot(range(3), acc, marker='.', label='acc')
plt.plot(range(3), val_acc, marker='.', label='val_acc')
plt.legend(loc='best', fontsize=10)
plt.grid()
plt.xlabel('epoch')
plt.ylabel('acc')
plt.show()
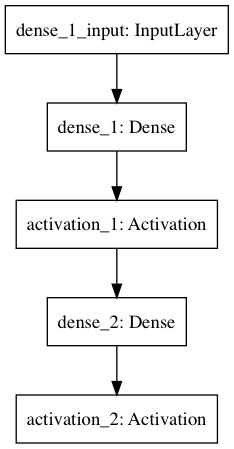
ネットワークの可視化
Kerasはplot_model()を使うと簡単にネットワークモデルの簡約図が作成できる
from keras.utils import plot_model
plot_model(model, to_file='./model.png')
GitHub
Conclusion
Kerasのおかげで,非常に簡単にNeuralNetworkを構築することができた.
今後,CNNやRNNを実装していきます.