この記事では React+D3 アプリの簡単な作り方を説明します。React や D3 については【関連記事】を参照してください。記事の全体は【古い記事】のリライトの側面もありますが、React がかなり更新されているので新記事として読んでいただければと思います。
【関連記事】
React 再入門 (React hook API) - Qiita
D3 v7 入門 - Enter / Update / Exit - Qiita
D3 v7 応用 - Enter / Update / Exit - Qiita
D3 v7 グラフ - d3-scale、d3-axis、d3-shape - Qiita
React+D3 アプリ作成入門 - Qiita
D3 v7 棒グラフのいろいろ - Qiita
D3 v7 都道府県別人口の treemap - Qiita
【古い記事】
React+D3.jsアプリ作成の基本 - Qiita
React+D3.jsアプリ作成の基本は React で作った DOM 要素を、D3 関数に渡してチャートを描くことです。DOM 要素を作り出すまでは React の仕事で、その DOM 要素をもらってチャート描くのは D3 の仕事です。
- React における DOM 要素の取得
<svg ref={ref} />
- D3 に DOM 要素を渡す
useEffect(() => {
  const svgElement = d3.select(ref.current)
  ---
}
ref は Reactが実 DOM を作成した後に利用できるようになります。つまり Virtual DOM の間は存在しないものです。ですから ref を利用する関数は、useEffect 関数の中で使用される必要があります。(古い React では componentDidMount や componentDidUpdate などのライフサイクルフックから呼ばれる必要がありました。)
以下に3つのサンプルコードを示します。
1.サンプルコード1
Reactコンポーネントの中に D3 の SVG circle を描く例です。
create-react-app react-svg
cd react-svg
npm start
import { useRef, useEffect } from 'react';
import * as d3 from "https://cdn.jsdelivr.net/npm/d3@7/+esm";

export default function App() {
  return (
    <div>
      <h2>React D3.js SVG circle</h2>
      <Circle />
    </div>
  )
}

const Circle = () => {
  const ref = useRef()

  useEffect(() => {
    const svgElement = d3.select(ref.current)
    svgElement.append("circle")
      .attr("cx", 150)
      .attr("cy", 70)
      .attr("r",  50)
  }, [])

  return (
    <svg
      ref={ref}
    />
  )
}
2.サンプルコード2
React のコンポーネントの中に D3 のチャートを描く例です。d3-scale、d3-axis、d3-shape を利用します。D3 コードの詳細は以下のリンクにあります。
D3 v7 グラフ - d3-scale、d3-axis、d3-shape -Qiita
create-react-app react-d3
cd react-d3
npm start
<!DOCTYPE html>
<html lang="jp">
  <head>
    <meta charset="utf-8">
    <style>
        .line{
            fill: none;
            stroke: steelblue;
            stroke-width: 2;
        }
    </style>
    <title>React D3.js App</title>
  </head>
  <body>
    <div id="root"></div>
  </body>
</html>
import React from 'react';
import ReactDOM from 'react-dom/client';
import './index.css';
import App from './App';
import reportWebVitals from './reportWebVitals';

const root = ReactDOM.createRoot(document.getElementById('root'));
root.render(
  <React.StrictMode>
    <App />
  </React.StrictMode>
);

// If you want to start measuring performance in your app, pass a function
// to log results (for example: reportWebVitals(console.log))
// or send to an analytics endpoint. Learn more: https://bit.ly/CRA-vitals
reportWebVitals();
import LineChart from './LineChart'
const data =[
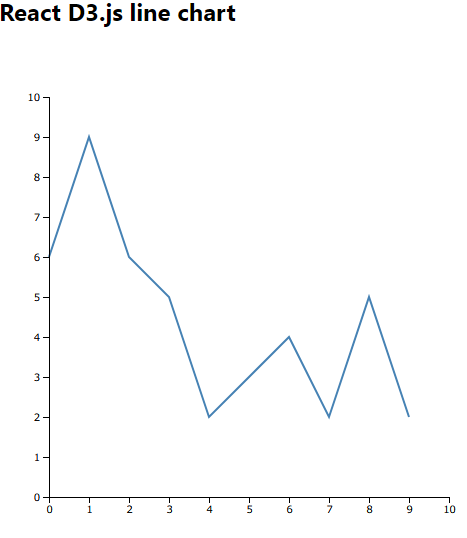
[{x: 0, y: 6},{x: 1, y: 9},{x: 2, y: 6},
{x: 3, y: 5},{x: 4, y: 2},{x: 6, y: 4},
{x: 7, y: 2},{x: 8, y: 5},{x: 9, y: 2}]
];
export default function App() {
return (
<div>
<h2>React D3.js line chart</h2>
<LineChart data={data} />
</div>
)
}
import { useRef, useEffect } from 'react';
import * as d3 from "https://cdn.jsdelivr.net/npm/d3@7/+esm";

function LineChart ({data}) {
  const ref = useRef(null);

  const createLineChart = () => {

    const width = 500,
          height = 500,
          margin = 50,
          x = d3.scaleLinear()
                .domain([0, 10])
               .range([margin, width - margin]),
          y = d3.scaleLinear()
                .domain([0, 10])
                .range([height - margin, margin]);

    const xStart = () => margin
    const yStart = () => height - margin
    const yEnd = () => margin
    const quadrantWidth = () => width - 2 * margin
    const quadrantHeight = () => height - 2 * margin


     //   d3.range(10).map(  (i) => { return {x: i, y: Math.sin(i) + 5}; })

    const line = d3.line()
            .x((d) => x(d.x))
            .y((d) => y(d.y));

    const svg = d3.select(ref.current);

    svg.attr("height", height)
       .attr("width", width);

     svg.selectAll("path")
            .data(data)
        .enter()
            .append("path")
            .attr("class", "line")
            .attr("d", (d) => line(d));


    const renderAxes = (svg) => {
        const xAxis = d3.axisBottom()
                        .scale(x.range([0, quadrantWidth()]))
                        .scale(x);

        const yAxis = d3.axisLeft()
                        .scale(y.range([quadrantHeight(), 0]))
                        .scale(y);

        svg.append("g")
            .attr("class", "axis")
            .attr("transform", () => {
                return "translate(" + xStart()
                    + "," + yStart() + ")";
            })
            .call(xAxis);

        svg.append("g")
            .attr("class", "axis")
            .attr("transform", () => {
                return "translate(" + xStart()
                    + "," + yEnd() + ")";
            })
            .call(yAxis);
    }

    renderAxes(svg);
  }


  useEffect(() => {
    createLineChart();
  });

  return <svg ref={ref}> </svg>
}

export default LineChart
3.サンプルコード3
React のコンポーネントの中に D3 のチャートを描く例です。Enter / Update / Exit を利用して、時々刻々遷移していくグラフを実装しています。D3 コードの詳細は以下のリンクにあります。
D3 v7 応用 - Enter / Update / Exit -Qiita
create-react-app react-live
cd react-live
npm start
<!DOCTYPE html>
<html lang="en">
  <head>
    <meta charset="utf-8" />
    <title>React D3 Live App</title>
    <link rel="stylesheet" type="text/css" href="./styles.css"/>
  </head>
  <body>
    <div id="root"></div>
  </body>
</html>
import LiveChart from './LiveChart'

export default function App() {
  return (
    <div>
      <LiveChart />
    </div>
  )
}
import { useRef, useEffect } from 'react';
import * as d3 from "https://cdn.jsdelivr.net/npm/d3@7/+esm";

function LiveChart ({data}) {
  const ref = useRef(null);

  const createLiveChart = () => {
    const push = (data) => {
        data.push({
            id: ++id,
            value: Math.round(Math.random() * chartHeight)
        })
    }

    const barLeft = (i) => i * (30 + 2)

    const barHeight = (d) => d.value

    let id= 0,
        data = [],
        duration = 500,
        chartHeight = 100,
        chartWidth = 680;

    for(let i = 0; i < 20; i++) push(data);

    const render = (data) => {
        // let selection = d3.select("body").selectAll("div.v-bar")
        let selection = d3.select(ref.current).selectAll("div.v-bar")
                .data(data, (d) => d.id); // ★(1)
                //.data(data); // ★(2)

        // enter
        selection.enter()
                .append("div")
                .attr("class", "v-bar")
                .style("z-index", "0")
                .style("position", "fixed")
                .style("top", chartHeight + "px")
                .style("left", (d, i) => barLeft(i+1) + "px")
                .style("height", "0px") // 最初はゼロ、2秒後にupdateで正しい値にtransitionする
                .append("span");

        // update
        selection
                .transition().duration(duration)
                .style("top", (d) => chartHeight - barHeight(d) + "px")
                .style("left", (d, i) => barLeft(i) + "px")
                .style("height", (d) => barHeight(d) + "px")
                .select("span")
                .text((d) => d.value);

        // exit
        selection.exit()
                .transition().duration(duration)
                .style("left", (d, i) => barLeft(-1) + "px")
                .remove();
    }

    setInterval(() => {
        data.shift(); //★削除して追加
        push(data);   //★(1)の場合は右から左へ遷移するアニメーション効果、
                      //★(2)の場合は単なる上下の動作
        render(data);
    }, 2000);

    render(data);

    d3.select("body")
        .append("div")
        .attr("class", "baseline")
        .style("position", "fixed")
        .style("z-index", "1")
        .style("top", chartHeight + "px")
        .style("left", "0px")
        .style("width", chartWidth + "px");
  }


  useEffect(() => {
      createLiveChart();
  });

  return <div ref={ref}> </div>
}

export default LiveChart
React-d3-live サンプル pic.twitter.com/JysXhQb8aP
— kintaro-baby (@9308kintaro) January 11, 2024
今回は以上です。