D3 で 都道府県罰人口の Treemap を描いてみます。
データは以下のサイトからCSVをダウンロードして使います。
社会・人口統計体系 - e-Stat(政府統計の総合窓口)
【関連記事】
React 再入門 (React hook API) - Qiita
D3 v7 入門 - Enter / Update / Exit - Qiita
D3 v7 応用 - Enter / Update / Exit - Qiita
D3 v7 グラフ - d3-scale、d3-axis、d3-shape - Qiita
React+D3 アプリ作成入門 - Qiita
D3 v7 棒グラフのいろいろ - Qiita
D3 v7 都道府県別人口の treemap - Qiita
【オブジェクト指向について、の反省点】
前に、今回と同等のプログラムを書いた。
埼玉県の市町村別人口をD3.jsのツリーマップで表現してみる - Qiita
今回参考にしようと思い読み返した。自分で書いたコードなのに全然ロジックを追えませんでした。理由は、オブジェクト指向的な書き方をしていたからです。当時読んでいた参考書をお手本にして書いたのですが、ハッキリ言ってリーダビリティ・ゼロのコードです。この記事、直ぐにでも消したいのですが、自分への見せしめにこのまま放置しようと思います。
もちろん自分の力量不足が大きいのですが、やはりオブジェクト指向はダメだな、と思いました。もちろん使うべき環境で使えば良いのでしょうがね。
D3 による都道府県別人口の treemap
このグラフ表示のプログラムは、より大規模なアプリの中の1画面であることを想定しています。React プログラムの中で D3.js を使うことを前提にします。
まずは React のプロジェクトを作成します。
create-react-app react-treemap
cd react-fetch
npm start
取得データ(CSV)
year,region,area,item,pop
2022年度,北海道,北海道,,"5,140,000"
2022年度,東北,青森県,,"1,204,000"
2022年度,東北,岩手県,,"1,181,000"
2022年度,東北,宮城県,,"2,280,000"
2022年度,東北,秋田県,,"930,000"
2022年度,東北,山形県,,"1,041,000"
2022年度,東北,福島県,,"1,790,000"
2022年度,関東,茨城県,,"2,840,000"
2022年度,関東,栃木県,,"1,909,000"
2022年度,関東,群馬県,,"1,913,000"
2022年度,関東,埼玉県,,"7,337,000"
2022年度,関東,千葉県,,"6,266,000"
2022年度,関東,東京都,,"14,038,000"
---
都道府県別人口の treemap の完成マップ
完全ソース
import { useRef, useEffect } from 'react';
import * as d3 from "https://cdn.jsdelivr.net/npm/d3@7/+esm";

export default function App() {

  return (
    <div>
      <h2>React D3.js SVG TreeMap Chart</h2>
      <Chart />
    </div>
  )
}

const Chart = () => {
  const ref = useRef()
  const width = 1500
  const height = 800

  useEffect(() => {
    const fetchData = async () => {

      //1-1.CSV データの読み込み(csv 関数)
      const tdata = await d3.csv("test.csv")
      const csv =
        tdata.map( (d) => { return {...d, value:parseInt(d.pop.replace(/,/g, '')) }} );
      console.log(csv)

      //1-2.CSVデータのグループ化(group関数)
      let gdata = d3.group(csv, (d) => d.region) // gdata is a MAP
      console.log(gdata)

      //1-3.データの階層オブジェクト化と root node 構築(hierarchy 関数)
      let children=[];
      gdata.forEach((value, key) => {
          let child={};
          child.name=key;           // ** "key" -> "name" 変更
          child.children = value;  // ** "values" -> "children" 変更
          children.push(child);
      });
      let data = {};
      data.name="地域別人口マップ";
      data.children=children;
      const root = d3.hierarchy(data).sum(d => d.value).sort((a, b) => b.value - a.value)
      console.log(root)

      //1-4.レイアウト情報の追加(treemap 関数)
      const treemap = d3.treemap()
        //.tile(tile) // e.g., d3.treemapSquarify
        .size([width, height])
        .padding(1)
        .round(true)

      treemap(root)
      const leaves = root.leaves();  // leaves : D3 のデータセット
      console.log(root)
      console.log(leaves)

    // Specify the color scale.
    //const color = d3.scaleOrdinal(data.children.map(d => d.area), d3.schemeTableau10);

    //2-1.SVG に g 要素の追加
    let g = d3.select("svg")
      .selectAll(".node")
      .data(leaves)
      .enter()
      .append("g")
      .attr("class", "node")
      .attr("transform", function(d) { return "translate(" + d.x0 + "," + (d.y0) + ")"; });
    console.log(g)

    //2-2.g 要素に rect を追加
    g.append("rect")
      .style("width", function(d) { return d.x1 - d.x0; })
      .style("height", function(d) { return d.y1 - d.y0; })
      .style("fill", function(d) {
        while(d.depth > 1) d = d.parent;
        return d3.schemeCategory10[parseInt(d.value % 7)];
        //return color(d.data.area);
      })
      .style("opacity", 0.6)

    //2-3.g 要素に text を追加
    g.append("text")
      .attr("text-anchor", "start")
      .attr("x", 5)
      .attr("dy", 30)
      .attr("font-size", "14px")
      .attr("class", "node-label")
      .text(function(d) { return d.data.area + "\n" + d.data.value; });
    }

    fetchData();
  }, [])

  return (
    <>
      <svg width={width} height={height}
        ref={ref}
      />
     <h1>Footer</h1>
    </>
  )
}
1.Data の準備
まずは D3 のグラフで扱うための Data の準備を行います。
Treemap で扱う Dtat にはレイアウト情報( x0,y0, x1, y1 )が必要です。
以下の手順で行います。
- 1-1.CSV データの読み込み(csv 関数)
- 1-2.CSVデータのグループ化(group関数)
- 1-3.データの階層オブジェクト化と root node 構築(hierarchy 関数)
- 1-4.レイアウト情報の追加(treemap 関数)
1-1.CSV データの読み込み(csv 関数)
まずは test.csv を読み込みます。
この時、人口の pop 属性を整数変換して value 属性に保存しておきます。
    const fetchData = async () => {
      //1-1.CSV データの読み込み(csv 関数)
      const tdata = await d3.csv("test.csv")
      const csv =
        tdata.map( (d) => { return {...d, value:parseInt(d.pop.replace(/,/g, '')) }} );
      console.log(csv)
      ---
    }
ここで async/await 構文で非同期処理を扱っていることに注意してください。
d3-fetch
d3 の d3-fetch モジュールを使って,以下のように CSV ファイルをパースして読み込むことができます。
const data = await d3.csv("hello-world.csv"); // [{"Hello": "world"}, …]
1-2.CSVデータのグループ化(group関数)
読み込んだ CSV データを、region属性でグループ化する。
      //1-2.CSVデータのグループ化(group関数)
      let gdata = d3.group(csv, (d) => d.region) // gdata is a MAP
      console.log(gdata)
group(iterable, ...keys)
イテラブルを指定したキーでグループ化したものを MAP として返す。
const species = d3.group(penguins, (d) => d.species);
species.get("Adelie") // Array(152)
1-3.データの階層オブジェクト化と root node 構築(hierarchy 関数)
グループ化されたデータを、hierarchy 関数の引数となる、階層オブジェクトに変換します。
次に hierarchy 関数で root node を構築します。
      //1-3.データの階層オブジェクト化と root node 構築(hierarchy 関数)
      let children=[];
      gdata.forEach((value, key) => {
          let child={};
          child.name=key;           // ** "key" -> "name" 変更
          child.children = value;  // ** "values" -> "children" 変更
          children.push(child);
      });
      let data = {};
      data.name="地域別人口マップ";
      data.children=children;
      const root = d3.hierarchy(data).sum(d => d.value).sort((a, b) => b.value - a.value)
      console.log(root)
hierarchy(data, children)
Examples · Source · Constructs a root node from the specified hierarchical data. The specified data must be an object representing the root node. For example:
const data = {
  name: "Eve",
  children: [
    {name: "Cain"},
    {name: "Seth", children: [{name: "Enos"}, {name: "Noam"}]},
    {name: "Abel"},
    {name: "Awan", children: [{name: "Enoch"}]},
    {name: "Azura"}
  ]
};

const root = d3.hierarchy(data);
root node を確認します。
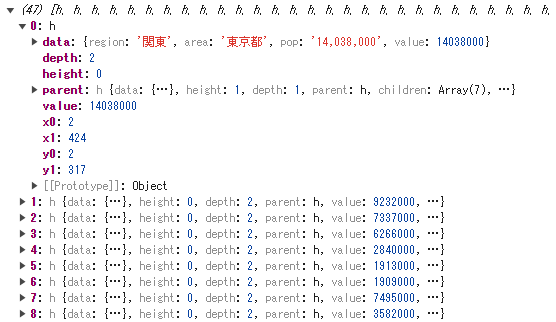
階層化されたデータなのでトップレベルからレベル3まで見ていきます。
-
レベル1
トップレベルは data=地域別人口マップ となっています。
children が9個ぶら下がっています。
-
レベル2
レベル1の最初の chldren を見ます。レベル2になります。
data=関東 となっています。7個の children がぶら下げっています。
-
レベル3
レベル2の最初の chldren を見ます。レベル3になります。
data=関東,東京都 となっています。children はゼロ個です。
1-4.レイアウト情報の追加(treemap 関数)
      //1-4.レイアウト情報の追加(treemap 関数)
      const treemap = d3.treemap()
        //.tile(tile) // e.g., d3.treemapSquarify
        .size([width, height])
        .padding(1)
        .round(true)

      treemap(root)
      const leaves = root.leaves();
      console.log(root)
      console.log(leaves)
treemap()
Source · Creates a new treemap layout with default settings.
treemap(root)
Source · Lays out the specified root hierarchy, assigning the following properties on root and its descendants:
node.x0 - the left edge of the rectangle
node.y0 - the top edge of the rectangle
node.x1 - the right edge of the rectangle
node.y1 - the bottom edge of the rectangle
You must call root.sum before passing the hierarchy to the treemap layout. You probably also want to call root.sort to order the hierarchy before computing the layout.
- treemap(root) によって root node には レイアウト情報である x0, y0, x1, y1 の属性が追加されます。
- root.leaves() は root node のツリー構造の葉要素からなる配列で、この場合都道府県の配列となります。
2.D3 Enter / Update / Exit
- 2-1.SVG に g 要素の追加
- 2-2.g 要素に rect を追加
- 2-3.g 要素に text を追加
2-1.SVG に g 要素の追加
selection オブジェクトg を順を追ってみていきます。
    //2-1.SVG に g 要素の追加
    let g = d3.select("svg")
      .selectAll(".node")
      .data(leaves)
    console.log(g)
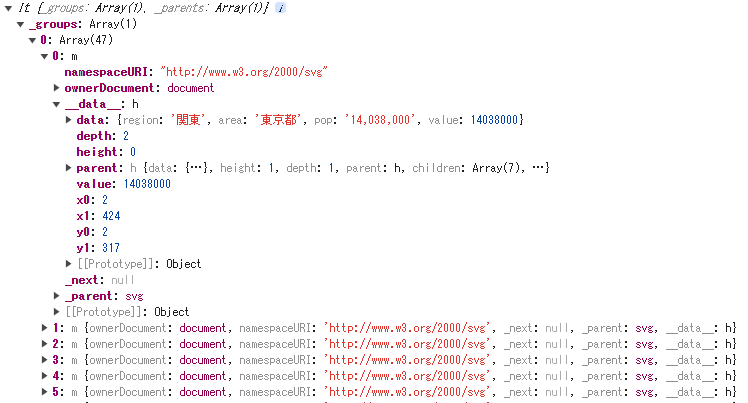
- data(leaves) メソッドで サイズ47 の配列 _eneter が作成されます。
  //2-1.SVG に g 要素の追加
    let g = d3.select("svg")
      .selectAll(".node")
      .data(root.leaves())
      .data(leaves)
      .enter()
    console.log(g)
    //2-1.SVG に g 要素の追加
    let g = d3.select("svg")
      .selectAll(".node")
      .data(leaves)
      .enter()
      .append("g")
      .attr("class", "node")
      .attr("transform", function(d) { return "translate(" + d.x0 + "," + (d.y0) + ")"; });
    console.log(g)
-
_groups プロパティに、append("g") で DOM 要素 (g タグ)を割り当てます。
-
その g タグに .attr('transform', 'translate(X, Y)') 属性を指定しポジションを動かします。後で、このポジションに rect と text を描きます。
-
DOM をみると、svgタグの中に47個の g タグが追加されています。.attr('transform', 'translate(X, Y)') の属性が指定されていることに注目します。
再マウント時
React での開発時はデフォルトで必ず再マウントが行われます。
再マウント時は、svg.selectAll('.node') が空ではなくデータが全て DOM 要素の g.node にバインドされます。つまり selection オブジェクトの _enter は空で、最初から _groups に要素が入っています。結論として再マウント時は、selection.enter() が空なのでそれ以降の操作は生じません。変数 g は空です。
    //2-1.SVG に g 要素の追加
    let g = d3.select("svg")
      .selectAll(".node")
      .data(leaves)
      .enter()
      .append("g")
      .attr("class", "node")
      .attr("transform", function(d) { return "translate(" + d.x0 + "," + (d.y0) + ")"; });
変数 g は空なので、如何に続く rect と text の追加も行われませんが、最初に作られた DOM がそのまま表示jされます。
2-2.g 要素に rect を追加
    //2-2.g 要素に rect を追加
    g.append("rect")
      .style("width", function(d) { return d.x1 - d.x0; })
      .style("height", function(d) { return d.y1 - d.y0; })
      .style("fill", function(d) {
        while(d.depth > 1) d = d.parent;
        return d3.schemeCategory10[parseInt(d.value % 7)];
        //return color(d.data.area);
      })
      .style("opacity", 0.6)
rect タグ
SVGで四角を描画するにはrectタグを使用します。
rectの開始位置、原点は左上です。
| rectタグ属性 | 説明 |
|---|---|
| x | 開始x座標 |
| y | 開始y座標 |
| width | 横幅 |
| height | 縦幅 |
| fill | 長方形の中の色 |
| stroke-width | 線の太さ |
| storke | 線の色 |
- 以下のように、g DOM 要素の下に rect タグを追加し、style を指定します。
2-3.g 要素に text を追加
    //2-3.g 要素に text を追加
    g.append("text")
      .attr("text-anchor", "start")
      .attr("x", 5)
      .attr("dy", 30)
      .attr("font-size", "14px")
      .attr("class", "node-label")
      .text(function(d) { return d.data.area + "\n" + d.data.value; });
- rect タグと同じように、g DOM 要素の下に text タグを追加し、attr を指定します。
今回は以上です。


