Pythonで「中心極限定理」を確かめてみる
母平均の区間推定で「中心極限定理」を使う
中心極限定理
統計において正規分布は重要な役割を果たしていますが、それは以下のような中心極限定理が成り立つからです。これにより、nを十分大きい数字として、n個の標本を取り出してその平均を調べる時、正規分布の特性を適用して調べることができます。
\begin{align}
\\
&平均値\mu、分散\sigma^2 の分布に従う独立したn個の確率変数X_1、X_2、...、X_n について、\\
&次のように\bar{X}を定義する。\\
\\
&\bar{X} = \frac{X_1 + X_2 + ... + X_n}{n}\\
&nが大きいとき、この確率変数\bar{X}は平均値\mu、分散\frac{\sigma^2}{n}の正規分布に従う。\\
&\qquad \qquad  \qquad \qquad  \qquad \qquad  \qquad \qquad \qquad  \qquad \qquad \qquad \qquad \qquad \qquad \qquad \qquad  \qquad  \\
\end{align}
例:一様分布の平均を正規分布で近似する
Juliaで学ぶ確率変数(5) - 正規分布(連続型)
Juliaで学ぶ確率変数(6) - 一様分布(連続型)
中心極限定理によって、次のことが言える
- n個の確率変数を取ってその平均を求める
- それを何回も繰り返せば、平均値(X)とその確率(Y)のグラフは正規分布で近似できる
以上のことを確かめるためにPythonプログラムを作ります。
プログラムの概要は以下の通りです。
- もととなる確率変数として、区間[0, 10]の一様分布を考えます。
n=10個の一様分布の平均を求めます。 - それを1000回繰り返し、同じ平均値の頻度(何回出現するか)をカウントします。
- 頻度を確率に変換して(1000で割って)、プロットします。
import numpy as np
import matplotlib.pyplot as plt
from decimal import Decimal

d={}
for i in range(1000):
    a=np.random.uniform(low=0.0,high=10, size=10)  # 任意の範囲の浮動小数点数
    b=np.mean(a)
    c=np.around(b, decimals=0)
    if c in d:
        d[c]=d[c]+1
    else:
        d[c]=1
ds = sorted(d.items(), key=lambda x:x[0])
print(ds)
xs=[x for (x,y) in  ds]
ys=[y/1000 for (x,y) in  ds]
print(xs)
print(ys)
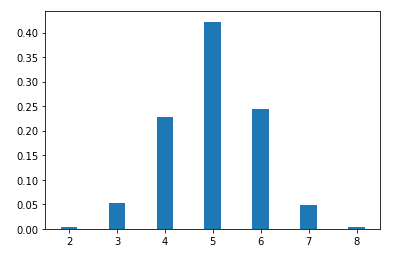
plt.bar(xs, ys, 0.35, linewidth=0)
一応、プロットする数字を出力しました。
[(2.0, 3), (3.0, 52), (4.0, 227), (5.0, 422), (6.0, 245), (7.0, 48), (8.0, 3)]
[2.0, 3.0, 4.0, 5.0, 6.0, 7.0, 8.0]
[0.003, 0.052, 0.227, 0.422, 0.245, 0.048, 0.003]
なるほど、プロットしたグラフは正規分布に近いようです。
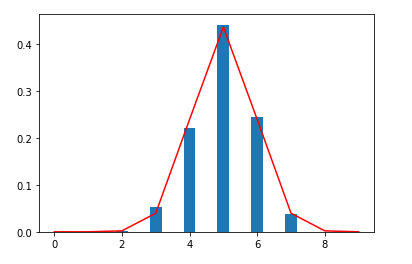
実際に正規分布で近似できているかを確認します。
中心極限定理の定理を使って、もとの一様分布の平均値と分散から、正規分布の平均値と分散を求めます。
- 平均値は一様分布と同じで5です。
- 分散は(10*10/12)/10です。
前のプログラムの最後尾に、以下のプログラムを追加して、再実行しプロットします。
from scipy.stats import norm

X = np.arange(0,10,1)
Y = norm.pdf(X, loc=5, scale=np.sqrt(10*10/12/10))
plt.plot(X,Y,color='r')
なるほど、確かに正規分布で近似できているようです。中心極限定理は魔法のような定理ですね!
今回は以上です。

