まとめ
こんなんできました。
例はt-SNEで低次元化したMNISTの散布図です。プロット上にマウスカーソルを持ってくると、そのプロットに相当する図が表示されます。

環境
- python 3.7.3 anaconda
- matplotlib 3.1.0
- numpy 1.16.4
- sklearn 0.21.2
まずはt-SNE処理
今回の記事はmatplotlibの使い方をメインにします。MNISTとか、t-SNEとかの説明は省略します。
ただどんな変数名でどうやって作ったかなどはプログラム依存ですので、そちらのコードを掲載します。
import numpy as np
from sklearn.datasets import fetch_openml
from sklearn.manifold import TSNE

width = 28
nskip = 35

mnist = fetch_openml("mnist_784", version=1)
mnist_img = mnist["data"][::nskip, :]
mnist_label = mnist["target"][::nskip]
mnist_int = np.asarray(mnist_label, dtype=int)

x_embedded = TSNE(n_components=2).fit_transform(mnist_img)
width は画像の幅。 nskip はサンプルの抽選確率(の逆数)です。このままではサンプルサイズが70000あってプロットとかには多すぎるので、1/35にして2000サンプルで行います。
その他の配列の詳細は以下の通り。
-
mnist_img:(2000, 784)次元の倍精度浮動小数点の配列。画像の生データで、画素値が 0 ~ 255 で格納されています。 -
mnist_label: (2000, )次元の配列。数字のラベルが文字列で格納。 -
mnist_int: (2000,) 次元の配列。mnist_labelを整数型にしたもの。
普通のプロット
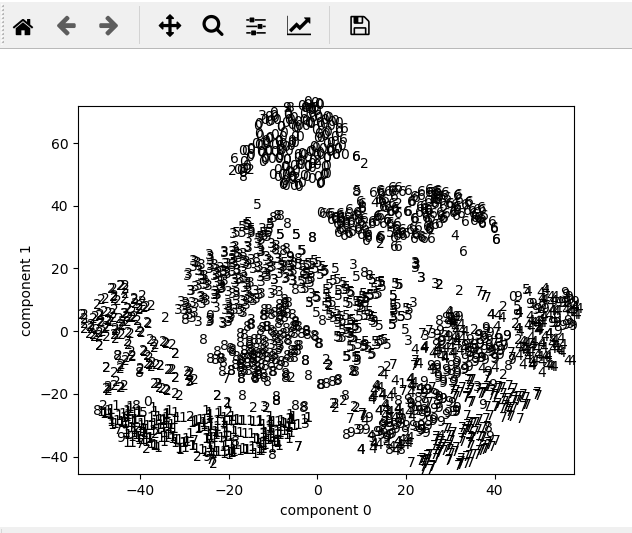
多分2番目に素直なプロットです。
    plt.xlim(x_embedded[:, 0].min(), x_embedded[:, 0].max())
    plt.ylim(x_embedded[:, 1].min(), x_embedded[:, 1].max())
    for x, label in zip(x_embedded, mnist_label):
        plt.text(x[0], x[1], label)
    plt.xlabel("component 0")
    plt.ylabel("component 1")
    plt.show()
数字をプロットしていくアイデアは
https://qiita.com/stfate/items/8988d01aad9596f9d586
に拠りました。
素直にscatterを使えば自動で調整してくれる x, y軸の範囲が、各点ごとに text を置いていく方法のせいで、自分で xlim, ylim を調整しなければなりません。
ですが、まあ数字ごとにグループを形成し、たまにノイズのように別の数字が混ざっているのが一目で分かります。
これをみて、
- やっぱり点はただの点にしたい。数字が重なると分かりにくくなる。
- だけど点の色、色と数字の対応を追いかけるのは面倒。
- なら気になる点にカーソルを持ってくれば詳細を表示するようにすればいいのでは
と考えました。ということで、まずはマウスオーバーでラベルを表示させてみましょう。
マウスオーバーでAnnotation表示
これはStackoverflowで答えを見つけました。
こちらのコードを今回のMNIST用に変更します。
    fig, ax = plt.subplots()
    cmap = plt.cm.RdYlGn

    sc = plt.scatter(x_embedded[:, 0], x_embedded[:, 1], c=mnist_int/10.0, cmap=cmap, s=3)
    annot = ax.annotate("", xy=(0,0), xytext=(20,20),textcoords="offset points",
                    bbox=dict(boxstyle="round", fc="w"),
                    arrowprops=dict(arrowstyle="->"))
    annot.set_visible(False)
    def update_annot(ind):
        i = ind["ind"][0]
        pos = sc.get_offsets()[i]
        annot.xy = pos
        text = mnist_label[i]
        annot.set_text(text)
        annot.get_bbox_patch().set_facecolor(cmap(int(text)/10))

    def hover(event):
        vis = annot.get_visible()
        if event.inaxes == ax:
            cont, ind = sc.contains(event)
            if cont:
                update_annot(ind)
                annot.set_visible(True)
                fig.canvas.draw_idle()
            else:
                if vis:
                   annot.set_visible(False)
                   fig.canvas.draw_idle()

    fig.canvas.mpl_connect("motion_notify_event", hover)

    plt.show()

まあGUIでよくあるイベントを利用したものです。
まず空白のAnnotation オブジェクトannotを作っておき、それの位置、内容などを更新する関数 update_annotを作っておきます。
hover 関数を fig.canvas.mpl_connect("motion_notify_event", hover) として登録、そのhoverの中でもしカーソルが何かしら点を指していたらannotを表示しつつupdate_annotを呼び出す、点を指していなければannotを非表示にするようにします。
scatterにおいて色を c=mnist_int/10.0とするために、わざわざラベルを整数にした mnist_int配列を準備しました。
これで上の動画のようなインタラクティブな散布図が描けます。
今回はさぼりましたが、どこかに色と数字の凡例を表示するとより親切だと思います。
ここまでやって、さらに不満点ができました。
「たとえば1のクラスタに入った7など、ノイズになっている点は果たしてどれくらい特殊な見た目なんだろう?もしかしたらアルゴリズムのせいで普通の点がノイズになっているかもしれない。なのでラベルだけでなく生データも確認したい。」
これの実現のためには、マウスオーバーで元の画像も表示させると良さそうです。
マウスオーバーで画像表示
アノテーションで画像を表示させるdemoが公式にありました。
こちらと先ほどのイベント登録を組み合わせます。
まず、先ほどはアノテーションはテキストだけだったのでAnnotationでよかったのですが、画像になると少々厄介で、
- まず画像を
OffsetImageというクラスオブジェクトに持たせ、 - それを
AnnotationBboxに持たせる
という2段階の操作が必要になります。まず必要になるクラスをimportします。
from matplotlib.offsetbox import OffsetImage, AnnotationBbox
必要なグラフオブジェクトの準備。
    fig, ax = plt.subplots()
    cmap = plt.cm.RdYlGn
その後、 OffsetImageを用意しますが、その際ダミー画像として0番目の画像を使います。
    img = mnist_img[0, :].reshape((width, width))
    imagebox = OffsetImage(img, zoom=1.0)
    imagebox.image.axes = ax
それをもとにAnnotationBboxを作ります。
    annot = AnnotationBbox(imagebox, xy=(0,0), xybox=(width,width),
                        xycoords="data", boxcoords="offset points", pad=0.5,
                        arrowprops=dict( arrowstyle="->", connectionstyle="arc3,rad=-0.3"))
    annot.set_visible(False)
    ax.add_artist(annot)
注意として、 xybox は annot のサイズではなく、アノテーションを付加する点 xy からの相対的な位置を示しています。
つづいて、プロットと画像の更新です。
    sc = plt.scatter(x_embedded[:, 0], x_embedded[:, 1], c=mnist_int/10.0, cmap=cmap, s=3)

    def update_annot(ind):
        i = ind["ind"][0]
        pos = sc.get_offsets()[i]
        annot.xy = (pos[0], pos[1])
        img = mnist_img[i, :].reshape((width, width))
        imagebox.set_data(img)
新しい画像データを imagebox に対しては更新していますが、 annot については更新処理は不要なようです。
あと、別に実験した感じでは、imgのサイズが変わっても動的に対応してくれていますので、様々なサイズがある場合でも別に追加する処理はないかと思います。
あとのイベント登録などは同じです。
    def hover(event):
        vis = annot.get_visible()
        if event.inaxes == ax:
            cont, ind = sc.contains(event)
            if cont:
                update_annot(ind)
                annot.set_visible(True)
                fig.canvas.draw_idle()
            else:
                if vis:
                    annot.set_visible(False)
                    fig.canvas.draw_idle()

    fig.canvas.mpl_connect("motion_notify_event", hover)

    plt.show()
一瞬しか表示されないので恐縮ですが、ノイズの点は確かに形が別の数字に近くて読み間違えそうな形であるのが分かりました。
終わり
まあ画像出力でやると意味のないテクニックですが、試行錯誤中は結構使えるんじゃないかなと。
今回の話で matplotlib においてオブジェクト描写を行う根源の抽象クラス Artist の存在を知りました。
おまけ コード全体
表示させたいプロット部分を、 if False: から if True: に変更してください。
複数を Trueにしたときの動作は確認していません。
ここをクリックして展開・折り畳み
import numpy as np
from sklearn.datasets import fetch_openml
from sklearn.manifold import TSNE
import matplotlib.pyplot as plt
from matplotlib.offsetbox import OffsetImage, AnnotationBbox

width = 28
nskip = 35

mnist = fetch_openml("mnist_784", version=1)
mnist_img = mnist["data"][::nskip, :]
mnist_label = mnist["target"][::nskip]
mnist_int = np.asarray(mnist_label, dtype=int)

x_embedded = TSNE(n_components=2).fit_transform(mnist_img)

# プロット点を対応する数字に
if True:
    plt.xlim(x_embedded[:, 0].min(), x_embedded[:, 0].max())
    plt.ylim(x_embedded[:, 1].min(), x_embedded[:, 1].max())
    for x, label in zip(x_embedded, mnist_label):
        plt.text(x[0], x[1], label)
    plt.xlabel("component 0")
    plt.ylabel("component 1")
    plt.show()
    exit()


fig, ax = plt.subplots()
cmap = plt.cm.RdYlGn

# プロット点をマウスオーバーでラベル表示
if False:
    sc = plt.scatter(x_embedded[:, 0], x_embedded[:, 1], c=mnist_int/10.0, cmap=cmap, s=3)
    annot = ax.annotate("", xy=(0,0), xytext=(20,20),textcoords="offset points",
                    bbox=dict(boxstyle="round", fc="w"),
                    arrowprops=dict(arrowstyle="->"))
    annot.set_visible(False)
    def update_annot(ind):
        i = ind["ind"][0]
        pos = sc.get_offsets()[i]
        annot.xy = pos
        text = mnist_label[i]
        annot.set_text(text)
        annot.get_bbox_patch().set_facecolor(cmap(int(text)/10))

    def hover(event):
        vis = annot.get_visible()
        if event.inaxes == ax:
            cont, ind = sc.contains(event)
            if cont:
                update_annot(ind)
                annot.set_visible(True)
                fig.canvas.draw_idle()
            else:
                if vis:
                   annot.set_visible(False)
                   fig.canvas.draw_idle()

    fig.canvas.mpl_connect("motion_notify_event", hover)

    plt.show()

# プロット点をマウスオーバーで画像表示
if False:
    img = mnist_img[0, :].reshape((width, width))
    imagebox = OffsetImage(img, zoom=1.0)
    imagebox.image.axes = ax

    sc = plt.scatter(x_embedded[:, 0], x_embedded[:, 1], c=mnist_int/10.0, cmap=cmap, s=3)
    annot = AnnotationBbox(imagebox, xy=(0,0), xybox=(width,width),
                        xycoords="data", boxcoords="offset points", pad=0.5,
                        arrowprops=dict( arrowstyle="->", connectionstyle="arc3,rad=-0.3"))
    annot.set_visible(False)
    ax.add_artist(annot)

    def update_annot(ind):
        i = ind["ind"][0]
        pos = sc.get_offsets()[i]
        annot.xy = (pos[0], pos[1])
        img = mnist_img[i, :].reshape((width, width))
        imagebox.set_data(img)

    def hover(event):
        vis = annot.get_visible()
        if event.inaxes == ax:
            cont, ind = sc.contains(event)
            if cont:
                update_annot(ind)
                annot.set_visible(True)
                fig.canvas.draw_idle()
            else:
                if vis:
                    annot.set_visible(False)
                    fig.canvas.draw_idle()

    fig.canvas.mpl_connect("motion_notify_event", hover)

    plt.show()