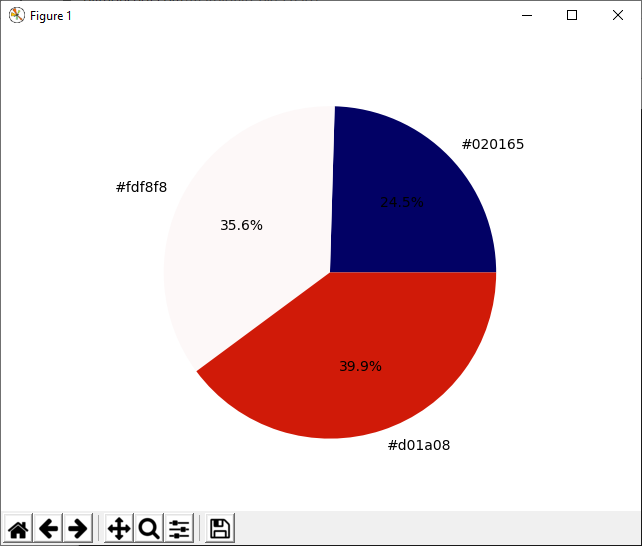
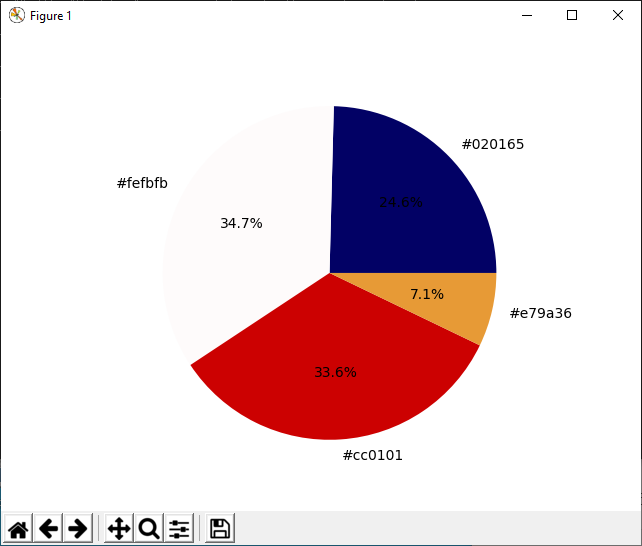
抽出対象
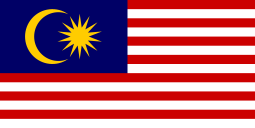
マレーシアの国旗を使用します。色の割合を目で判断する場合に、「赤」、「白」、「青」、「黄色」の多い順になると思います。
コードのイメージ図
画像はピクセルから成り立っています。そして、それぞれのピクセルは色(RGB)の情報を持っています。
下記はマレーシアの国旗の一部を切り取ったものとなります。ピクセル数は「50x50」です。
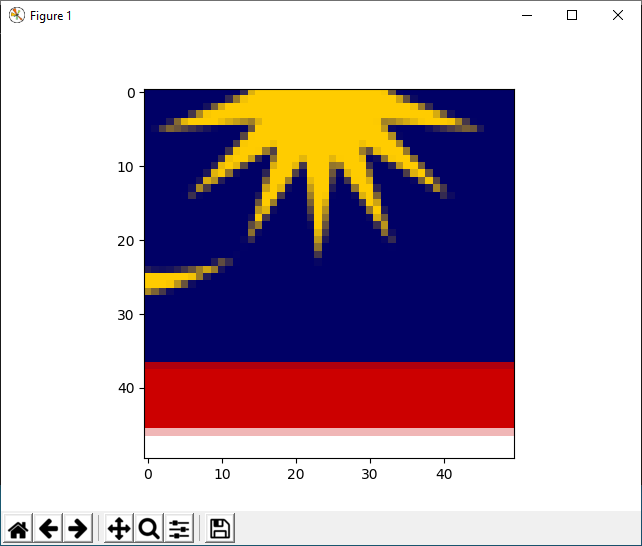
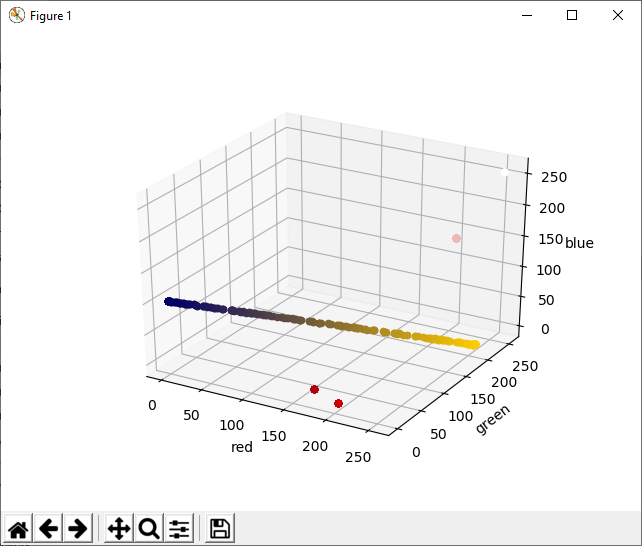
RGBの空間上にkmeansというクラスタリングの手法を用いて色の割合を導きだします。
コード
colorextract.py
import cv2
import matplotlib.colors as cs
import matplotlib.pyplot as plt
import numpy as np
from sklearn.cluster import KMeans

# set path to image
imgpath = 'malaysiaflag.png'
# set number of cluster for kmeans
clusterno = 3

# read image
img = cv2.imread(imgpath)
# convert bgr to rgb
img = cv2.cvtColor(img,cv2.COLOR_BGR2RGB)

# reshape img array
n_img = np.reshape(img,(img.shape[0]*img.shape[1],3))

# use kmeans to find cluster of color
clt = KMeans(n_clusters=clusterno)
clt.fit(n_img)

# get unique value of labels in kmeans
labels = np.unique(clt.labels_)

# find the pixel numbers of each color that is set by cluster number
hist,_ = np.histogram(clt.labels_,bins=np.arange(len(labels)+1))

# declare list to hold color to be used in chart
colors = []

# declare list to hold hex color code for labeling in chart
hexlabels = []

# get the main color
for i in range(clt.cluster_centers_.shape[0]):
  colors.append(tuple(clt.cluster_centers_[i]/255))
  hexlabels.append(cs.to_hex(tuple(clt.cluster_centers_[i]/255)))

# create pie chart for color
plt.pie(hist,labels=hexlabels,colors=colors,autopct='%1.1f%%')
plt.axis('equal')
plt.show()
