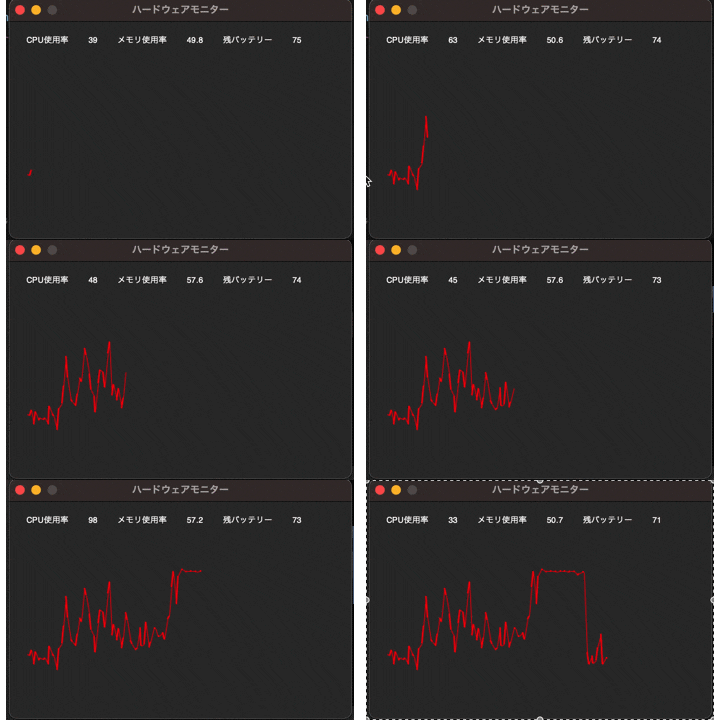
CPU使用率、CPU使用率グラフ、メモリ使用率、残バッテリーを表示するGUIアプリ
Mac想定です。
import PySimpleGUI as sg
import psutil
import threading
import time

sg.theme('SystemDefault')

#CPUとメモリの使用率,残バッテリーを取得
def getAllInfo():
    start = time.time()
    point_from=(0,0)
    while True:
        CPU = psutil.cpu_percent(interval=1)
        CPU = int(CPU)
        mem = psutil.virtual_memory()
        battery = psutil.sensors_battery().percent
        currentTime = time.time() - start
        currentTime = int(currentTime)

        window['-CPU-'].Update(CPU)
        window['-mem-'].Update(mem.percent)
        window['-battery-'].Update(battery)

        point_end=(currentTime,CPU)

        graph.draw_line(point_from, point_end, color='red', width=2)

        time.sleep(1)

        CPU = psutil.cpu_percent(interval=1)
        CPU = int(CPU)
        mem = psutil.virtual_memory()
        battery = psutil.sensors_battery().percent
        currentTime = time.time() - start
        currentTime = int(currentTime)

        point_from=(currentTime,CPU)

        graph.draw_line(point_from, point_end, color='red', width=1)

        graph.update()


graph = sg.Graph(canvas_size=(380,200),
                  graph_bottom_left=(0,0),
                    graph_top_right=(200,120))

# ウィンドウのレイアウト
layout = [ [sg.Text('CPU使用率'),sg.Text(key='-CPU-'),
            sg.Text('メモリ使用率'),sg.Text(key='-mem-'),
            sg.Text('残バッテリー'),sg.Text(key='-battery-'),],
            [graph],
        ]

# ウィンドウオブジェクトの作成
window = sg.Window('ハードウェアモニター', layout, finalize=True, auto_size_text=True, element_padding=(10,10))

threading.Thread(target=getAllInfo, daemon=True).start()

# イベントのループ
while True:
    # イベントの読み込み
    event, values = window.read()
    # ウィンドウの×ボタンが押されれば終了
    if event == sg.WIN_CLOSED:
        break

# ウィンドウ終了処理
window.close()
出来上がった物
拡張性
sg.theme('SystemDefault')
PySimpleGUIのテーマ指定。今回はSystemDefaultを指定
