pythonを使用してExcelファイルの操作を勉強しています。
本日の気づき(復習)は、CSVの読み込みとグラフ作成に関しての続きです。
pythonでExcelを操作するため、openpyxlというパッケージを使用しています。
部門,1月,2月,3月
商品A,600,700,800
商品B,4100,3800,4500
商品C,2900,1800,3000
商品D,800,900,1000
商品E,600,550,720
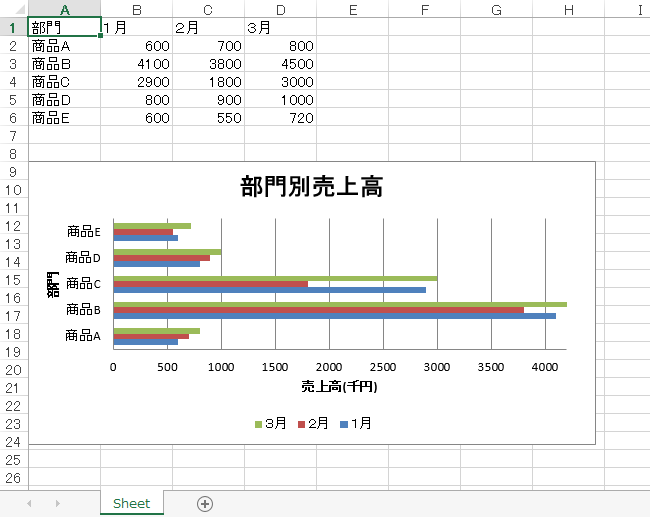
上記のようなCSVファイルを読み込み
この様な棒グラフを作り貼り付けたいです。
CSVを読み込み、張り付け
そちらを元に、グラフを作成します。
違いは縦棒グラフか横棒グラフかだけで
BarChartオブジェクトで使用できる属性の値を変更することで縦を横にします。
ここまでは前回と同じです。
ついでに他の属性も見つけたので主要そうなものを羅列します。
BarChartオブジェクトで使用できる属性
- type:縦棒グラフは'col'、横棒グラフは'bar'
- bar.x_axis.scaling.min:横軸の最小値
- bar.x_axis.scaling.max:横軸の最大値
- bar.y_axis.scaling.min:縦軸の最小値
- bar.y_axis.scaling.max:縦軸の最大値
- width:グラフの幅
- height:グラフの高さ
- varyColors:系列ごとの色を変える際は「True」
- legend.position:凡例項目の位置。右は'r'、左は'l'、上は't'、下は'b'
ここで気を付けないといけないのは
見た目的に横軸になっている値の属性は縦軸(y_axis)で設定する
ということです。
上手く表現できないのですが
先ず、縦軸でグラフの内容を設定してから、
横軸グラフになるように、90度傾ける。
と、表現すればいいのでしょうか。(前回に引き続き語彙力が欲しい)
最終的なコード
import pandas as pd
from openpyxl import Workbook
from openpyxl.chart import BarChart, Reference
from openpyxl.utils.dataframe import dataframe_to_rows

wb = Workbook()
ws = wb.active

# CSVファイル読込み
df = pd.read_csv('売上.csv', encoding='utf-8')
for row in dataframe_to_rows(df, index=None, header=True):
    # データを1行ずつ追加
    ws.append(row)

# 棒グラフを選択
bar = BarChart()

# 横棒グラフに設定
bar.type = 'bar'

# グラフのデータ範囲を設定
data = Reference(ws, min_col=2, min_row=1,
                 max_col=ws.max_column, max_row=ws.max_row)

# ラベルの範囲を設定
labels = Reference(ws, min_col=1, min_row=2, max_row=ws.max_row)

# グラフにデータを追加
bar.add_data(data, titles_from_data=True)

# 縦軸(グラフ上では横軸)のラベルを追加
bar.set_categories(labels)

# 縦軸(グラフ上では横軸)の最小値を設定
bar.y_axis.scaling.min = 0

# 縦軸(グラフ上では横軸)の最大値を設定
bar.y_axis.scaling.max = 4200

# グラフの幅
bar.width = 15

# グラフの高さ
bar.height = 7.5

# 凡例項目の位置を設定
bar.legend.position = 'b'

# 横軸(グラフ上では縦軸)タイトルを追加
bar.x_axis.title = '部門'

# 縦軸(グラフ上では横軸)タイトルを追加
bar.y_axis.title = '売上高(千円)'

# グラフのタイトルを追加
bar.title = '部門別売上高'

# 棒グラフをシートに追加
ws.add_chart(bar, 'A9')

wb.save('部門別売上_横棒グラフ.xlsx')
補足
bar.add_data(data, titles_from_data=True)でデータを追加してから
bar.set_categories(labels)で、ラベルを追加しないと
上手くラベルが反映されないようです。
