はじめに
前回の「標的型攻撃に対するJPCERT/CCのおすすめログ設定をElasticsearchで構築してみる」の「エンドポイントログ編(その1)」に続き「その2 - Winlogbeat/Elasticsearch編」です。
前回の記事で設定したSysmonによって収集されたWindowsの動作ログをWinlogbeatによりElasticsearchへ転送する設定を行っていきます。
作業内容は以下の通り。
- Winlogbeatをインストールおよび設定
- SysmonイベントログのマッピングをElasticsearchへ設定(Winlogbeat用のテンプレート)
- Sysmonイベントログを解析しやすいようにデータ型および形式を加工するパイプライン処理(Elasticsearc/ingestノード)を設定
(これまでの記事)
※本記事で利用するWinlogbeatやSysmonの設定例はこちらへ仮置きしておきます(今後、もう少しわかりやすい配置にする予定です)。
※ElasticsearchはUbuntu18.04上で構築しますので他のディストリビューションの場合にはファイルの配置場所などを読みかえてください。
※実際の環境で運用するには、ネットワーク設定、個々のソフトウェアのインストール/初期設定や認証/通信の暗号、冗長構成や負荷分散などで相応の設定が必要となります。それぞれ個別のドキュメントをご参照ください。本記事ではログ設定に関係する基本的なコンフィグレーションにフォーカスして記載します。
利用するソフトウェア
「エンドポイントログ編(その1- 概要/Sysmon)」を参照。
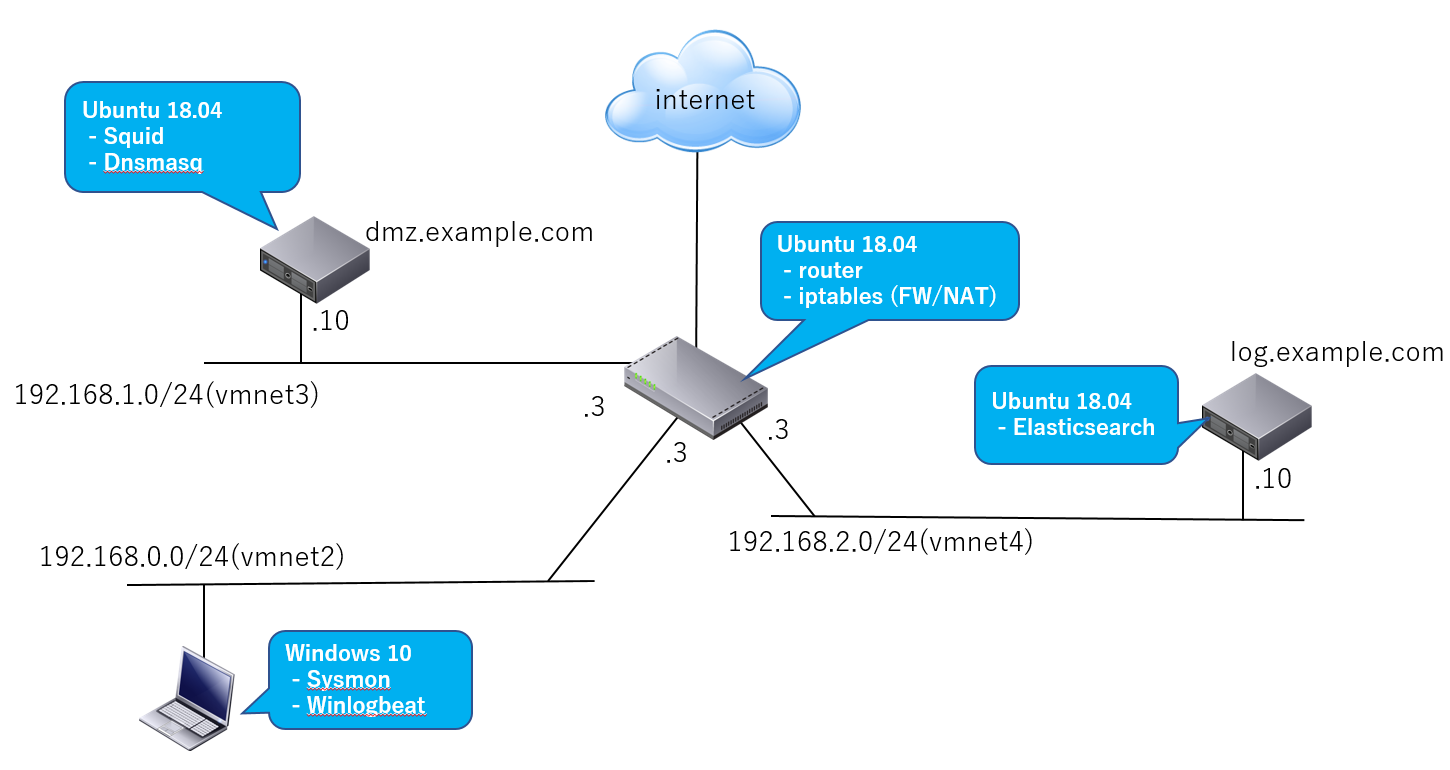
ネットワーク構成例
「エンドポイントログ編(その1- 概要/Sysmon)」より再掲載。
Sysmon+Winlogbeat+Elasticsearchの動作概要
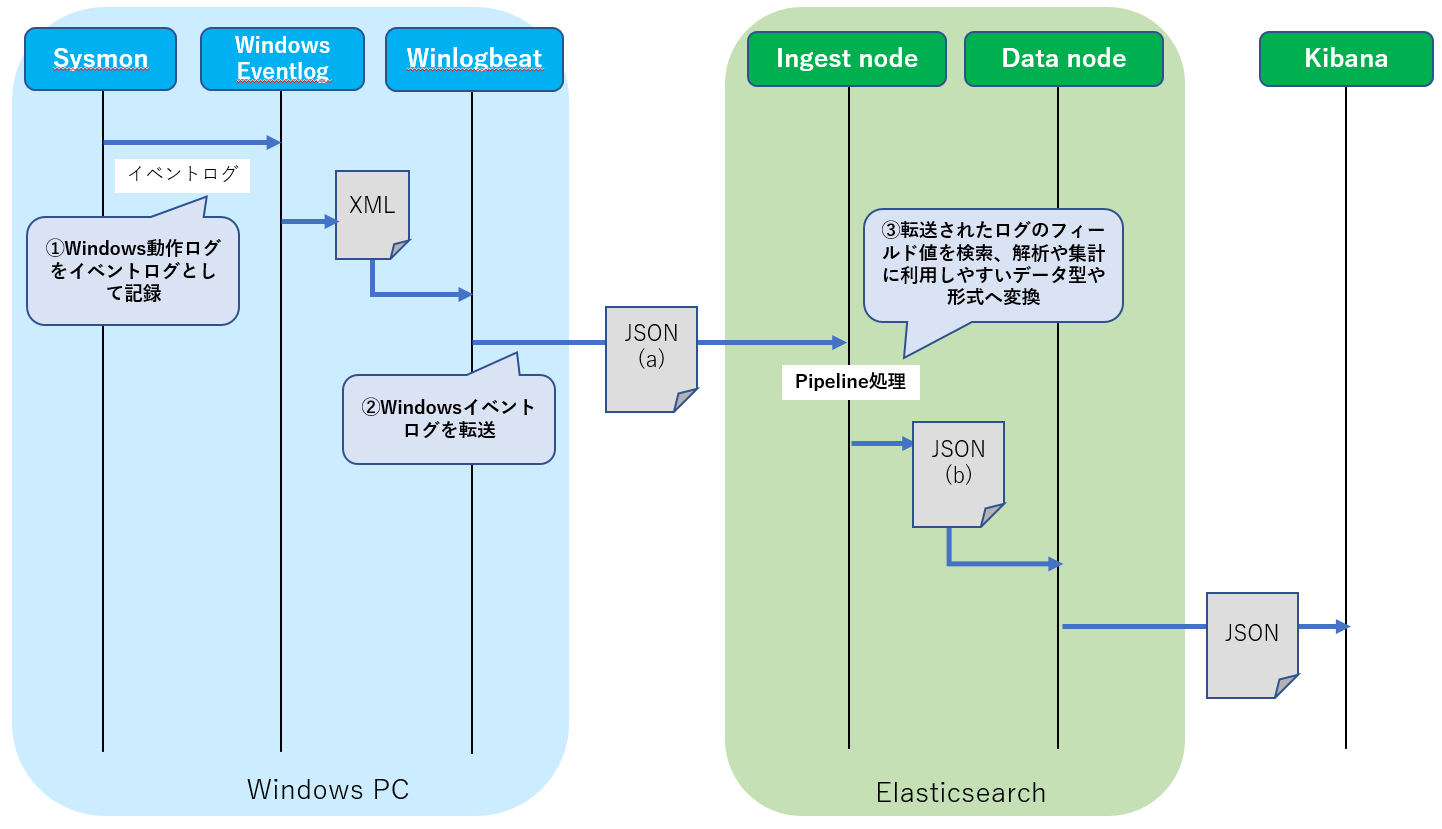
各WindowsイベントログはWinlogbeatによりそれぞれJSONドキュメントへ変換されてElasticsearchへ転送されます。転送されたJSON化されたイベントログの各フィールドは、さらにElasticsearch/Ingestノードのパイプライン処理により解析に利用しやすいデータ型や形式へ必要に応じて変換または加工されます(詳細は後述)。こうすることでKibanaで各情報単位で検索や集計したり、自作ツール等で扱いやすくなります。
Winlogbeatのインストールと初期設定
こちらの公式サイトからパッケージをダウンロードし、C:\Program Files配下へ解凍します。ここではWinlogbeat-6.6.0(64bit)を例に説明します。
インストール作業はPowershellのコンソールから行いますので起動しておきます(管理者として実行)。
まず解凍したフォルダ(C:\Program Files\winlogbeat-6.6.0-windows-x86_64)配下にあるwinlogbeat.ymlをテキストエディタ等で開き以下の設定を追加します。
- Winlogbeatの転送対象としてSysmonイベントログを追加
- 転送先Elasticsearchのアドレスを指定
# Winlogbeatが転送するWindowsイベントログとしてSysmonログを追加
winlogbeat.event_logs:
  - name: "Microsoft-Windows-Sysmon/Operational"

output.elasticsearch:
 #ログ転送先のElasticsearchのアドレスを指定
  hosts: ["log.example.com:9200"]
編集した設定ファイルをテスト
編集した設定内容をテストしておきます。
PS C:\WINDOWS\system32> cd C:\Program Files\winlogbeat-6.6.0-windows-x86_64

PS C:\Program Files\winlogbeat-6.6.0-windows-x86_64> .\winlogbeat.exe test config
Config OK
編集した設定ファイルでElasticsearchへネットワーク接続テスト
Elasticsearchへのネットワーク接続テストも行っておきましょう。
PS C:\Program Files\winlogbeat-6.6.0-windows-x86_64> .\winlogbeat.exe test output -e -d "*"
...
elasticsearch: http://log.example.com:9200...
  parse url... OK
  connection...
    parse host... OK
    dns lookup... OK
    addresses: 192.168.2.10
    dial up... OK
  TLS... WARN secure connection disabled
2019-05-28T22:32:05.655+0900    DEBUG   [elasticsearch] elasticsearch/client.go:697     ES Ping(url=http://log.example.com:9200)
2019-05-28T22:32:05.660+0900    DEBUG   [elasticsearch] elasticsearch/client.go:720     Ping status code: 200
2019-05-28T22:32:05.660+0900    INFO    elasticsearch/client.go:721     Connected to Elasticsearch version 6.6.0
  talk to server... OK
  version: 6.6.0
Winlogbeatをインストールし起動
次にこちらのドキュメントに従ってWinlogbeatをインストールします。
PowerShell.exeに-ExecutionPolicy UnRestrictedオプションを指定してインストールスクリプトを実行。
PS C:\Program Files\winlogbeat-6.6.0-windows-x86_64> PowerShell.exe -ExecutionPolicy UnRestricted -File .\install-service-winlogbeat.ps1
この時点ではまだWinlogbeatサービスは起動していませんので起動します。
PS C:\Program Files\winlogbeat-6.6.0-windows-x86_64> Start-Service winlogbeat
Winlogbeatの動作確認
log.example.com(Ubuntu 18.04)上でElasticsearchのインデクスが作成されていることを確認します。
$ curl http://log.example.com:9200/_cat/indices?v
health status index                       uuid                   pri rep docs.count docs.deleted store.size pri.store.size
yellow open   winlogbeat-6.6.0-2019.05.28 xxxxOy6kRNOOxUqxxxxxxxx   1      15468            0     11.9mb         11.9mb
そしてWindows 10 PC上でMicrosoft Edge(Webブラウザ)を起動してWeb通信を発生させた後でSysmonのネットワーク通信ログ(event_id: 3, NetworkConnect)をElasticsearchから検索してみましょう。以下のクエリを実行してみます。
$ curl -XGET http://log.example.com:9200/winlogbeat-6.6.0-2019.05.28/_search?pretty -H 'Content-Type: application/json' -d '
{
  "query": {
    "bool":{
      "filter": [
        {
          "term": {
            "source_name" : "Microsoft-Windows-Sysmon"
          }
        },
        {
          "term": {
            "event_id" : 3
          }
        }
      ]
    }
  },
  "size":10000
}
'
以下のような検索結果が取得できます。**_source.event_data.*がJSONへ変換されたイベントログ内容です。また_source.host.***でWindows 10 PCのホスト名やOS情報、**source.beats.***にWinlogbeatの情報が入っています。
{
  "took" : 11,
  "timed_out" : false,
  "_shards" : {
    "total" : 3,
    "successful" : 3,
    "skipped" : 0,
    "failed" : 0
  },
  "hits" : {
    "total" : 450,
    "max_score" : 0.0,
    "hits" : [
...
     {
        "_index" : "winlogbeat-6.6.0-2019.05.28",
        "_type" : "doc",
        "_id" : "xxxxxxxxxaaG0mm0xxxx",
        "_score" : 0.0,
        "_source" : {
          "@timestamp" : "2019-05-28T13:27:05.847Z",
          "version" : 5,
          "thread_id" : 4624,
          "level" : "情報",
          "event_id" : 3,
          "user" : {
            "domain" : "NT AUTHORITY",
            "type" : "User",
            "identifier" : "S-1-5-18",
            "name" : "SYSTEM"
          },
          "log_name" : "Microsoft-Windows-Sysmon/Operational",
          "event_data" : {
            "ProcessGuid" : "{22052e76-41e5-5ced-0000-001040c33f00}",
            "ProcessId" : "1552",
            "DestinationPort" : "3128",
            "DestinationIp" : "192.168.1.10",
            "Protocol" : "tcp",
            "DestinationHostname" : "proxy.example.com",
            "Image" : "C:\\Windows\\System32\\MicrosoftEdgeCP.exe",
            "UtcTime" : "2019-05-24 13:27:05.530",
            "RuleName" : "Connection via Proxy",
            "SourceHostname" : "xxxxxxxx.localdomain",
            "Initiated" : "true",
            "User" : "xxxxxxxx\\hoge",
            "SourceIp" : "192.168.0.128",
            "SourceIsIpv6" : "false",
            "DestinationIsIpv6" : "false",
            "SourcePort" : "50305"
          },
          "process_id" : 2992,
          "task" : "Network connection detected (rule: NetworkConnect)",
          "host" : {
            "os" : {
              "platform" : "windows",
              "version" : "10.0",
              "family" : "windows",
              "name" : "Windows 10 Pro",
              "build" : "17763.107"
            },
            "id" : "22052e76-721a-4007-86f6-6346e89d0c86",
            "name" : "xxxxxxxx",
            "architecture" : "x86_64"
          },
          "beat" : {
            "name" : "xxxxxxxx",
            "hostname" : "xxxxxxxx",
            "version" : "6.6.0"
          },
          "computer_name" : "xxxxxxxx",
          "message" : "Network connection detected:\nRuleName: Connection via Proxy\nUtcTime: 2019-05-24 13:27:05.530\nProcessGuid: {22052e76-41e5-5ced-0000-001040c33f00}\nProcessId: 1552\nImage: C:\\Windows\\System32\\MicrosoftEdgeCP.exe\nUser: xxxxxxxx\\hoge\nProtocol: tcp\nInitiated: true\nSourceIsIpv6: false\nSourceIp: 192.168.0.128\nSourceHostname: xxxxxxxx.localdomain\nSourcePort: 50305\nSourcePortName: \nDestinationIsIpv6: false\nDestinationIp: 192.168.1.10\nDestinationHostname: proxy.example.com\nDestinationPort: 3128\nDestinationPortName: ",
          "type" : "wineventlog",
          "provider_guid" : "{5770385f-c22a-43e0-bf4c-06f5698ffbd9}",
          "source_name" : "Microsoft-Windows-Sysmon",
          "record_number" : "224727",
          "opcode" : "情報"
        }
      },
...
    ]
  }
}
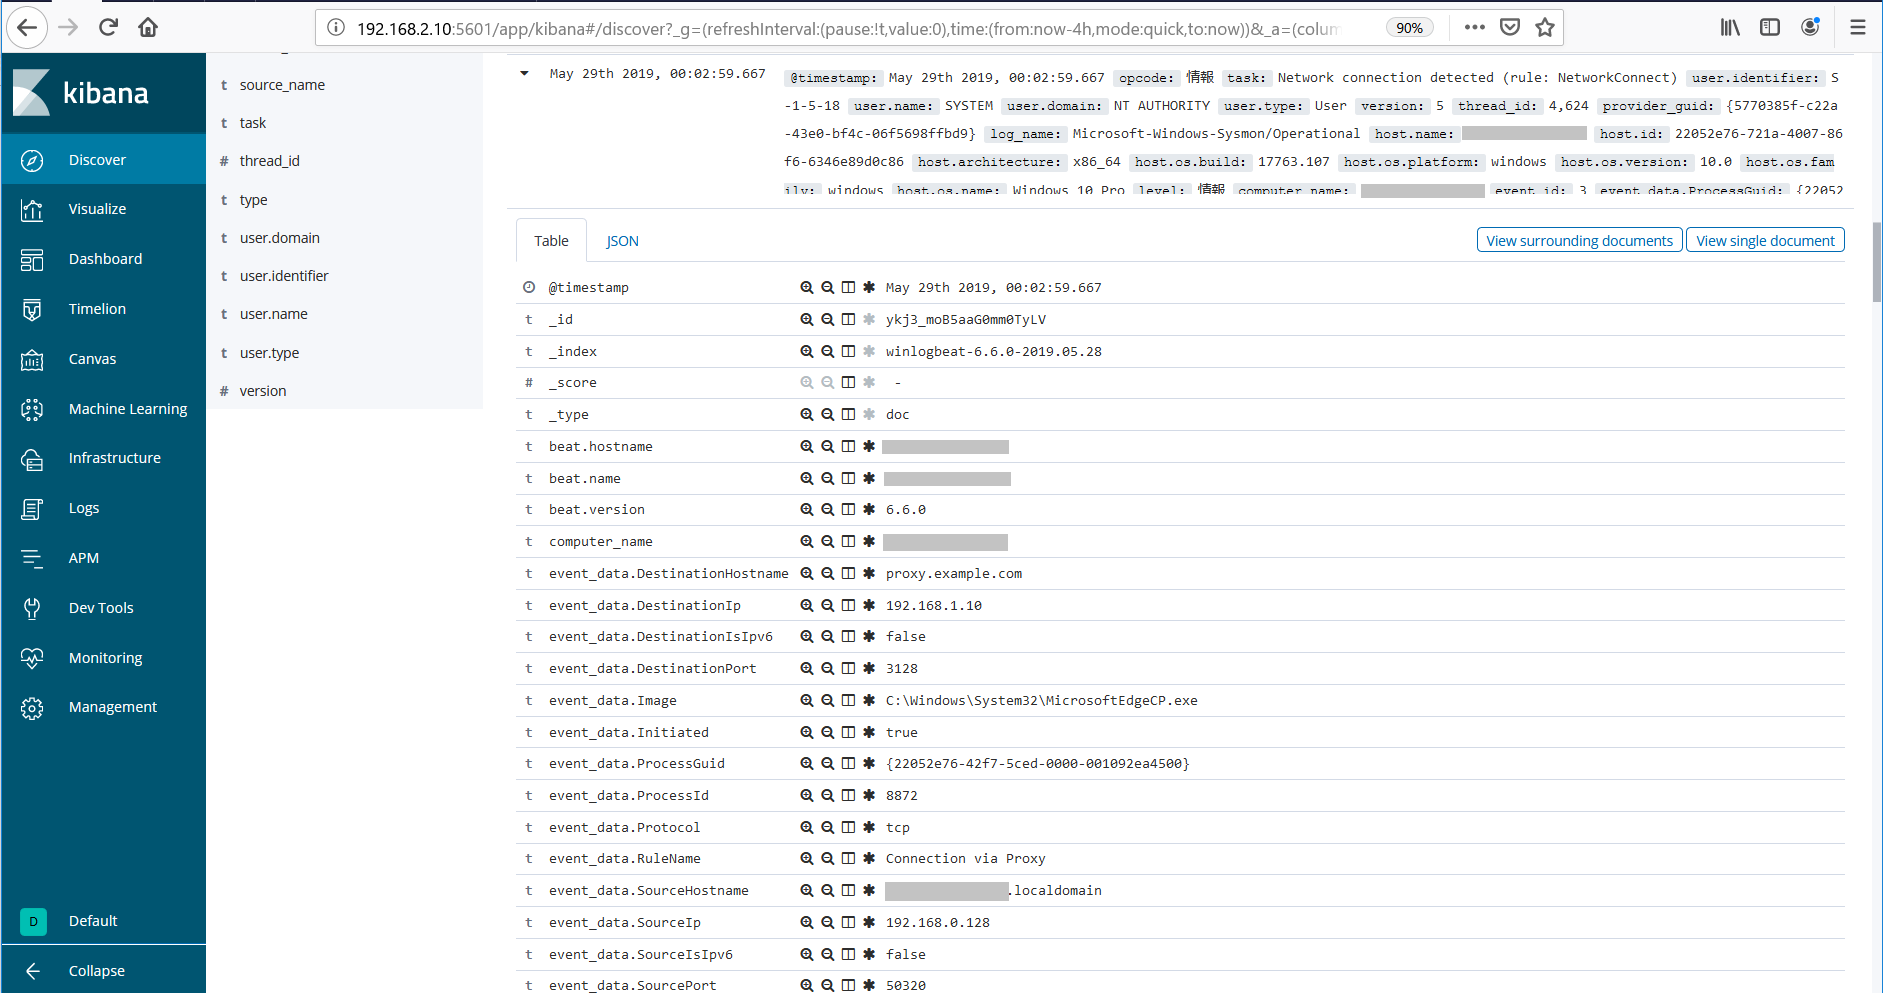
Kibanaでも確認
- Management/Create Index Patternにて winlogbeat-6.*を指定してインデクスパターンを生成
- Discoverにて転送されたログを確認できます
Sysmon + Winlogbeat用のテンプレートをElasticseachへ設定
小文字と大文字を区別せずにクエリしてみる
まず試しにデフォルト環境のままでさきほど動作テストで利用したMicrosoft Edge(Webブラウザ)のイメージファイルパスをすべて大文字にしたmatchクエリを作成し実行してみましょう。
$ curl -XGET http://log.example.com:9200/winlogbeat-6.6.0-2019.05.28/_search?pretty -H 'Content-Type: application/json' -d '
{
  "query": {
    "bool":{
      "filter": [
        {
          "term": {
            "source_name" : "Microsoft-Windows-Sysmon"
          }
        },
        {
          "term": {
            "event_id" : 3
          }
        },
        {
          "match": {
            "event_data.Image" : "C:\\WINDOWS\\SYSTEM32\\MICROSOFTEDGECP.EXE"
          }
        }
      ]
    }
  },
  "size":10000
}
'
検索結果は以下のようになりヒットしません。
{
  "took" : 1,
  "timed_out" : false,
  "_shards" : {
    "total" : 3,
    "successful" : 3,
    "skipped" : 0,
    "failed" : 0
  },
  "hits" : {
    "total" : 0,
    "max_score" : null,
    "hits" : [ ]
  }
}
しかし、Windowsではコマンド名として小文字と大文字は区別されないため、このままでは分析時にイベントログを検索する際に不便です。
そこでこのインデクス(winlogbeat-6.6.0-2019.05.28)の自動生成されたマッピングを調べてみます。
$ curl -XGET http://log.example.com:9200/winlogbeat-6.6.0-2019.05.28/_mapping?pretty
結果は以下の通りです。つまりSysmonイベントログの全フィールド(event_data.*)がデフォルトではkeyword型(完全一致型)で設定されています。
{
  "winlogbeat-6.6.0-2019.05.28" : {
    "mappings" : {
      "doc" : {
        "_meta" : {
          "version" : "6.6.0"
        },
        "dynamic_templates" : [
          {
            "event_data" : {
              "path_match" : "event_data.*",
              "match_mapping_type" : "string",
              "mapping" : {
                "type" : "keyword"
              }
            }
          },
...
        ],
        "date_detection" : false,
        "properties" : {
          "@timestamp" : {
            "type" : "date"
          },
...
          "event_data" : {
            "properties" : {
...
              "UtcTime" : {
                "type" : "keyword"
              },
...
              "Image" : {
                "type" : "keyword"
              },
              "CommandLine" : {
                "type" : "keyword"
              },
              "ProcessId" : {
                "type" : "keyword"
              },
...
              "SourceIp" : {
                "type" : "keyword"
              },
              "SourcePort" : {
                "type" : "keyword"
              },
...
            }
          },
...
  }
}
Sysmonイベントログ用のマッピングを設定
Sysmonイベントログのフィールドには完全一致ではなく、大文字と小文字を区別せずに検索したり、部分一致またはあいまい検索ができた方が便利なものもあります。
またタイムスタンプ、IPアドレスやポート番号はそれらに対応したデータ型にマップしたほうがクエリ操作で便利です(例えばIPアドレスをサブネットアドレス(プレフィックス長)条件でクエリしたり、ポート番号の範囲クエリをすることができるようになります)。
そこで以下のフィールドについてはkeyword型以外でマッピングを作成しElasticsearchへ設定してみます。
| Field | 変更後 | デフォルト |
|---|---|---|
| event_data.UtcTime | date | keyword |
| event_data.CreationUtcTime | date | keyword |
| event_data.PreviousCreationUtcTime | date | keyword |
| event_data.Image | text | keyword |
| event_data.Company | text | keyword |
| event_data.Product | text | keyword |
| event_data.Description | text | keyword |
| event_data.CommandLine | text | keyword |
| event_data.User | text | keyword |
| event_data.ParentImage | text | keyword |
| event_data.ParentCommandLine | text | keyword |
| event_data.Protocol | text | keyword |
| event_data.SourceHostname | text | keyword |
| event_data.DestinationHostname | text | keyword |
| event_data.SourceIp | ip | keyword |
| event_data.DestinationIp | ip | keyword |
| event_data.SourcePort | integer | keyword |
| event_data.DestinationPort | integer | keyword |
| event_data.SourcePortName | text | keyword |
| event_data.DestinationPortName | text | keyword |
| event_data.TargetFilename | text | keyword |
| event_data.Details | text | keyword |
| event_data.SourceImage | text | keyword |
| event_data.TargetImage | text | keyword |
| event_data.ImageLoaded | text | keyword |
| event_data.Signature | text | keyword |
| event_data.StartModule | text | keyword |
| event_data.StartFunction | text | keyword |
| event_data.Device | text | keyword |
| event_data.CallTrace | text | keyword |
| event_data.PipeName | text | keyword |
| event_data.TargetObject | text | keyword |
| event_data.EventType | text | keyword |
| event_data.Operation | text | keyword |
| event_data.Type | text | keyword |
| event_data.NewName | text | keyword |
| event_data.Name | text | keyword |
| event_data.Query | text | keyword |
| event_data.Destination | text | keyword |
| event_data.Consumer | text | keyword |
| event_data.Filter | text | keyword |
| event_data.Operation | text | keyword |
| event_data.RuleName | text | keyword |
| task | text | keyword |
| host.name | text | keyword |
| host.os.name | text | keyword |
Elasticsearchで指定可能なデータ型およびクエリ方法については以下を参照してください。
以下の手順でElasticsearchへSysmon用のテンプレート(マッピング)を設定します。
(1) デフォルトのWinlogbeatテンプレートをElasticsearchから取得
$ curl -XGET http://log.example.com:9200/_template/winlogbeat-6.6.0?pretty > template.json
(2) 取得したテンプレートをベースに前述のSysmon用フィールドのデータ型を反映したマッピングを追加定義
{
  "index_patterns": [
    "winlogbeat-6.6.0-*"
  ],
...
  "mappings": {
    "doc": {
      "_meta": {
        "version": "6.6.0"
      },
      "date_detection": false,
      "dynamic_templates": [
        {
          "event_data": {
            "mapping": {
              "type": "keyword"
            },
            "match_mapping_type": "string",
            "path_match": "event_data.*"
          }
        },
...
      ],
      "properties": {
...
        "event_data": {
          "type": "object",
          "properties": {
            "UtcTime": {
              "type": "date"
            },
...
            "Image": {
              "type": "text",
              "norms": false
            },
            "Company": {
              "type": "text",
              "norms": false
            },
            "Product": {
              "type": "text",
              "norms": false
            },
            "Description": {
              "type": "text",
              "norms": false
            },
            "CommandLine": {
              "type": "text",
              "norms": false
            },
            "User": {
              "type": "text",
              "norms": false
            },
...
            "SourceHostname": {
              "type": "text",
              "norms": false
            },
            "DestinationHostname": {
              "type": "text",
              "norms": false
            },
            "SourceIp": {
              "type": "ip"
            },
            "DestinationIp": {
              "type": "ip"
            },
            "SourcePort": {
              "type": "integer"
            },
            "DestinationPort": {
              "type": "integer"
            },
            "SourcePortName": {
              "type": "text",
              "norms": false
            },
            "DestinationPortName": {
              "type": "text",
              "norms": false
            },
...
            "RuleName": {
              "type": "text",
              "norms": false
            }
          }
        },
...
}
**event_data.***のフィールドに対してdatatypeを指定しています。
上記の作成済みのテンプレートを定義したJSONファイルはこちらに置いておきました。
(3) Elasticsearchへ更新したテンプレートを再設定する
$ curl -XPUT http://log.example.com:9200/_template/winlogbeat-6.6.0 -H 'Content-Type: application/json' -d @template.json
これでログの分析作業にとって都合の良いデータ型の設定ができました。
パイプライン処理(Elasticsearc/ingestノード)を設定
次に分析作業時に扱いやすいようにいくつかのフィールド値を変換または加工するElasticsearch/ingestノードのパイプライン設定を行っていきます。ingestノードによるパイプライン処理については「準備編」や「プロキシサーバ編」でも説明していますので参考にしてください。
インストール後のデフォルト環境のままでさきほど動作テストで取得したMicrosoft Edge(Webブラウザ)の検索結果を再度見てみると以下のような点に気づきます。
- @timestamp(Winlogbeatによりイベントログがインポートされた時刻)とイベントログのタイムスタンプ(event_data.UtcTime)が一致していない
- イベントログのタイムスタンプのフォーマットが@timestampで利用されるISO8601 形式でない(event_data.UtcTimeのdatatypeをkeyword型からdate型へ変更したためElasticsearchはイベントログの格納に失敗します)
など
イベントログを加工するパイプライン処理を設定
そこで以下のようなイベントログのフィールド値を加工するパイプライン処理を設定します。
| フィールド | 利用するプロセッサ | 処理内容 |
|---|---|---|
| event_data.UtcTime | Date | このフィールド値をパースして@timestampを上書きします |
| event_data.UtcTime event_data.CreationUtcTime event_data.PreviousCreationUtcTime |
Date | それぞれのタイムスタンプをISO8601形式へ変換します |
| event_data.SourcePort event_data.DestinationPort |
Convert | 通信ポート番号の値が文字列型のためinteger型へ変換します |
| event_data.Hashes event_data.Hash |
Split | 複数のハッシュ値が連結された一つの文字列値になっているのでアルゴリズム毎に分割して配列型で格納します |
| message | Remove | event_dataに設定されている情報と重複しているので削除します |
パイプライン処理を以下のようにpipeline.jsonファイルとして定義します。
{
  "description": "Winlogbeat-v6.6.0 pipiline for Sysmon-v9.01.",
  "processors": [
    {
      "date": {
        "field": "event_data.UtcTime",
        "formats": [
          "yyyy-MM-dd HH:mm:ss.SSS"
        ],
        "if": "ctx.source_name == \"Microsoft-Windows-Sysmon\"",
        "ignore_failure": true
      }
    },
    {
      "split": {
        "field": "event_data.Hashes",
        "separator": ",",
        "if": "ctx.source_name == \"Microsoft-Windows-Sysmon\"",
        "ignore_missing": true,
        "ignore_failure": true
      }
    },
    {
      "split": {
        "field": "event_data.Hash",
        "separator": ",",
        "if": "ctx.source_name == \"Microsoft-Windows-Sysmon\"",
        "ignore_missing": true,
        "ignore_failure": true
      }
    },
    {
      "date": {
        "field": "event_data.UtcTime",
        "target_field": "event_data.UtcTime",
        "formats": [
          "yyyy-MM-dd HH:mm:ss.SSS"
        ],
        "if": "ctx.source_name == \"Microsoft-Windows-Sysmon\"",
        "ignore_failure": true
      }
    },
    {
      "date": {
        "field": "event_data.CreationUtcTime",
        "target_field": "event_data.CreationUtcTime",
        "formats": [
          "yyyy-MM-dd HH:mm:ss.SSS"
        ],
        "if": "ctx.source_name == \"Microsoft-Windows-Sysmon\"",
        "ignore_failure": true
      }
    },
    {
      "date": {
        "field": "event_data.PreviousCreationUtcTime",
        "target_field": "event_data.PreviousCreationUtcTime",
        "formats": [
          "yyyy-MM-dd HH:mm:ss.SSS"
        ],
        "if": "ctx.source_name == \"Microsoft-Windows-Sysmon\"",
        "ignore_failure": true
      }
    },
    {
      "convert": {
        "field": "event_data.SourcePort",
        "type": "integer",
        "if": "ctx.source_name == \"Microsoft-Windows-Sysmon\" && ctx.event_id == 3",
        "ignore_missing": true,
        "ignore_failure": true
      }
    },
    {
      "convert": {
        "field": "event_data.DestinationPort",
        "type": "integer",
        "if": "ctx.source_name == \"Microsoft-Windows-Sysmon\" && ctx.event_id == 3",
        "ignore_missing": true,
        "ignore_failure": true
      }
    },
    {
      "remove": {
        "field": "message",
        "if": "ctx.source_name == \"Microsoft-Windows-Sysmon\"",
        "ignore_missing": true,
        "ignore_failure": true
      }
    }
  ]
}
上記の作成済みのパイプライン処理を定義したJSONファイルはこちらに置いておきました。
このパイプライン設定をmy-sysmon-9.01-winlogbeat-6.6.0という名前でElasticsearch/ingestノードへ登録します。
$ curl -XPUT http://log.example.com:9200/_ingest/pipeline/my-sysmon-9.01-winlogbeat-6.6.0 -H 'Content-Type: application/json' -d @pipeline.json
マッピングを再生成するためにインデクスを削除します。
$ curl -XDELETE http://log.example.com:9200/winlogbeat-6.6.0-2015.05.28
Winlogbeatの転送先パイプラインを設定
Windows 10 PC上でさきほど編集したC:\Program Files\winlogbeat-6.6.0-windows-x86_64\winlogbeat.ymlへ以下の通り転送先パイプライン名(my-sysmon-9.01-winlogbeat-6.6.0)設定を追加します。
winlogbeat.event_logs:
  - name: "Microsoft-Windows-Sysmon/Operational"

output.elasticsearch:
  hosts: ["log.example.com:9200"]
 #ログ転送先のパイプライン名を設定
  pipeline: "my-sysmon-9.01-winlogbeat-6.6.0"
設定を確認してWinlogbeatサービスを再起動します。
# Winlogbeatサービスを停止
PS C:\Program Files\winlogbeat-6.6.0-windows-x86_64> Stop-Service winlogbeat

# 設定をテスト
PS C:\Program Files\winlogbeat-6.6.0-windows-x86_64> .\winlogbeat.exe test output -e -d "*"

# Winlogbeatサービスを再起動
PS C:\Program Files\winlogbeat-6.6.0-windows-x86_64> Start-Service winlogbeat
Winlogbeatの動作確認
前述の同様にlog.example.com(Ubuntu 18.04)上でElasticsearchのインデクスが作成されていることを確認します。
$ curl http://log.example.com:9200/_cat/indices?v
health status index                       uuid                   pri rep docs.count docs.deleted store.size pri.store.size
yellow open   winlogbeat-6.6.0-2019.05.28 xxxxxxxxRGeMv4xxxxxxxx   1      15468            0     11.9mb         11.9mb
そしてWindows 10 PC上でMicrosoft Edge(Webブラウザ)を起動してWeb通信を発生させ、再作成されたこのインデクスのマッピングを確認してみます。
$ curl -XGET http://log.example.com:9200/winlogbeat-6.6.0-2019.05.28/_mapping?pretty
以下の通り**event_data.***配下のフィールドのdatatypeがkeyword型から変更されています。
{
  "winlogbeat-6.6.0-2019.05.28" : {
    "mappings" : {
      "doc" : {
        "_meta" : {
          "version" : "6.6.0"
        },
        "dynamic_templates" : [
          {
            "event_data" : {
              "path_match" : "event_data.*",
              "match_mapping_type" : "string",
              "mapping" : {
                "type" : "keyword"
              }
            }
          },
...
        "properties" : {
          "@timestamp" : {
            "type" : "date"
          },
...
          "event_data" : {
            "properties" : {
...
              "CommandLine" : {
                "type" : "text",
                "norms" : false
              },
...
              "DestinationIp" : {
                "type" : "ip"
              },
              "DestinationPort" : {
                "type" : "integer"
              },
...
              "Image" : {
                "type" : "text",
                "norms" : false
              },
...
              "SourceIp" : {
                "type" : "ip"
              },
              "SourcePort" : {
                "type" : "integer"
              },
...
              "UtcTime" : {
                "type" : "date"
              },
            }
          },
...
    }
  }
}
再度、小文字と大文字を区別せずにクエリしてみる
先ほど利用したMicrosoft Edge(Webブラウザ)のイメージファイルパスをすべて大文字にしたmatchクエリを再度実行してみましょう。
$ curl -XGET http://log.example.com:9200/winlogbeat-6.6.0-2019.05.28/_search?pretty -H 'Content-Type: application/json' -d '
{
  "query": {
    "bool":{
      "filter": [
        {
          "term": {
            "source_name" : "Microsoft-Windows-Sysmon"
          }
        },
        {
          "term": {
            "event_id" : 3
          }
        },
        {
          "match": {
            "event_data.Image" : "C:\\WINDOWS\\SYSTEM32\\MICROSOFTEDGECP.EXE"
          }
        }
      ]
    }
  },
  "size":10000
}
'
今度は無事に検索にヒットしました。
{
  "took" : 37,
  "timed_out" : false,
  "_shards" : {
    "total" : 3,
    "successful" : 3,
    "skipped" : 0,
    "failed" : 0
  },
  "hits" : {
    "total" : 989,
    "max_score" : 0.0,
    "hits" : [
...
      {
        "_index" : "winlogbeat-6.6.0-2019.05.28",
        "_type" : "doc",
        "_id" : "j0ycAmsB5aaG0mm0q0bH",
        "_score" : 0.0,
        "_source" : {
          "process_id" : 2992,
          "computer_name" : "xxxxxxxxxx",
          "level" : "情報",
          "log_name" : "Microsoft-Windows-Sysmon/Operational",
          "record_number" : "224462",
          "event_data" : {
            "User" : "xxxxxxxxxx\\hoge",
            "SourceHostname" : "xxxxxxxxxx.localdomain",
            "Image" : "C:\\Windows\\System32\\MicrosoftEdgeCP.exe",
            "SourcePort" : 50046,
            "DestinationPort" : 3128,
            "DestinationHostname" : "proxy.example.com",
            "ProcessGuid" : "{22052e76-41e5-5ced-0000-001040c33f00}",
            "UtcTime" : "2019-05-24T13:26:40.861Z",
            "Initiated" : "true",
            "DestinationIp" : "192.168.1.10",
            "SourceIp" : "192.168.0.128",
            "SourceIsIpv6" : "false",
            "DestinationIsIpv6" : "false",
            "ProcessId" : "1552",
            "Protocol" : "tcp",
            "RuleName" : "Connection via Proxy"
          },
          "opcode" : "情報",
          "type" : "wineventlog",
          "version" : 5,
          "thread_id" : 4624,
          "@timestamp" : "2019-05-24T13:26:40.861Z",
          "event_id" : 3,
          "task" : "Network connection detected (rule: NetworkConnect)",
          "provider_guid" : "{5770385f-c22a-43e0-bf4c-06f5698ffbd9}",
          "beat" : {
            "hostname" : "xxxxxxxxxx",
            "name" : "xxxxxxxxxx",
            "version" : "6.6.0"
          },
          "host" : {
            "os" : {
              "build" : "17763.107",
              "name" : "Windows 10 Pro",
              "family" : "windows",
              "version" : "10.0",
              "platform" : "windows"
            },
            "name" : "xxxxxxxxxx",
            "id" : "22052e76-721a-4007-86f6-6346e89d0c86",
            "architecture" : "x86_64"
          },
          "user" : {
            "identifier" : "S-1-5-18",
            "domain" : "NT AUTHORITY",
            "name" : "SYSTEM",
            "type" : "User"
          },
          "source_name" : "Microsoft-Windows-Sysmon"
        }
      },
...
}
またevent_data.UtcTimeフィールドはISO8601形式へ変換され**@timestamp**フィールドへも値が反映されています。パイプライン設定も正しく動作できているようです。
IPサブネットアドレス(プレフィックス)でクエリしてみる
ip datatypeのクエリ方法についてはこちらの公式サイトを参照してください。
$ curl -XGET http://log.example.com:9200/winlogbeat-6.6.0-2019.05.28/_search?pretty -H 'Content-Type: application/json' -d '
{
  "query": {
    "bool":{
      "filter": [
        {
          "term": {
            "source_name" : "Microsoft-Windows-Sysmon"
          }
        },
        {
          "term": {
            "event_id" : 3
          }
        },
        {
          "match": {
            "event_data.DestinationIp" : "192.168.1.0/24"
          }
        }
      ]
    }
  },
  "size":10000
}
'
無事に検索にヒットしました。
{
  "took" : 19,
  "timed_out" : false,
  "_shards" : {
    "total" : 3,
    "successful" : 3,
    "skipped" : 0,
    "failed" : 0
  },
  "hits" : {
    "total" : 903,
    "max_score" : 0.0,
    "hits" : [
...
      {
        "_index" : "winlogbeat-6.6.0-2019.05.28",
        "_type" : "doc",
        "_id" : "0kydAmsB5aaG0mm0JUzN",
        "_score" : 0.0,
        "_source" : {
          "computer_name" : "xxxxxxxxxxxx",
          "process_id" : 2992,
          "level" : "情報",
          "log_name" : "Microsoft-Windows-Sysmon/Operational",
          "record_number" : "226065",
          "event_data" : {
            "User" : "xxxxxxxxxxxx\\hoge",
            "Image" : "C:\\Windows\\System32\\MicrosoftEdgeCP.exe",
            "SourceHostname" : "DESKTOP-O3EHQF7.localdomain",
            "SourcePort" : 50734,
            "DestinationPort" : 3128,
            "DestinationHostname" : "proxy.example.com",
            "ProcessGuid" : "{22052e76-e440-5ce7-0000-0010dbc61500}",
            "UtcTime" : "2019-05-28T06:40:34.725Z",
            "DestinationIp" : "192.168.1.10",
            "Initiated" : "true",
            "SourceIp" : "192.168.0.128",
            "SourceIsIpv6" : "false",
            "DestinationIsIpv6" : "false",
            "ProcessId" : "7480",
            "Protocol" : "tcp",
            "RuleName" : "Connection via Proxy"
          },
...
          "@timestamp" : "2019-05-28T06:40:34.725Z",
...
}
Kibanaでも確認
- Management/Create Index Patternにて winlogbeat-6.*を指定してインデクスパターンを更新(Refresh field list)
- Discoverにて**event_data.***フィールドへパーシングされたログを確認できます
おまけ: 蓄積されているWindowsイベントログを全て再転送する
(1) Windows 10 PC上でWinlogbeatサービスを停止
PS C:\Program Files\winlogbeat-6.6.0-windows-x86_64> Stop-Service winlogbeat
(2) レジストリファイルをクリア
※ PowerShellは管理者権限で実行されているので誤ったフォルダやファイルを削除しないように十分に注意してください!
PS C:\Program Files\winlogbeat-6.6.0-windows-x86_64> _del_ C:\ProgramData\winlogbeat
(3) Windows 10 PC上でWinlogbeatサービスを再起動
PS C:\Program Files\winlogbeat-6.6.0-windows-x86_64> Stop-Service winlogbeat
ちなみに以下のスクリプトでWinlogbeatをアンインストールする場合にもレジストリファイルは削除されないため完全に状態をリセットしたい場合には消してもよいと思います。
PS C:\Program Files\winlogbeat-6.6.0-windows-x86_64> PowerShell.exe -ExecutionPolicy UnRestricted -File .\uninstall-service-winlogbeat.ps1
PS C:\Program Files\winlogbeat-6.6.0-windows-x86_64> _del_ C:\ProgramData\winlogbeat
まとめ
前回の「標的型攻撃に対するJPCERT/CCのおすすめログ設定をElasticsearchで構築してみる」の「エンドポイントログ編(その1)」に続き、Winlogbeatのインストール/設定およびElasticsearchへの追加コンフィグレーションについて説明しました。
これで本記事で目的としてきました基本的なログ基盤環境の実装は一通り完了しました。
次回の記事では、このログ基盤全体の動作テストも兼ねて、簡単な攻撃シナリオの解析作業をご紹介してみたいと思います。プロキシサーバ、メールサーバ、Windows 10 PCの各ログを横断的に検索し、攻撃シナリオの全体像をつかむ作業を説明できたらと考えています。
次回へ続く