Part 02
Cabin Feature
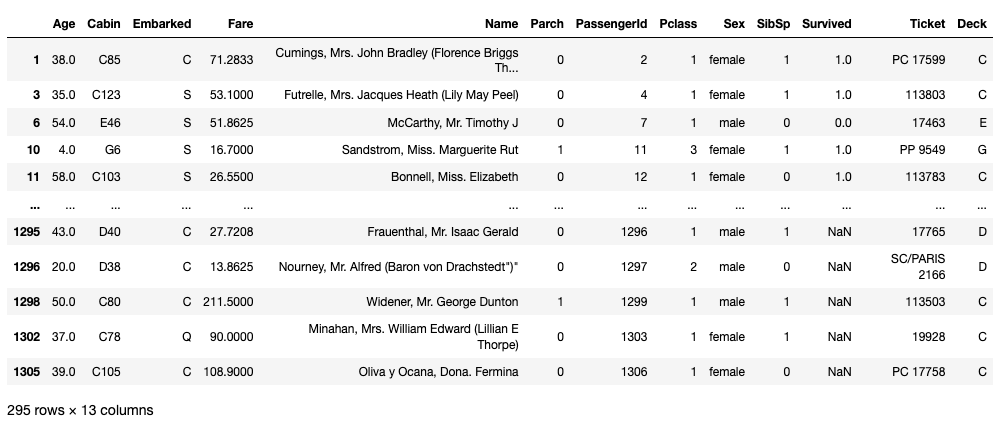
combined_df[combined_df["Cabin"].notnull()]

In the cabin feature, there is a letter before the number. I searched on the internet and found out the letter mean deck. The deck can be a useful feature to predict the survivability. So, I will remove the number and keep only the character.
combined_df['Deck'] = combined_df['Cabin'].str[:1]
combined_df[combined_df["Deck"].notnull()]

I assumed everybody owned a cabin on the ship. Before going further let's fill the missing deck values with "M" temporarily.
combined_df['Deck'].fillna('M', inplace=True)
First, let's check the counts of each cabin
values(combined_df, 'Deck')

We got 1014 missing values. So we need a good way to fill those missing values. Otherwise, our model can be inaccurate. I think we can use Pclass, Embarked, and Fare to fill the missing Deck values. Let's check it.
g = combined_df.groupby('Deck')['Pclass'].value_counts(normalize=True).unstack()
g.plot(kind='bar', stacked='True', figsize=(10,4) ).legend(bbox_to_anchor=(1, 0.5), title="Pclass")

We can see that there A, B, C cabins don't have 2nd and 3rd class passengers. 3rd class passengers are only in E, F, G Decks. There are second class passengers in D, E, F. Only the deck G holds 3rd class passengers.
g = sns.catplot(y='Fare', x='Deck', hue='Pclass', data=combined_df, kind='box', height=10, aspect=2)
g.fig.set_figwidth(12)
g.fig.set_figheight(8)
g = sns.catplot(y='Fare', x='Deck', hue='Embarked', data=combined_df, kind='box', height=10, aspect=2)
g.fig.set_figwidth(12)
g.fig.set_figheight(8)

From the above graphs, we can see that its possible to use Fare, Embarked and Pclass data. I think it's a good idea to fill missing values using mean fare values based on grouped Embarked and Pclass values.
print(' ---- Pclass 1 ---- ')
print(' ** Embarked : S ** ')
print(combined_df[(combined_df['Pclass']==1) & (combined_df['Embarked']=='S') & (combined_df['Deck']!='M')].groupby(['Deck'])['Fare'].mean().sort_values())
print('')
print(' ** Embarked : C ** ')
print(combined_df[(combined_df['Pclass']==1) & (combined_df['Embarked']=='C') & (combined_df['Deck']!='M')].groupby(['Deck'])['Fare'].mean().sort_values())
print('')
print(' ** Embarked : Q ** ')
print(combined_df[(combined_df['Pclass']==1) & (combined_df['Embarked']=='Q') & (combined_df['Deck']!='M')].groupby(['Deck'])['Fare'].mean().sort_values())
print('')
print('')
print(' ---- Pclass 2 ---- ')
print(' ** Embarked : S ** ')
print(combined_df[(combined_df['Pclass']==2) & (combined_df['Embarked']=='S') & (combined_df['Deck']!='M')].groupby(['Deck'])['Fare'].mean().sort_values())
print('')
print(' ** Embarked : C ** ')
print(combined_df[(combined_df['Pclass']==2) & (combined_df['Embarked']=='C') & (combined_df['Deck']!='M')].groupby(['Deck'])['Fare'].mean().sort_values())
print('')
print(' ** Embarked : Q ** ')
print(combined_df[(combined_df['Pclass']==2) & (combined_df['Embarked']=='Q') & (combined_df['Deck']!='M')].groupby(['Deck'])['Fare'].mean().sort_values())
print('')
print('')
print(' ---- Pclass 3 ---- ')
print('** Embarked : S ** ')
print(combined_df[(combined_df['Pclass']==3) & (combined_df['Embarked']=='S') & (combined_df['Deck']!='M')].groupby(['Deck'])['Fare'].mean().sort_values())
print('')
print(' ** Embarked : C ** ')
print(combined_df[(combined_df['Pclass']==3) & (combined_df['Embarked']=='C') & (combined_df['Deck']!='M')].groupby(['Deck'])['Fare'].mean().sort_values())
print('')
print(' ** Embarked : Q ** ')
print(combined_df[(combined_df['Pclass']==3) & (combined_df['Embarked']=='Q') & (combined_df['Deck']!='M')].groupby(['Deck'])['Fare'].mean().sort_values())
This will out put mean Fare values for each deck concerning Pclass and Embarked. Then we can use those values to fill missing deck values.
def fill_deck(df):
    temp = []
    temp_deck = ''
    for idx in range(len(df)):
        temp_deck = df.iloc[idx]['Deck']
        if df.iloc[idx]['Deck'] == 'M':
            if df['Pclass'].iloc[idx] == 1:
                if df['Embarked'].iloc[idx] == 'S':
                    if df['Fare'].iloc[idx] < 35.5:
                        temp_deck = 'T'

                    elif df['Fare'].iloc[idx] >= 35.50 and df['Fare'].iloc[idx] < 46.43:
                        temp_deck = 'E'

                    elif df['Fare'].iloc[idx] >= 46.43 and df['Fare'].iloc[idx] < 47.27:
                        temp_deck = 'A'

                    elif df['Fare'].iloc[idx] >= 47.27 and df['Fare'].iloc[idx] < 47.70:
                        temp_deck = 'D'

                    elif df['Fare'].iloc[idx] >= 47.70 and df['Fare'].iloc[idx] < 78.67:
                        temp_deck = 'B'

                    else:
                        temp_deck = 'C'

                elif df['Embarked'].iloc[idx] == 'C':
                    if df['Fare'].iloc[idx] < 35.20:
                        temp_deck = 'A'

                    elif df['Fare'].iloc[idx] >= 35.20 and df['Fare'].iloc[idx] < 75.73:
                        temp_deck = 'D'

                    elif df['Fare'].iloc[idx] >= 75.73 and df['Fare'].iloc[idx] < 99.07:
                        temp_deck = 'E'

                    elif df['Fare'].iloc[idx] >= 99.07 and df['Fare'].iloc[idx] < 106.25:
                        temp_deck = 'C'

                    else:
                        temp_deck = 'B'

                elif df['Embarked'].iloc[idx] == 'Q':
                    temp_deck = 'C'

            elif df['Pclass'].iloc[idx] == 2:
                if df['Embarked'].iloc[idx] == 'S':
                    if df['Fare'].iloc[idx] < 11.33:
                        temp_deck = 'E'

                    elif df['Fare'].iloc[idx] >= 11.33 and df['Fare'].iloc[idx] < 13:
                        temp_deck = 'D'

                    else:
                        temp_deck = 'F'

                elif df['Embarked'].iloc[idx] == 'C':
                    temp_deck = 'D'

                elif df['Embarked'].iloc[idx] == 'Q':
                    temp_deck = 'E'

            elif df['Pclass'].iloc[idx] == 3:
                if df['Embarked'].iloc[idx] == 'S':
                    if df['Fare'].iloc[idx] < 7.60:
                        temp_deck = 'F'

                    elif df['Fare'].iloc[idx] >= 7.60 and df['Fare'].iloc[idx] < 11:
                        temp_deck = 'E'

                    else:
                        temp_deck = 'G'

                else:
                    temp_deck = 'F'

        temp.append(temp_deck)
    df['Deck'] = temp


fill_deck(combined_df)
Age Feature
There are 263 missing values of the age. If we think about the real-world situation, age can be a very significant relationship to survival rate. So we have to care a bit when dealing with missing values of this feature. We can assign mean values. But wait, what happens if kids have given priority when evacuation? Then mean values is not seems a great choice because 3 years old can be assigned as 29. If we can filter out more, it will great for our model. What can be more related to age? We didn't use the Name feature yet, we should check it.
combined_df["Name"].to_list()[:30]

OK. We have Mr, Mrs, Miss, and Master in the Name feature. This may help us to derive missing age values. Let's find out. Seems like every title ends with ".". So, we can use our god which is the regex to save us.
combined_df['Title'] = ''
for _ in combined_df:
    combined_df['Title'] = combined_df['Name'].str.extract('([A-Za-z]+)\.')

combined_df.head()
pd.crosstab(combined_df["Title"], combined_df["Sex"]).T
Oh, there are 18 different titles. We can see that there are 4 major title categories, some rare categories, and miss-spelled categories. I will make a new Title named Rare and replace rare titles by it.
combined_df["Title"].replace(
    ['Capt', 'Col','Countess','Don', 'Dona', 'Dr', 'Jonkheer', 'Major', 'Rev', 'Sir', 'Dona'], 'Rare'
, inplace = True)
Now lets deal with the missed spelled titles,
combined_df['Title'].replace(
    ['Lady', 'Mlle', 'Mme', 'Ms'],
    ['Mrs', 'Miss', 'Miss', 'Mrs'],inplace=True)
pd.crosstab(combined_df["Title"], combined_df["Survived"]).T
g = sns.catplot(y="Age",x="Title",hue="Pclass", data=combined_df, kind="box", size = 8)
g.fig.set_figwidth(12)
g.fig.set_figheight(6)

The graph shows Age depends on Pclass and the Title of the name.
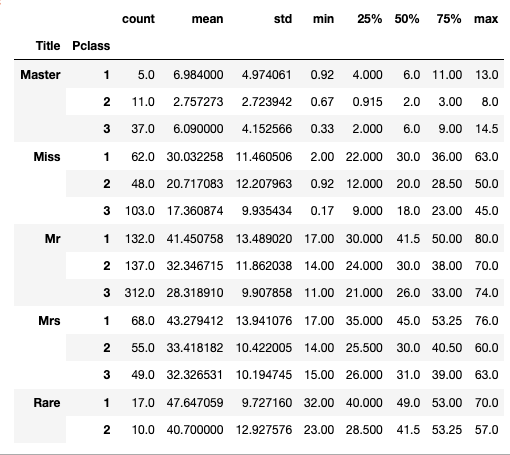
combined_df.groupby(["Title", "Pclass"])["Age"].describe()

OK, now we can see how the age is distributed among the Titles. I am going to use respecting q3 values to the missing age values.
combined_df.loc[(combined_df['Age'].isnull()) & (combined_df['Title']=='Master') & (combined_df['Pclass']==1),'Age'] = 11
combined_df.loc[(combined_df['Age'].isnull()) & (combined_df['Title']=='Master') & (combined_df['Pclass']==2),'Age'] = 3
combined_df.loc[(combined_df['Age'].isnull()) & (combined_df['Title']=='Master') & (combined_df['Pclass']==3),'Age'] = 9

combined_df.loc[(combined_df['Age'].isnull()) & (combined_df['Title']=='Miss') & (combined_df['Pclass']==1),'Age'] = 36
combined_df.loc[(combined_df['Age'].isnull()) & (combined_df['Title']=='Miss') & (combined_df['Pclass']==2),'Age'] = 28.5
combined_df.loc[(combined_df['Age'].isnull()) & (combined_df['Title']=='Miss') & (combined_df['Pclass']==3),'Age'] = 23

combined_df.loc[(combined_df['Age'].isnull()) & (combined_df['Title']=='Mr') & (combined_df['Pclass']==1),'Age'] = 50
combined_df.loc[(combined_df['Age'].isnull()) & (combined_df['Title']=='Mr') & (combined_df['Pclass']==2),'Age'] = 38
combined_df.loc[(combined_df['Age'].isnull()) & (combined_df['Title']=='Mr') & (combined_df['Pclass']==3),'Age'] = 33

combined_df.loc[(combined_df['Age'].isnull()) & (combined_df['Title']=='Mrs') & (combined_df['Pclass']==1),'Age'] = 53.25
combined_df.loc[(combined_df['Age'].isnull()) & (combined_df['Title']=='Mrs') & (combined_df['Pclass']==2),'Age'] = 40.5
combined_df.loc[(combined_df['Age'].isnull()) & (combined_df['Title']=='Mrs') & (combined_df['Pclass']==3),'Age'] = 39

combined_df.loc[(combined_df['Age'].isnull()) & (combined_df['Title']=='Rare') & (combined_df['Pclass']==1),'Age'] = 53
combined_df.loc[(combined_df['Age'].isnull()) & (combined_df['Title']=='Rare') & (combined_df['Pclass']==2),'Age'] = 53.25
Great, now we had finished filling missing values. The next phase is data analyzing and feature engineering.
I will continue this in another post.
Next
Table of contents
- Kaggle Titanic data set - Top 2% guide (Part 01)
- Kaggle Titanic data set - Top 2% guide (Part 02)
- Kaggle Titanic data set - Top 2% guide (Part 03)
- Kaggle Titanic data set - Top 2% guide (Part 04)
- Kaggle Titanic data set - Top 2% guide (Part 05)
*本記事は @qualitia_cdevの中の一人、@nuwanさんに作成していただきました。
*This article is written by @nuwan a member of @qualitia_cdev.


