概要
この手順は、GSMまたはFNL気象データを用いて、WRFシミュレーションを再現性をもって行うための準備工程を記すものです.
- 使用データ:気象庁 GSM GPV(grib2形式,L-pall)
- 使用ツール:WPS(v4.6.0)
- 実行環境:WSL2(Ubuntu 22.04)+ XFCE GUI
- 目的:将来的な再現可能性のあるWRFランのための準備手順を整理する.
WSL2上にWRFおよびXFCE GUI環境を構築済みであることを前提とします.環境構築には こちらのQiita記事 を参考にしました.
なお,GSMデータの取得とnamelist.wpsの自動生成には,Streamlitにより自作したGUIツールを使用しています.手順中ではGUI操作を行う箇所を明示し,ターミナル上での操作と分離して記述します.GUIでの操作についてはpython3といくつかのライブラリを用いて動かしていますので,適宜インストールするようにしてください.(開発環境ではPython 3.13で動作確認)
1. ディレクトリ構成(推奨)
今回のテストランでは以下のような構成になっています.
~/WRF/
├── WPS-4.6.0/
│   └── RUN/
│       └── run_project_20250603/
├── GSM_DATA/
│   ├── Z__C_RJTD_20250505000000_GSM_GPV_Rjp_Gll0p1deg_L-pall_FD0000-0100_grib2.bin
│   └── ...(以降同様)
各テストプロジェクトは run_project_YYYYMMDD/ のように日付付きで整理することで,再現性のある管理が可能になります.
2. GRIB2ファイルの準備
2.1 データ設置
以下のようにGSM GPVデータ(grib2形式)を専用フォルダに保存します.ファイルは連番で複数時刻分取得することが前提です.
~/WRF/GSM_DATA/
├── Z__C_RJTD_20250505000000_GSM_GPV_Rjp_Gll0p1deg_L-pall_FD0000-0100_grib2.bin
├── Z__C_RJTD_20250505000000_GSM_GPV_Rjp_Gll0p1deg_L-pall_FD0103-0200_grib2.bin
├── ...
2.2 データダウンロード(GUI)
以下のStreamlitアプリにより,日付と時間範囲を指定して自動ダウンロード可能です.
例えば,気象庁GSMであれば以下のようにします.保存ディレクトリの指定でuserは自分のユーザー名へ変更して下さい.
streamlit run ./GSM_downloader.py
で走らせます.
なお,データサーバーの京都大学生存圏研は研究・教育目的でのみ利用を認めているようですので,そのあたりは十分注意するようお願いいたします.
(以下の通りGSMをダウンロードすると,計算対象時刻における予測外力が.grib2形式で入っていく形になります)
import streamlit as st
from datetime import datetime, timedelta
import requests
import os

# time step
fd_list = [
    'FD0000', 'FD0006', 'FD0012', 'FD0018',
    'FD0100', 'FD0106', 'FD0112', 'FD0118',
    'FD0200', 'FD0206', 'FD0212', 'FD0218',
    'FD0300', 'FD0306', 'FD0312', 'FD0318',
    'FD0400', 'FD0406', 'FD0412', 'FD0418',
    'FD0500', 'FD0506', 'FD0512', 'FD0518',
    'FD0600', 'FD0606', 'FD0612', 'FD0618',
    'FD0700', 'FD0706', 'FD0712', 'FD0718',
    'FD0800', 'FD0806', 'FD0812', 'FD0818',
    'FD0900', 'FD0906', 'FD0912', 'FD0918',
    'FD1000', 'FD1006', 'FD1012', 'FD1018',
    'FD1100'
]

# function
def download_gsm_file(base_datetime, fd_code, save_dir="downloads"):
    timestamp = base_datetime.strftime("%Y%m%d%H") + "0000"
    filename = f"Z__C_RJTD_{timestamp}_GSM_GPV_Rgl_{fd_code}_grib2.bin"

    yr = base_datetime.strftime("%Y")
    mh = base_datetime.strftime("%m")
    dy = base_datetime.strftime("%d")
    base_url = f"http://database.rish.kyoto-u.ac.jp/arch/jmadata/data/gpv/original/{yr}/{mh}/{dy}"
    url = f"{base_url}/{filename}"

    os.makedirs(save_dir, exist_ok=True)
    file_path = os.path.join(save_dir, filename)

    try:
        with requests.get(url, stream=True) as r:
            if r.status_code == 200:
                with open(file_path, 'wb') as f:
                    for chunk in r.iter_content(chunk_size=8192):
                        f.write(chunk)
                return f"Downloaded: {filename}"
            else:
                return f"Not Found: {filename}"
    except Exception as e:
        return f"Error downloading {filename}: {e}"

# Streamlit UI
st.title("GSM GPV Downloader (RISH, Kyoto University)")

st.markdown("指定した期間・時刻の GSM GPV 各時間分割ファイル(FDxxxx)をダウンロードします。")

col1, col2 = st.columns(2)
with col1:
    start_date = st.date_input("Start Date", datetime(2025, 5, 5).date())
    start_hour = st.selectbox("Start Hour (UTC)", [0, 6, 12, 18], index=0)
with col2:
    end_date = st.date_input("End Date", datetime(2025, 5, 6).date())
    end_hour = st.selectbox("End Hour (UTC)", [0, 6, 12, 18], index=3)

start_dt = datetime.combine(start_date, datetime.min.time()) + timedelta(hours=start_hour)
end_dt = datetime.combine(end_date, datetime.min.time()) + timedelta(hours=end_hour)

save_dir = st.text_input("Download folder path", value="//wsl.localhost/Ubuntu-22.04/home/rsaito_wsl/WRF/GSM_DATA")

if start_dt > end_dt:
    st.error("End datetime must be after start datetime.")
else:
    run = st.button("Start Download")

    if run:
        st.info(f"Downloading from {start_dt} to {end_dt} (UTC)...")

        datetimes = []
        current = start_dt
        while current <= end_dt:
            datetimes.append(current)
            current += timedelta(hours=6)

        total = len(datetimes) * len(fd_list)
        progress = st.progress(0)
        counter = 0

        for dt in datetimes:
            for fd in fd_list:
                msg = download_gsm_file(dt, fd, save_dir)
                st.write(msg)
                counter += 1
                progress.progress(counter / total)

        st.success("All downloads completed.")

こんな感じ.
また,一般にWRFの計算でよく使われるFNLデータであれば,
import streamlit as st
from datetime import datetime, timedelta
import requests
import os

def download_fnl_file(date_time, save_dir="downloads"):
    base_url = "https://data.rda.ucar.edu/ds083.2/grib2"
    date_str = date_time.strftime("%Y/%Y.%m")
    filename = f"fnl_{date_time.strftime('%Y%m%d_%H_00')}.grib2"
    url = f"{base_url}/{date_str}/{filename}"

    os.makedirs(save_dir, exist_ok=True)
    file_path = os.path.join(save_dir, filename)

    try:
        with requests.get(url, stream=True) as r:
            if r.status_code == 200:
                with open(file_path, 'wb') as f:
                    for chunk in r.iter_content(chunk_size=8192):
                        f.write(chunk)
                return f"Downloaded: {filename}"
            else:
                return f"Not Found: {filename}"
    except Exception as e:
        return f"Error downloading {filename}: {e}"

# UI
st.title("FNL Data Downloader")

st.markdown("Specify the download **start and end datetime** (UTC).")

# 日時入力
col1, col2 = st.columns(2)
with col1:
    start_date = st.date_input("Start Date", datetime(2025, 1, 1).date())
    start_hour = st.selectbox("Start Hour (UTC)", [0, 6, 12, 18], index=1)
with col2:
    end_date = st.date_input("End Date", datetime(2025, 1, 2).date())
    end_hour = st.selectbox("End Hour (UTC)", [0, 6, 12, 18], index=3)

start_dt = datetime.combine(start_date, datetime.min.time()) + timedelta(hours=start_hour)
end_dt = datetime.combine(end_date, datetime.min.time()) + timedelta(hours=end_hour)

# 保存先ディレクトリ入力
save_dir = st.text_input("Download folder path", value="//wsl.localhost/Ubuntu-22.04/home/user/WRF/FNL_DATA")

# 実行ボタン
if start_dt > end_dt:
    st.error("End datetime must be after start datetime.")
else:
    run = st.button("Start Download")

    if run:
        st.info(f"Downloading from {start_dt} to {end_dt} (UTC)...")
        current = start_dt
        datetimes = []

        while current <= end_dt:
            if current.hour in [0, 6, 12, 18]:
                datetimes.append(current)
            current += timedelta(hours=6)

        total = len(datetimes)
        progress = st.progress(0)

        for i, dt in enumerate(datetimes):
            msg = download_fnl_file(dt, save_dir)
            st.write(msg)
            progress.progress((i + 1) / total)

        st.success("Download completed.")
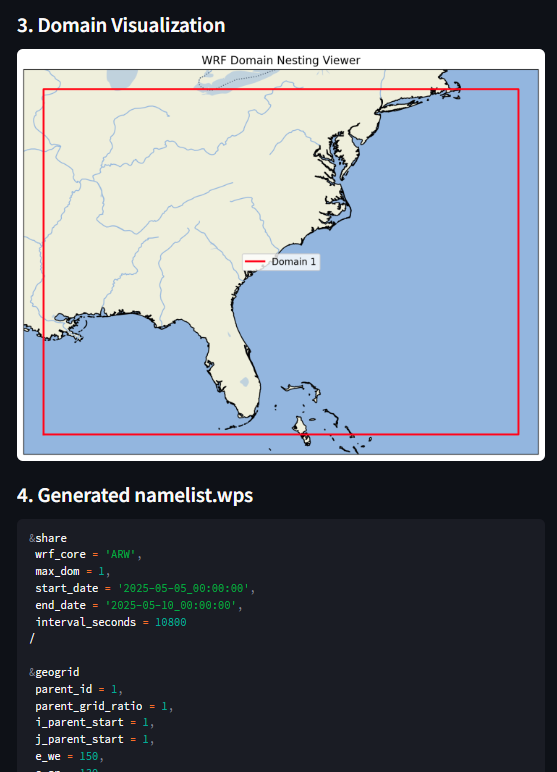
3. namelist.wpsの生成
次に,こちらも同様自作のGUIツールにより,緯度経度・解像度・開始終了時刻を指定してnamelist.wpsを自動生成します.
出力として,.wps形式でダウンロード・テキストとしてコピペにも対応しています.
ただ,実計算をするときには多少いじる必要が発生する場合があると思いますので,そこはご承知おきください.
- 保存先:
~/WRF/WPS-4.6.0/RUN/run_project_20250603/namelist.wps
import streamlit as st
import matplotlib.pyplot as plt
import cartopy.crs as ccrs
import cartopy.feature as cfeature
import numpy as np
from datetime import datetime, timedelta

def calc_domain_bounds(ref_lat, ref_lon, dx, dy, e_we, e_sn):
    # dx, dy in meters, convert to degrees approx (at mid-latitudes ~111km/deg)
    km_per_deg = 111.0
    delta_lat = (dy * (e_sn - 1)) / 1000 / km_per_deg / 2
    delta_lon = (dx * (e_we - 1)) / 1000 / (km_per_deg * np.cos(np.radians(ref_lat))) / 2
    return {
        "min_lat": ref_lat - delta_lat,
        "max_lat": ref_lat + delta_lat,
        "min_lon": ref_lon - delta_lon,
        "max_lon": ref_lon + delta_lon,
    }

# Streamlit UI
st.title("WRF namelist.wps Domain Viewer and Generator")

# --- Share Section Inputs ---
st.header("1. &share Settings")
wrf_core = st.selectbox("wrf_core", ['ARW'], index=0)
max_dom = st.number_input("max_dom", min_value=1, max_value=2, value=1)

col1_share, col2_share = st.columns(2)
with col1_share:
    start_date_str = st.date_input("Start Date", value=datetime(2025, 5, 5))
    start_time_str = st.time_input("Start Time", value=datetime(2025, 5, 5, 0, 0).time())
with col2_share:
    end_date_str = st.date_input("End Date", value=datetime(2025, 5, 10))
    end_time_str = st.time_input("End Time", value=datetime(2025, 5, 10, 0, 0).time())

interval_seconds = st.number_input("interval_seconds", value=10800, min_value=0)

# --- Geogrid Section Inputs ---
st.header("2. &geogrid Settings")
ref_lat = st.number_input("Reference Latitude", value=33.00)
ref_lon = st.number_input("Reference Longitude", value=-79.00)
dx1 = st.number_input("dx [m] (Domain 1)", value=15000)
dy1 = st.number_input("dy [m] (Domain 1)", value=15000)
e_we1 = st.number_input("e_we (Domain 1)", value=150)
e_sn1 = st.number_input("e_sn (Domain 1)", value=130)

domains = st.number_input("Number of domains (nesting levels)", min_value=1, max_value=2, value=max_dom)
if domains > max_dom: # Ensure domains doesn't exceed max_dom
    domains = max_dom
    st.warning(f"Number of domains adjusted to max_dom ({max_dom}).")


parent_id_list = [1]
parent_grid_ratio_list = [1]
i_parent_start_list = [1]
j_parent_start_list = [1]
e_we_list = [e_we1]
e_sn_list = [e_sn1]

dx2 = dx1
dy2 = dy1

if domains >= 2:
    st.subheader("Domain 2 (Nested Domain) Settings")
    grid_ratio = st.number_input("Parent grid ratio (Domain 2 to 1)", value=3, key="grid_ratio2")
    i_parent_start = st.number_input("i_parent_start (Domain 2)", value=53, key="i_parent_start2")
    j_parent_start = st.number_input("j_parent_start (Domain 2)", value=25, key="j_parent_start2")
    e_we2 = st.number_input("e_we (Domain 2)", value=220, key="e_we2")
    e_sn2 = st.number_input("e_sn (Domain 2)", value=214, key="e_sn2")

    parent_id_list.append(1)
    parent_grid_ratio_list.append(grid_ratio)
    i_parent_start_list.append(i_parent_start)
    j_parent_start_list.append(j_parent_start)
    e_we_list.append(e_we2)
    e_sn_list.append(e_sn2)

    dx2 = dx1 / grid_ratio
    dy2 = dy1 / grid_ratio


geog_data_res = st.text_input("geog_data_res", value="'default','default'")
map_proj = st.selectbox("map_proj", ['lambert', 'mercator', 'polar'], index=0)
truelat1 = st.number_input("truelat1", value=30.0)
truelat2 = st.number_input("truelat2", value=60.0)
stand_lon = st.number_input("stand_lon", value=-79.0)
geog_data_path = st.text_input("geog_data_path", value="'../WPS_GEOG/'")
legend_location = st.selectbox(
"Select Legend Position",
('best', 'upper right', 'upper left', 'lower left', 'lower right',
    'right', 'center left', 'center right', 'lower center', 'upper center', 'center'), key="legend_pos"
)

# Plotting and Namelist Generation
if st.button("Generate namelist.wps and Plot Domain"):
    st.subheader("3. Domain Visualization")
    fig = plt.figure(figsize=(10, 8))
    ax = plt.axes(projection=ccrs.PlateCarree())

    bounds1 = calc_domain_bounds(ref_lat, ref_lon, dx1, dy1, e_we1, e_sn1)
    ax.set_extent([
        bounds1['min_lon'] - 1, bounds1['max_lon'] + 1,
        bounds1['min_lat'] - 1, bounds1['max_lat'] + 1
    ], crs=ccrs.PlateCarree())

    ax.coastlines(resolution='10m')
    ax.add_feature(cfeature.BORDERS, linestyle=':')
    ax.add_feature(cfeature.LAND)
    ax.add_feature(cfeature.OCEAN)
    ax.add_feature(cfeature.LAKES, alpha=0.5)
    ax.add_feature(cfeature.RIVERS)

    # Domain 1 rectangle
    ax.plot(
        [bounds1['min_lon'], bounds1['max_lon'], bounds1['max_lon'], bounds1['min_lon'], bounds1['min_lon']],
        [bounds1['min_lat'], bounds1['min_lat'], bounds1['max_lat'], bounds1['max_lat'], bounds1['min_lat']],
        color='red', linewidth=2, label='Domain 1'
    )

    if domains >= 2:
        # Calculate nested domain center offset from parent
        # The i_parent_start and j_parent_start define the bottom-left corner of the child domain
        # in terms of the parent domain's grid points.
        # The center of the child domain (in parent grid points) is approx:
        # (i_parent_start + e_we2 / 2, j_parent_start + e_sn2 / 2)
        # However, the namelist.wps 'ref_lat', 'ref_lon' are for the *center* of the parent domain.
        # The 'i_parent_start' and 'j_parent_start' are relative to the parent domain's *bottom-left corner*.
        # So, the offset needs to be calculated from the parent's bottom-left to the child's bottom-left.

        offset_x_meters = (i_parent_start - 1) * dx1
        offset_y_meters = (j_parent_start - 1) * dy1

        # The 'ref_lat' and 'ref_lon' are the center of the *parent* domain.
        # To find the true center of the child domain in terms of absolute lat/lon,
        # we need to consider the parent's bottom-left corner, then apply the offset.
        # Parent's bottom-left lat/lon:
        parent_bl_lat = ref_lat - (dy1 * (e_sn1 - 1)) / (2 * 1000 * 111.0)
        parent_bl_lon = ref_lon - (dx1 * (e_we1 - 1)) / (2 * 1000 * (111.0 * np.cos(np.radians(ref_lat))))

        # Child's bottom-left lat/lon
        child_bl_lat = parent_bl_lat + offset_y_meters / (1000 * 111.0)
        child_bl_lon = parent_bl_lon + offset_x_meters / (1000 * (111.0 * np.cos(np.radians(parent_bl_lat))))

        # Child's center lat/lon
        ref_lat2 = child_bl_lat + (dy2 * (e_sn2 - 1)) / (2 * 1000 * 111.0)
        ref_lon2 = child_bl_lon + (dx2 * (e_we2 - 1)) / (2 * 1000 * (111.0 * np.cos(np.radians(child_bl_lat))))

        bounds2 = calc_domain_bounds(ref_lat2, ref_lon2, dx2, dy2, e_we2, e_sn2)

        ax.plot(
            [bounds2['min_lon'], bounds2['max_lon'], bounds2['max_lon'], bounds2['min_lon'], bounds2['min_lon']],
            [bounds2['min_lat'], bounds2['min_lat'], bounds2['max_lat'], bounds2['max_lat'], bounds2['min_lat']],
            color='blue', linewidth=2, linestyle='--', label='Domain 2'
        )


    plt.legend(loc=legend_location)
    plt.title("WRF Domain Nesting Viewer")
    st.pyplot(fig)

    # --- Namelist Generation ---
    st.subheader("4. Generated namelist.wps")

    start_date_formatted = start_date_str.strftime('%Y-%m-%d') + f"_{start_time_str.hour:02d}:{start_time_str.minute:02d}:{start_time_str.second:02d}"
    end_date_formatted = end_date_str.strftime('%Y-%m-%d') + f"_{end_time_str.hour:02d}:{end_time_str.minute:02d}:{end_time_str.second:02d}"

    # Prepare lists for domains
    start_dates = [f"'{start_date_formatted}'"] * domains
    end_dates = [f"'{end_date_formatted}'"] * domains
    geog_data_res_list = geog_data_res.split(',') # assuming format like 'default','default'

    namelist_content = f"""&share
 wrf_core = '{wrf_core}',
 max_dom = {max_dom},
 start_date = {','.join(start_dates)},
 end_date = {','.join(end_dates)},
 interval_seconds = {interval_seconds}
/

&geogrid
 parent_id = {','.join(map(str, parent_id_list))},
 parent_grid_ratio = {','.join(map(str, parent_grid_ratio_list))},
 i_parent_start = {','.join(map(str, i_parent_start_list))},
 j_parent_start = {','.join(map(str, j_parent_start_list))},
 e_we = {','.join(map(str, e_we_list))},
 e_sn = {','.join(map(str, e_sn_list))},
 geog_data_res = {','.join(geog_data_res_list)},
 dx = {dx1},
 dy = {dy1},
 map_proj = '{map_proj}',
 ref_lat = {ref_lat},
 ref_lon = {ref_lon},
 truelat1 = {truelat1},
 truelat2 = {truelat2},
 stand_lon = {stand_lon},
 geog_data_path = {geog_data_path}
/

&ungrib
 out_format = 'WPS',
 prefix = 'FILE',
/

&metgrid
 fg_name = 'FILE'
/
"""
    st.code(namelist_content, language='fortran')
    st.download_button(
        label="Download namelist.wps",
        data=namelist_content,
        file_name="namelist.wps",
        mime="text/plain"
    )
ドメインの表示および,プレーンテキストでの表示機能があります.
4. GRIB2ファイルのリンク
プロジェクトディレクトリに移動し,GRIB2ファイルへのリンクを作成します:
cd ~/WRF/WPS-4.6.0/RUN/run_project_20250603
../../link_grib.csh ../../../GSM_DATA/
リンク後,GRIBFILE.AAAなどが生成されていれば成功です.
実行まで行くとかなり長くなりそうですので,次は「その2(WPS編)」で,以下の順にWPSの各処理(geogrid.exe,ungrib.exe,metgrid.exe)を順に実行していきます.