はじめに
これまでインフラ管理の主流は IaC(Infrastructure as Code) でした。
Terraform、Ansible、CloudFormation などのツールを使い、
「インフラをコード化して再現性を高める」ことが目的でした。
しかし今、私たちはさらにその先――
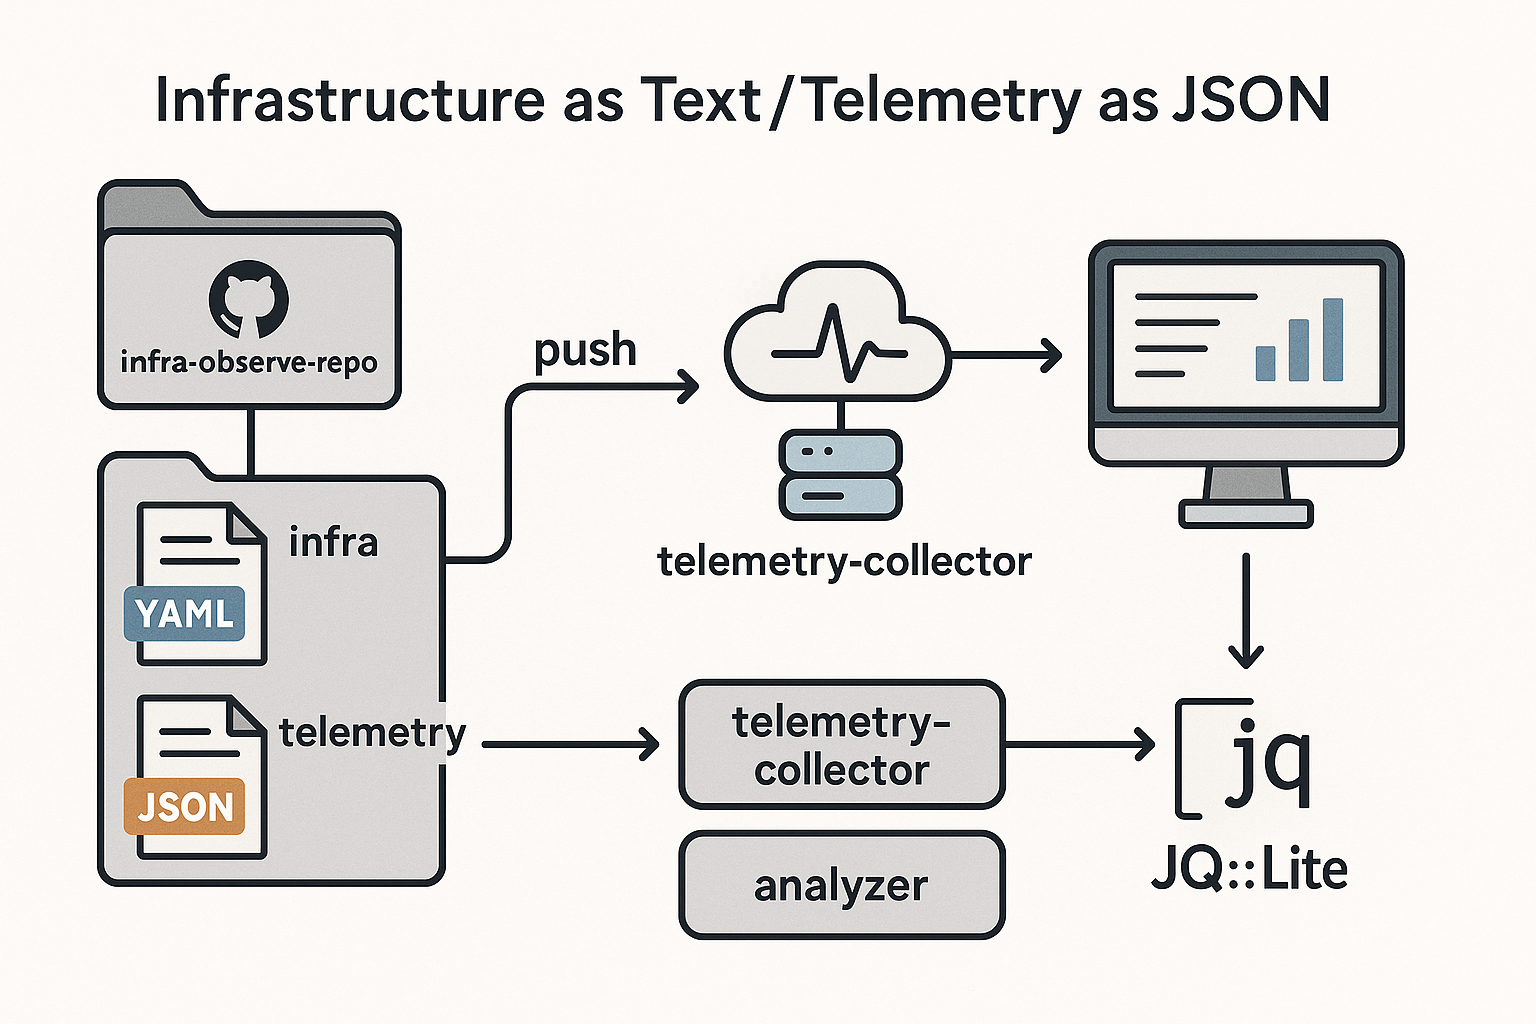
Infrastructure as Text / Telemetry as JSON
という新しい世界に進もうとしています。
この記事では、その概念と構成例、運用のイメージを解説します。
1. IaCの限界と次の段階「Infrastructure as Text」
IaCの課題
IaCは非常に強力ですが、いくつかの問題があります:
- 独自DSL(ドメイン固有言語)で人間が読みにくい
- 実際の状態は「stateファイル」に隠れており可視化が難しい
- ツール間の互換性が低く、統合的な分析が困難
Infrastructure as Textとは
Infrastructure as Text とは、
「インフラの設定・関係性・ポリシーをすべてテキストで管理する」考え方です。
つまり、JSON / YAML / Markdown などの人が読める形式で
すべての構成情報を記述し、Gitで履歴管理します。
特徴
- 透明性:変更履歴が誰でも追える
- ポータブル:異なるツールへの変換が容易
- AI対応:テキストとして自然言語処理に利用可能
2. 「Telemetry as JSON」:監視データをテキストで扱う
従来の監視システムは、専用UIやグラフ中心の世界でした。
今後は、監視データそのものを JSON テキストで保存・解析します。
例:仮想マシンのCPUメトリクス
[
  { "vm_id": "vm001", "cpu_usage": 72.5, "timestamp": "2025-10-25T14:00:00Z" },
  { "vm_id": "vm002", "cpu_usage": 83.2, "timestamp": "2025-10-25T14:00:00Z" },
  { "vm_id": "vm003", "cpu_usage": 61.8, "timestamp": "2025-10-25T14:00:00Z" }
]
このような形式で保存すれば:
- jq や Perl (
JQ::Lite) で簡単に分析可能 - Gitでバージョン管理できる
- 構成ファイルと監視結果を1つのリポジトリで比較可能
3. Git上での実践構成例
infra-observe-repo/
├── infra/                   # Infrastructure as Text
│   ├── compute/
│   │   ├── cluster-a.yml
│   │   └── cluster-b.yml
│   ├── network/
│   │   └── gtm-config.md
│   └── storage/
│       └── s3-policy.yml
│
├── telemetry/               # Telemetry as JSON
│   ├── cpu/
│   │   ├── cluster-a-2025-10-25.json
│   │   └── cluster-b-2025-10-25.json
│   └── memory/
│       └── cluster-a-2025-10-25.json
│
├── analysis/
│   ├── jq/
│   │   ├── high_cpu_nodes.jq
│   │   └── drift_detect.jq
│   └── perl/
│       └── analyze_telemetry.pl
│
└── .github/workflows/
    ├── telemetry-collector.yml
    └── analyzer.yml
サンプル:infra/compute/cluster-a.yml
region: ap-northeast
cluster: cluster-a
vm_count: 150
os: rocky8
cpu_type: "AMD EPYC 7763"
memory_per_vm_gb: 16
monitoring:
  enabled: true
  endpoint: https://metrics.example.com/api/cluster-a
4. 運用フロー(GitOps × TextOps × DataOps)
-
構成定義
- YAML/JSON/Markdownで記述
- Pull Requestでレビュー
- Merge時に自動デプロイ
-
監視データ収集
- JSON形式でメトリクスを保存
- GitHub Actionsなどで定期コミット
-
分析
- jq や Perlスクリプトで解析
- Markdownレポート自動生成
-
ドリフト検出
- 「理想の構成」と「実際の状態(JSON)」を比較して差分報告
5. jq / JQ::Lite による解析例
高CPUノード検出(jq)
analysis/jq/high_cpu_nodes.jq:
map(select(.cpu_usage > 80)) | .[]
実行例:
$ jq -f analysis/jq/high_cpu_nodes.jq telemetry/cpu/cluster-a-2025-10-25.json
{
  "vm_id": "vm002",
  "cpu_usage": 83.2,
  "timestamp": "2025-10-25T14:00:00Z"
}
6. メリット比較
| 観点 | IaC 時代 | Infrastructure as Text / Telemetry as JSON 時代 |
|---|---|---|
| 管理対象 | デプロイ構成のみ | 構成 + 状態 + 性能データ |
| 変更追跡 | コードの差分のみ | 状態・性能もGit履歴で追跡 |
| フォーマット | DSL / YAML | テキスト / JSON / Markdown |
| 分析手段 | 専用ツール中心 | jq / JQ::Lite / AI / GitOps |
| ドキュメント性 | 別途整備 | データ自体がドキュメント化 |
| AI連携 | 限定的 | 構成とメトリクスを自然言語解析可能 |
7. この世界の未来像
- インフラの構成・状態・履歴がすべてテキストで見える
- AIが自動で傾向や異常を要約してくれる
- 自然言語で運用会話ができる(例:「東アジアリージョンの高負荷VMを教えて」)
- 構成と実績データの統合管理により、変化の因果を即座に分析
8. まとめ
Infrastructure as Code は「構成をコード化する」第一歩でした。
これからの時代は、
「構成・状態・監視データをテキスト化して一元管理」する時代です。
つまり ―
Infrastructure as Text / Telemetry as JSON = インフラを“読めるデータ”として扱う世界
この思想の延長線上に、
「AIと人間が共同で運用を最適化するインフラ管理」が見えてきます。
📊 図版:Infrastructure as Text / Telemetry as JSON の構成イメージ