ios-App内で簡単にグラフが描画できるios-chartsの使い方について紹介する。
以下参考。
ios-charts: https://github.com/danielgindi/Charts
http://qiita.com/tfutada/items/3bf10ff5369382f4cb5c
http://qiita.com/touyu/items/4fbd6d8187eb74752ba0
http://stackoverflow.com/questions/39531900/how-to-draw-linechartdata-in-swift-3
http://www.appcoda.com/ios-charts-api-tutorial/
ios-chartsのインストール
今回はcocoapodsを使ってインストールする。
Podfileに
platform :ios, '10.3'
use_frameworks!

target 'MySampleApp' do
  pod 'Charts'
end
を加えて$ pod installで実行
グラフの作成方法
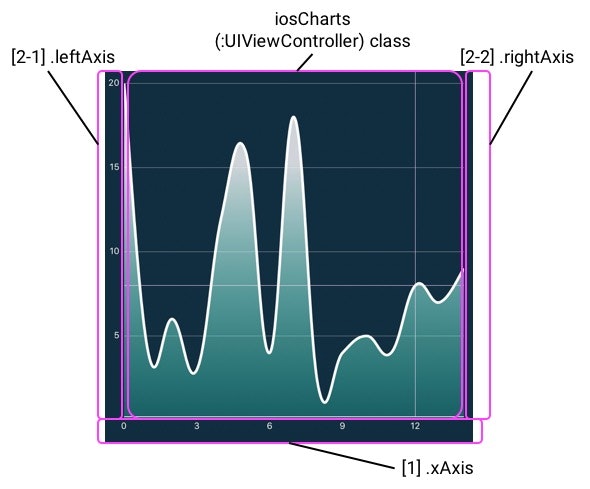
今回は基本的にLineChartsViewのグラフ(以下に示す)を作成する。
UI設定に一部LineChartsView専用のものもあるが基本的にx軸、y軸に関しては他のグラフの場合も同様。Xcodeの補完機能を使用することでわかる。
今回紹介するグラフ例を以下に示す。(各設定項目についても記載する)

ソースコード (後に解説記載)
import Foundation
import UIKit
import Charts

class iosCharts: UIViewController {

    let temperature = [20.0, 4.0, 6.0, 3.0, 12.0, 16.0, 4.0, 18.0, 2.0, 4.0, 5.0, 4.0]

    //LineChart to get graph of time and temperature History
    @IBOutlet var iosChartsFigure: LineChartView! {
        didSet {
            //x軸設定
            iosChartsFigure.xAxis.labelPosition = .bottom //x軸ラベル下側に表示
            iosChartsFigure.xAxis.labelFont = UIFont.systemFont(ofSize: 11) //x軸のフォントの大きさ
            iosChartsFigure.xAxis.labelCount = Int(5) //x軸に表示するラベルの数
            iosChartsFigure.xAxis.labelTextColor = #colorLiteral(red: 1, green: 1, blue: 1, alpha: 1) //x軸ラベルの色
            iosChartsFigure.xAxis.axisLineColor = #colorLiteral(red: 1, green: 1, blue: 1, alpha: 1) //x軸の色
            iosChartsFigure.xAxis.axisLineWidth = CGFloat(1) //x軸の太さ
            iosChartsFigure.xAxis.drawGridLinesEnabled = false //x軸のグリッド表示(今回は表示しない)
            iosChartsFigure.xAxis.valueFormatter = lineChartFormatter() //x軸の仕様


            //y軸設定
            iosChartsFigure.rightAxis.enabled = false //右軸(値)の表示
            iosChartsFigure.leftAxis.enabled = true //左軸(値)の表示
            iosChartsFigure.leftAxis.axisMaximum = 40 //y左軸最大値
            iosChartsFigure.leftAxis.axisMinimum = 0 //y左軸最小値
            iosChartsFigure.leftAxis.labelFont = UIFont.systemFont(ofSize: 11) //y左軸のフォントの大きさ
            iosChartsFigure.leftAxis.labelTextColor = #colorLiteral(red: 1, green: 1, blue: 1, alpha: 1) //y軸ラベルの色
            iosChartsFigure.leftAxis.axisLineColor = #colorLiteral(red: 0.05882352963, green: 0.180392161, blue: 0.2470588237, alpha: 1) //y左軸の色(今回はy軸消すためにBGと同じ色にしている)
            iosChartsFigure.leftAxis.drawAxisLineEnabled = false //y左軸の表示(今回は表示しない)
            iosChartsFigure.leftAxis.labelCount = Int(4) //y軸ラベルの表示数
            iosChartsFigure.leftAxis.drawGridLinesEnabled = true //y軸のグリッド表示(今回は表示する)
            iosChartsFigure.leftAxis.gridColor = #colorLiteral(red: 0.6000000238, green: 0.6000000238, blue: 0.6000000238, alpha: 1) //y軸グリッドの色

            //その他UI設定
            iosChartsFigure.noDataFont = UIFont.systemFont(ofSize: 30) //Noデータ時の表示フォント
            iosChartsFigure.noDataTextColor = #colorLiteral(red: 1, green: 1, blue: 1, alpha: 1) //Noデータ時の文字色
            iosChartsFigure.noDataText = "Keep Waiting" //Noデータ時に表示する文字
            iosChartsFigure.legend.enabled = false //"■ months"のlegendの表示
            iosChartsFigure.dragDecelerationEnabled = true //指を離してもスクロール続くか
            iosChartsFigure.dragDecelerationFrictionCoef = 0.6 //ドラッグ時の減速スピード(0-1)
            iosChartsFigure.chartDescription?.text = nil //Description(今回はなし)
            iosChartsFigure.backgroundColor = #colorLiteral(red: 0.05882352963, green: 0.180392161, blue: 0.2470588237, alpha: 1) //Background Color
            iosChartsFigure.animate(xAxisDuration: 1.2, yAxisDuration: 1.5, easingOption: .easeInOutElastic)//グラフのアニメーション(秒数で設定)
        }
    }


    override func viewDidLoad() {
        super.viewDidLoad()

        drawLineChart(xValArr: months, yValArr: temperature)

    }

    //グラフ描画部分
    func drawLineChart(xValArr: [String], yValArr: [Double]) {

        var yValues : [ChartDataEntry] = [ChartDataEntry]()

        for i in 0 ..< xValArr.count {
            let dataEntry = ChartDataEntry(x: Double(i), y: yValArr[i])
            yValues.append(dataEntry) //(ChartDataEntry(x: Double(i), y: dollars1[i]))
        }

        let data = LineChartData()
        let ds = LineChartDataSet(values: yValues, label: "Months") //ds means DataSet

        ////グラフのUI設定
        //グラフのグラデーション有効化
        let gradientColors = [#colorLiteral(red: 1, green: 1, blue: 1, alpha: 1).cgColor, #colorLiteral(red: 0.2196078449, green: 1, blue: 0.8549019694, alpha: 1).withAlphaComponent(0.3).cgColor] as CFArray // Colors of the gradient
        let colorLocations:[CGFloat] = [0.7, 0.0] // Positioning of the gradient
        let gradient = CGGradient.init(colorsSpace: CGColorSpaceCreateDeviceRGB(), colors: gradientColors, locations: colorLocations) // Gradient Object

        ds.fill = Fill.fillWithLinearGradient(gradient!, angle: 90.0) // Set the Gradient


        //その他UI設定
        ds.lineWidth = 3.0 //線の太さ
        //ds.circleRadius = 0 //プロットの大きさ
        ds.drawCirclesEnabled = false //プロットの表示(今回は表示しない)
        ds.mode = .cubicBezier //曲線にする
        ds.fillAlpha = 0.8 //グラフの透過率(曲線は投下しない)
        ds.drawFilledEnabled = true //グラフ下の部分塗りつぶし
        //ds.fillColor = #colorLiteral(red: 1, green: 1, blue: 1, alpha: 1) //グラフ塗りつぶし色
        ds.drawValuesEnabled = false //各プロットのラベル表示(今回は表示しない)
        ds.highlightColor = #colorLiteral(red: 1, green: 0.8392156959, blue: 0.9764705896, alpha: 1) //各点を選択した時に表示されるx,yの線
        ds.colors = [#colorLiteral(red: 1, green: 1, blue: 1, alpha: 1)] //Drawing graph
        ////グラフのUI設定

        data.addDataSet(ds)

        self.iosChartsFigure.data = data
    }


    override func didReceiveMemoryWarning() {
        super.didReceiveMemoryWarning()

    }
}

//x軸のラベルを設定する
public class BarChartFormatter: NSObject, IAxisValueFormatter{
    let months: [String]! = ["Jan", "Feb", "Mar", "Apr", "May", "Jun", "Jul", "Aug", "Sep", "Oct", "Nov", "Dec"]

    public func stringForValue(_ value: Double, axis: AxisBase?) -> String {
        // 0 -> Jan, 1 -> Feb...
        return months[Int(value)]
    }
}
各項目の設定について
[1] .xAxisの設定について (iosChartsFigure.xAxisに続く形で記載)
-
.labelPosition = .bottomx軸ラベル下側に表示 -
.labelFont = UIFont.systemFont(ofSize: <FontSizeNum>)x軸のフォントの大きさをで指定 -
.labelCount = Int(<Num>)x軸に表示するラベルの数をNumで指定。上記グラフでは5つに設定 -
.labelTextColor = #colorLiteral(red: <NumA>, green: <NumB>, blue: <NumC>, alpha: <NumD>)x軸ラベルの色及び透過度をNumA-C, Dで設定 -
.axisLineColor = #colorLiteral(red: <NumA>, green: <NumB>, blue: <NumC>, alpha: <NumD>)x軸の色及び透過度をNumA-C, Dで設定 -
.axisLineWidth = CGFloat(<Num>)x軸の線の太さをNumで指定 -
.drawGridLinesEnabled = <True or False>x軸のグリッド表示(True: 表示する、False: 表示しない) -
.valueFormatter = lineChartFormatter()x軸の表示を指定(lineChartFormatterクラスを今回は指定。ソースコードの下部にあるクラスで、各1.0, 2.0,...をJan, Feb,...と表示する)
[2-1, 2] .rightAxis, .leftAxisの設定について(iosChartsFigure.right/leftAxisに続く形で記載)
-
.enabled = <True or False>各軸の値の表示(True: 表示する、False: 表示しない) -
.axisMaximum = <Num>軸最大値をNumで設定 -
.axisMinimum = <Num>軸最小値をNumで設定 -
.labelFont = UIFont.systemFont(ofSize: <Num>)左軸のフォントの大きさをNumで設定 -
.labelTextColor = #colorLiteral(red: <NumA>, green: <NumB>, blue: <NumC>, alpha: <NumD>)
軸ラベルの色及び透過度をNumA-C, Dで設定 -
.axisLineColor = #colorLiteral(red: <NumA>, green: <NumB>, blue: <NumC>, alpha: <NumD>)軸の色及び透過度をNumA-C, Dで設定 -
.drawAxisLineEnabled = <True or False>軸線の表示(True: 表示する、False: 表示しない) -
.labelCount = Int(<Num>)軸ラベルの表示数をNumで設定 -
.drawGridLinesEnabled = <Treu or False>y軸のグリッド表示(True: 表示する、False: 表示しない) -
.leftAxis.gridColor = #colorLiteral(red: <NumA>, green: <NumB>, blue: <NumC>, alpha: <NumD>)y軸グリッドの色及び透過度をNumA-C, Dで設定 -
.drawTopYLabelEntryEnabled = <True or False>y軸の最大値のみ表示(True: 表示する、False: 表示しない)
その他UI設定(1) (iosChartsFigureに続く形で記載)
-
.noDataFont = UIFont.systemFont(ofSize: <Num>)データが存在しない場合の表示フォントサイズをNumで指定 -
.noDataTextColor = #colorLiteral(red: <NumA>, green: <NumB>, blue: <NumC>, alpha: <NumD>)データが存在しない場合の文字色及び透過度をNumA-C, Dで設定 -
.noDataText = <message>データが存在しない場合に表示する文字をmessageで指定 -
.legend.enabled = <True or False>//"■ Legend"のlegend表示(True: 表示する、False: 表示しない) -
.dragDecelerationEnabled = <True or False>//指を離してもスクロール続くか(True: 設定する、False: 設定しない) -
.dragDecelerationFrictionCoef = <Num>//ドラッグ時の減速スピード(Numを0-1の間で指定) -
.chartDescription?.text = <Description>グラフのDescriptionを**Desciprtion **(またはnil)で指定 -
.backgroundColor = #colorLiteral(red: <NumA>, green: <NumB>, blue: <NumC>, alpha: <NumD>)Backgroundの色及び透過度をNumA-C, Dで設定 -
.animate(xAxisDuration: 1.2, yAxisDuration: 1.5, [option])グラフのアニメーションを(秒数)で設定 *[option] easingOption: .easeInOutElastic, .endAppearanceTransition()
その他UI設定(2) (グラフ線について)
今回は各値を格納したds(dataset)について説明する(dsに続く形で記載)
-
.lineWidth = <Num>グラフ線の太さをNumで指定 -
.drawCirclesEnabled = <True or False>グラフのプロットを表示(True: 表示する、False: 表示しない) -
.circleRadius = <Num>プロットの大きさをNumで指定 -
.mode = .cubicBezierグラフを曲線にする(デフォルトでは直線) -
.fillAlpha = <Num>グラフの透過率をNumで設定(描画されている曲線自体は透過しない) -
.drawFilledEnabled = <True or False>グラフ曲線下の部分の塗りつぶしについて(True: 塗りつぶす、False: 塗りつぶさない) -
.fillColor = #colorLiteral(red: <NumA>, green: <NumB>, blue: <NumC>, alpha: <NumD>)グラフ塗りつぶし色及び透過度をNumA-C, Dで設定。ただし.drawFilledEnabled = trueになっている必要がある) -
.drawValuesEnabled = <True or False>各プロットの数値のラベル表示(True: 表示する、False: 表示しない) - .highlightColor = #colorLiteral(red: , green: , blue: , alpha: ) 各点を選択した時に表示されるx,yの線の色及び透過度をNumA-C, Dで設定
-
.colors = #colorLiteral(red: <NumA>, green: <NumB>, blue: <NumC>, alpha: <NumD>)グラフ線の色及び透過度をNumA-C, Dで設定 - グラフ線下部のグラデーション設定について
let gradientColors = [#colorLiteral(red: <NumA>, green: <NumB>, blue: <NumC>).cgColor, #colorLiteral(red: <NumA>, green: <NumB>, blue: <NumC>).withAlphaComponent(<NumD>).cgColor] as CFArrayによりグラデーション色及び透過度をNumA-C, Dで設定
let colorLocations:[CGFloat] = [<NumFrom>, <NumTo>]FromからToの範囲で色の設定
let gradient = CGGradient.init(colorsSpace: CGColorSpaceCreateDeviceRGB(), colors: gradientColors, locations: colorLocations)グラデーション配列の設定
ds.fill = Fill.fillWithLinearGradient(gradient!, angle: <angle>)グラデーションをつける角度をangle(0-360)で設定