#目的
swiftでのios開発時に、グラフやチャートの表示にめっちゃ使えるライブラリ、ios-chartsの使い方をメモっておこうと思います。
#ios-chartsとは
Daniel Cohen Gindi氏作成のチャート、グラフ表示を簡単にするライブラリ。
- Github: danielgindi/ios-charts
- デモ: ios-charts/ChartsDemo/
#インストール
CocoaPodsを使用。
Podfileに以下を記述
platform :ios, '9.0'
pod 'Charts'
use_frameworks!
#できること
##グラフ、チャートの表示
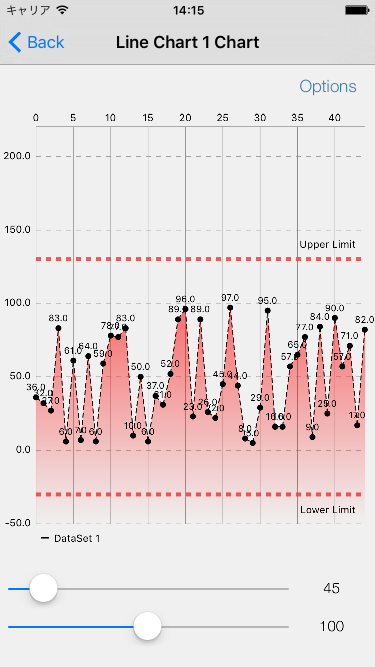
Line Chart (折れ線グラフ)
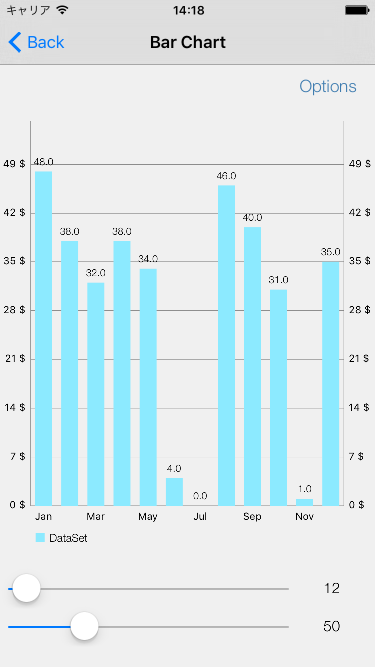
Bar Chart (棒グラフ)
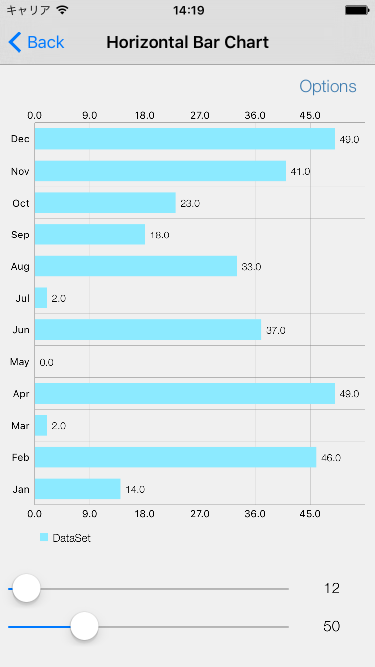
Horizontal Bar Chart (横棒グラフ)
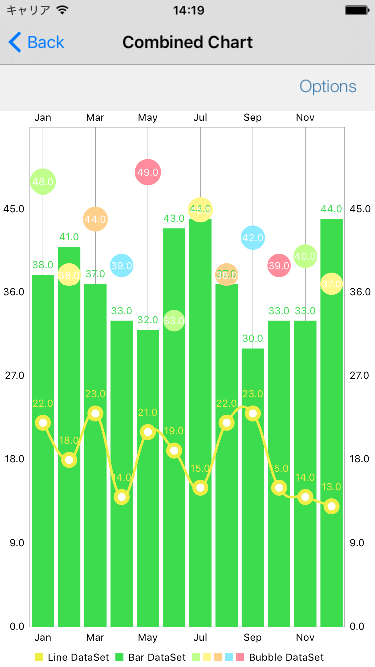
Combined Chart (コンビネーショングラフ)
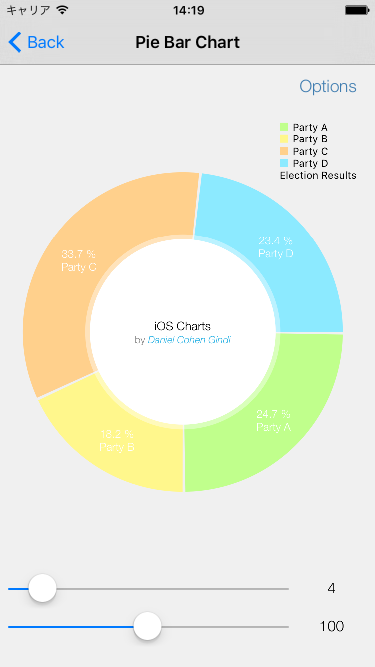
Pie Chart (円グラフ)
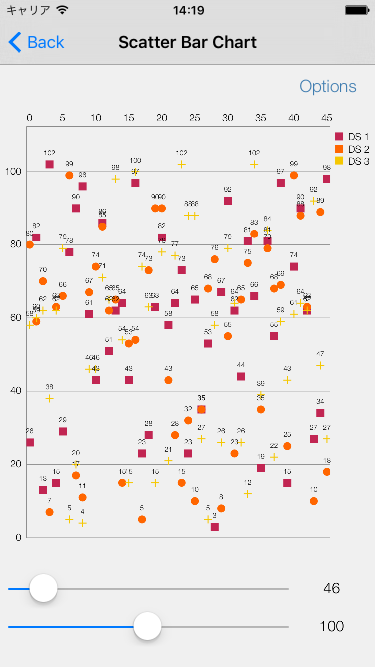
Scatter Bar Chart (散布図)
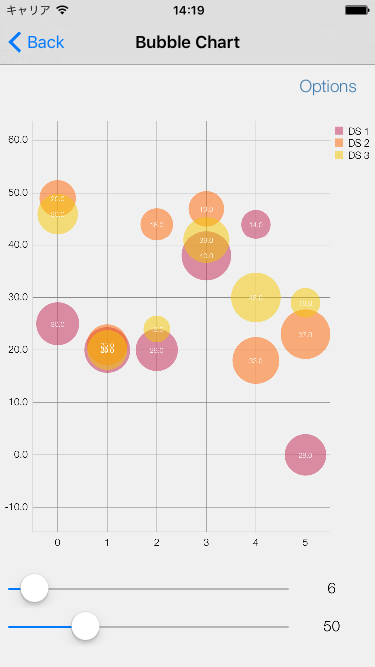
Bubble Chart (バブルチャート)
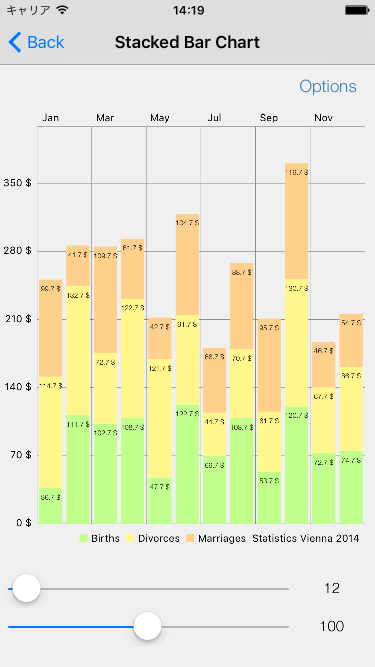
Stacked Bar Chart (積み上げ棒グラフ)
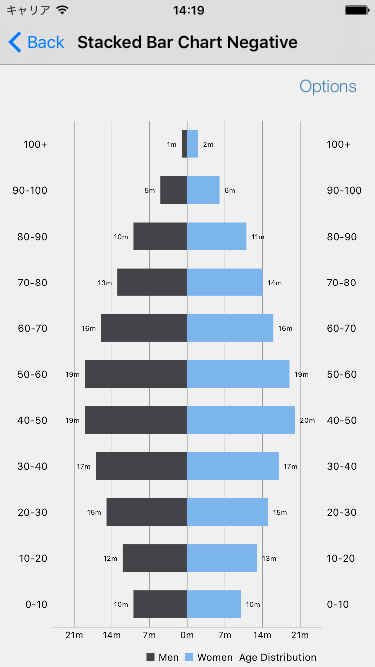
Stacked Bar negative Chart (積み上げ横棒グラフ、人口ピラミッドグラフ)
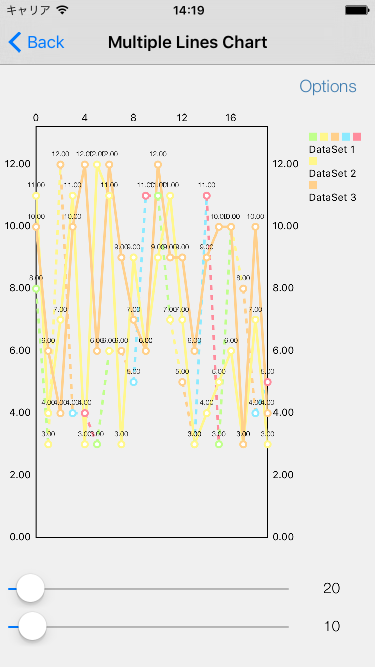
Multiple Line Chart (複数の折れ線グラフ)
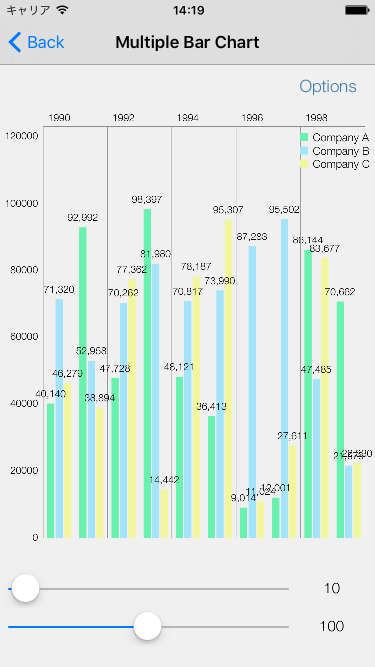
Multiple Bar Chart (複数の棒グラフ)
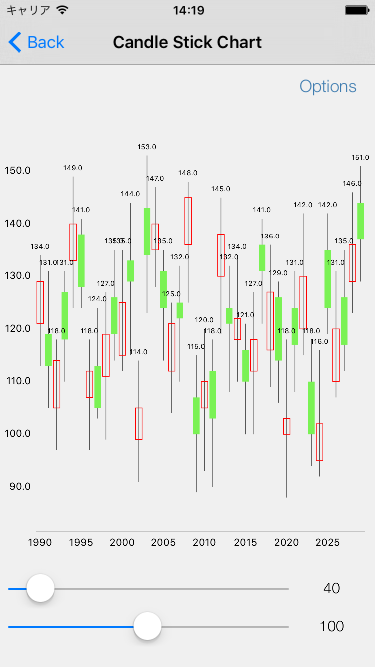
Candle Stick Chart (ローソク足チャート)
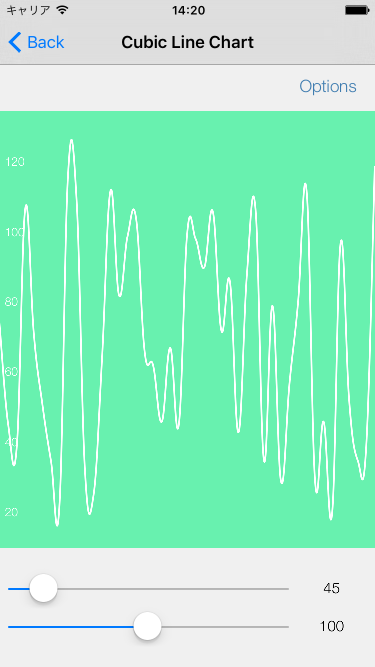
Cubic Line Chart
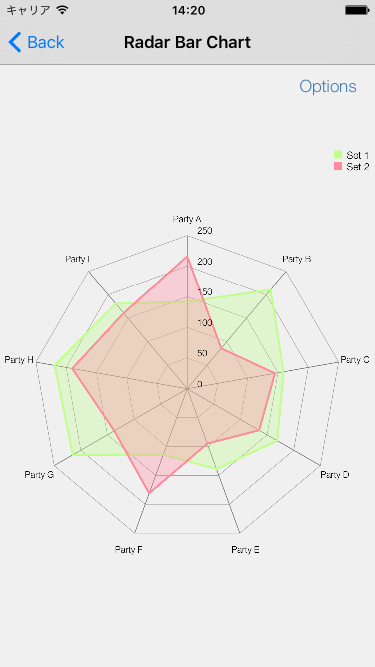
Radar Bar Chart (レーダーチャート)
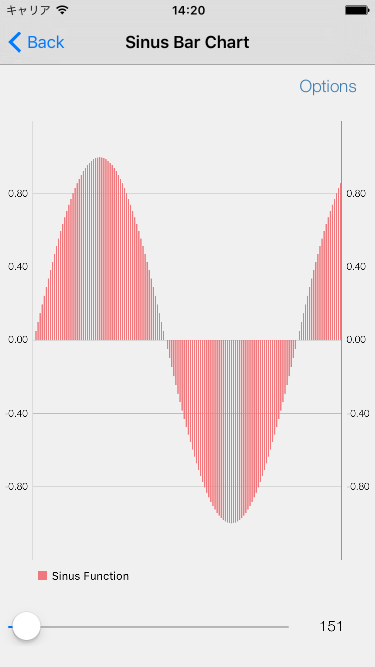
Sinus Bar Chart
#使用例
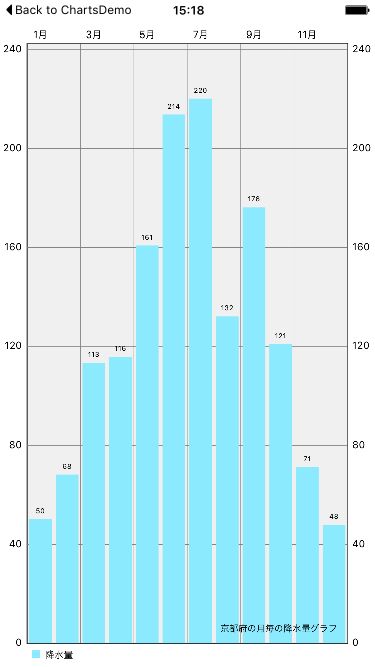
完成図
コード
storyboardにViewを配置する。
ViewのCustom ClassにBarChartViewを指定し、コードにIBOutletで接続。
@IBOutlet var barChartView: BarChartView!
最終的には以下のように記述。
import UIKit
import Charts

class ViewController: UIViewController {

    // storyboardから接続
    @IBOutlet weak var barChartView: BarChartView!

    var months: [String]!

    override func viewDidLoad() {
        super.viewDidLoad()

        months = ["1月", "2月", "3月", "4月", "5月", "6月", "7月", "8月", "9月", "10月", "11月", "12月"]
        let unitsSold = [50.3, 68.3, 113.3, 115.7, 160.8, 214.0, 220.4, 132.1, 176.2, 120.9, 71.3, 48.0]

        barChartView.animate(yAxisDuration: 2.0)
        barChartView.pinchZoomEnabled = false
        barChartView.drawBarShadowEnabled = false
        barChartView.drawBordersEnabled = true
        barChartView.descriptionText = "京都府の月毎の降水量グラフ"

        setChart(months, values: unitsSold)
    }

    override func didReceiveMemoryWarning() {
        super.didReceiveMemoryWarning()
    }

    func setChart(dataPoints: [String], values: [Double]) {
        barChartView.noDataText = "You need to provide data for the chart."

        var dataEntries: [BarChartDataEntry] = []

        for i in 0..<dataPoints.count {
            let dataEntry = BarChartDataEntry(value: values[i], xIndex: i)
            dataEntries.append(dataEntry)
        }

        let chartDataSet = BarChartDataSet(yVals: dataEntries, label: "降水量")
        let chartData = BarChartData(xVals: months, dataSet: chartDataSet)
        barChartView.data = chartData
    }

}
#詳細な使用例
[Swift] [iOS] チャート表示ライブラリ [ios-charts] 詳細な使い方 (メソッド、プロパティ)