ポートフォリオの最適化には様々な手法がありますが、最適化実装までの記事や参考書では分散最小化モデルが数多く取り上げられている一方で、投資家のリスク選考を反映した最適化については紹介されていなかったのでここでまとめてみました。
Over View:
- Pythonでポートフォリオ最適化の実装
- 投資家の意思決定に基づいた最適投資割合の導出
Key Word:
- トービンの分離定理, 相対的リスク回避度, 無差別曲線, 資本市場線, 効率的ポートフォリオ
1.ポートフォリオ最適化とは・・・
まず初めにポートフォリオ理論とは、
現代ポートフォリオ理論(げんだいポートフォリオりろん、英: Modern portfolio theory, MPT)とは、金融資産への投資比率(ポートフォリオ)を決定する理論。1952年にハリー・マーコウィッツによって発表された論文[1]を端緒として研究が進められた。投資におけるポートフォリオの収益率の平均 (期待値) と分散のみをコントロールするという特徴がある。
(引用元 : Wikipedia)
ポートフォリオ理論とは、金融資産の収益率に着眼点を置き、それの平均(リターン)と変動のばらつき(リスク)を基にポートフォリオを決定する理論になります。
どの投資家にも、リスクを最小化しながらリターンを得るという考えが共通してあります。
こういった投資家の合理性を活用し、ポートフォリオ理論に基いて最適なポートフォリオを導き出すことをポートフォリオ最適化と呼んでいます。
2.ポートフォリオ理論についての参考URL
3.最適化までの流れ
step1.資本市場線の導出
step2.投資家の無差別曲線の導出
step3.最適投資割合の導出
3-1.資本市場線の導出
トービンの分離定理より、$\sigma$-$\mu$平面(リスク-リターン平面)上でマーケットポートフォリオから無リスク資産に引いた線を資本市場線と言います。
以下のような式で表されます。
$$\mu = b\sigma + r_f\tag{1}$$
($b$は資本市場線の傾き)
全ての投資家は、この資本市場線上で投資を行うことが、ポートフォリオ理論での前提となる考えとなります。
3-2.投資家の無差別曲線の導出
無差別曲線はそれぞれの線上で投資家の期待効用が等しくなります。(等高線に似てます)
リターンが大きいほどそしてリスクが小さいほど、投資家の期待効用が大きくります。
投資家の効用関数から無差別曲線を導出することができますが、効用関数の推定が難しいため無差別曲線は以下の式で表されることがあります。
$$ \mu = \frac{1}{2}\lambda\sigma^{2} + u \tag{2}$$
~記号の説明~
$\mu$: 期待リターン
$\sigma$: リターンの標準偏差
$\lambda$: 相対的リスク回避度
$u$: 期待効用
今回はこの式を用いて無差別曲線を導出しました。
$\lambda$ の推定には、以下の式を用いました。
$$ \lambda = \frac{\mu_{total} - r_f}{\alpha\sigma_{total}^{2}} $$
~記号の説明~
$\mu_{total}$: 危険資産全体の期待リターン
$\sigma_{total}$: 危険資産全体のリターンの標準偏差
$r_f$: リスクフリーレート
$\alpha$: 危険資産保有割合
危険資産全体のリターンの期待値・標準偏差は以下の通りです。
$$ \mu_{total} = \sum_{i=1}^{n}w_i\mu_i $$
$$\sigma_{total} = \sqrt{\sum_{i=1}^{n}\sum_{j=1}^{n}w_i w_j\sigma_i\sigma_j}$$
$$ \sum_{i=1}^{n}w_i = 1 $$
~記号の説明~
$\mu_{k}$: 銘柄 $k$ の期待リターン
$\sigma_{k}$: 銘柄 $k$ のリターンの標準偏差
$w_k$: 銘柄 $k$ への投資割合
この式の数学的な説明は、以下の記事に記載しています。
3-3.最適投資割合の導出
資本市場線上で、投資家の期待効用が最も大きい箇所で投資を行うことが最適です。
つまり、無差別曲線と資本市場線が一つに交わる点が最適なポートフォリオになります。
交わる点座標( $\sigma_{opt}$, $\mu_{opt}$,)を(1)(2)式に代入し、右辺どうしを比較すると、
$$\frac{1}{2}\lambda\sigma_{opt}^{2} + u = b\sigma_{opt} + r_f$$
$\sigma_{opt}$について解の公式から重解を求めることで、
$$\sigma_{opt} = \frac{b}{\lambda} \tag{3}$$
また、無リスク資産のリスクは0であることから
$$\sigma_{opt} = a_{opt} \times \sigma_{p} + (1 - a_{opt}) \times 0 $$
$$\Longleftrightarrow a_{opt} = \frac{\sigma_{opt}}{\sigma_{p}} \tag{4} $$
4.実装
4-0.データの用意
今回は5種類の銘柄 (マクド・ソニー・東エレ・ファストリ・SBG) を対象商品とします。
stooqで銘柄コードから銘柄情報を取得します。こちらは、APIキー取得は不要。
終値のみを分析対象としています。
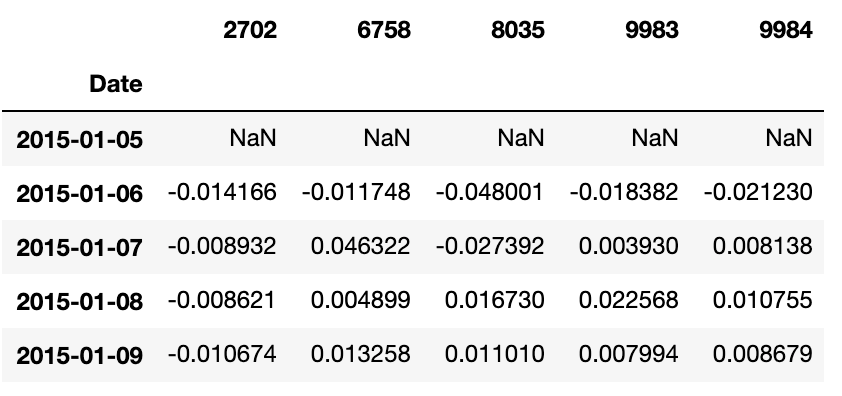
pct_changeメソッドを使うことで、株価変化率 (リターン) をdfに格納しています。
import numpy as np
import scipy.optimize as sco
import scipy.interpolate as sci
import matplotlib as mpl
import matplotlib.pyplot as plt
import datetime
import pandas as pd
import pandas_datareader.stooq as stooq
import cvxpy as cvx
def get_stockvalues_tokyo(stockcode, start, end):
    """
    stockcode: market code of each target stock (ex. "NNNN") defined by the Tokyo stock market.
    start, end: datetime object
    """
    # Get index data from https://stooq.com/
    df = stooq.StooqDailyReader(f"{stockcode}.jp", start, end).read()
    df = df.sort_values(by='Date',ascending=True)
    df = df.pct_change()
    return df

def get_paneldata_tokyo(stockcodes, start, end):
    # Use "Close" value only
    dfs = []
    for sc in stockcodes:
        df = get_stockvalues_tokyo(sc, start, end)[['Close']]
        df = df.rename(columns={'Close': sc})
        dfs.append(df)
    df_concat = pd.concat(dfs, axis=1)
    df_concat.index = pd.to_datetime(df_concat.index)
    return df_concat

start = datetime.datetime(2015, 1, 1)
end = datetime.datetime(2020, 12, 31)

## マクド・ソニー・東エレ・ファストリ・SBG
stockcodes=["2702", "6758", "8035", "9983", "9984"]
stock_len=len(stockcodes)

df = get_paneldata_tokyo(stockcodes, start, end)
df.head()

リターンデータを基に、年率のリターン期待値・共分散を求めます。
期待リターンの推定値 : 過去の終値騰落率の平均値
期待リスクの推定値 : ヒストリカルボラティリティ
今回は、リスクフリーレート($r_f$)を3%としています。
Mu = df.mean().values * 245
Covs = df.cov().values * 245
rf = 0.03
4-1.資本市場線の実装
最適化問題を解くためのPythonライブラリ「cvxpy」を使って、マーコビッツの平均分散モデルを解くことで効率的ポートフォリオが得られます。
そこからシャープレシオが最大の箇所をマーケットポートフォリオであり、$r_f$に向けて資本市場線を引きます。
Weight = cvx.Variable(Mu.shape[0])
Target_Return = cvx.Parameter(nonneg=True)
Risk_Variance = cvx.quad_form(Weight,Covs)
constraints=[Weight.T@Mu == Target_Return,
            cvx.sum(Weight) == 1.0,
            Weight >= 0.0]
Opt_Portfolio = cvx.Problem(cvx.Minimize(Risk_Variance),constraints)

V_Target = np.linspace(max(Mu.min(),rf), Mu.max(), num=1000)
V_Risk = np.zeros(V_Target.shape)
V_Weight = np.zeros((V_Target.shape[0], Mu.shape[0]))

for idx, Target_Return.value in enumerate(V_Target):
    Opt_Portfolio.solve()
    V_Weight[idx,:]=Weight.value.T
    V_Risk[idx]=np.sqrt(Risk_Variance.value)

# シャープレシオ
grads = (V_Target-rf)/V_Risk  # gradients

# マーケットポートフォリオ
i_P = grads.argmax()
grad_P = grads[i_P]
sigma_P = V_Risk[i_P]
weight_P = V_Weight[i_P]
mu_P = V_Target[i_P]

## plot ##
x = np.linspace(0, np.sqrt(np.diagonal(Covs)).max(), 100)
y = grad_P*x + rf # 資本市場線
plt.figure(figsize=(8, 6))
plt.plot(V_Risk, V_Target, color='#007ee6', lw=4.0, label='Efficient Frontier')
plt.plot(x, y, color='#b7282e', label='Capital Market Line')
plt.plot(np.sqrt(np.diagonal(Covs)), Mu, 'kx', label='Individual Assets')
plt.plot(sigma_P, mu_P, 'ko', label='Market Portfolio')
plt.legend(loc='best')
plt.xlim(-0.02, 0.4)
plt.ylim(-0.02, 0.4)
plt.axhline(0, color='k', ls='--', lw=2.0)
plt.axvline(0, color='k', ls='--', lw=2.0)
plt.xlabel('expected volatility')
plt.ylabel('expected return')
plt.show()
資本市場線の傾きは、
grad_P
1.0344591798031708
です。
4-2.投資家の無差別曲線の実装
相対的リスク回避度を求めるためには、投資家固有の
- a : 現在の危険資産保有率
- weights : 現在の各銘柄投資割合
が必要となりますが、今回はそれぞれ乱数を与えて初期値を設定しておきます。
def rra_calc(Mu, Covs, weights, rf, a):
    mu_total = weights.dot(Mu)
    var_total = np.dot(weights.dot(Covs), weights.T)
    return (mu_total - rf)/(var_total*a)

np.random.seed(999)
weights = np.random.random(len(stockcodes))
weights /= np.sum(weights)
a = np.random.random(1)[0]
rra = rra_calc(Mu, Covs, weights, rf, a)

### plot ###
def u(x, rra, u):
    return (1/2)*rra*x**2 + u

x = np.linspace(0, np.sqrt(np.diagonal(Covs)).max(), 100)
plt.figure(figsize=(8, 6))
plt.plot(x, u(x, rra, 0.2), color="olive", linestyle="dotted", label="0.2")
plt.plot(x, u(x, rra, 0.13), color="g", linestyle="dotted", label="0.13")
plt.plot(x, u(x, rra, 0.069), color="purple", linestyle="dotted", label="0.069")
plt.plot(x, u(x, rra, 0.04), color="navy", linestyle="dotted", label="0.04")
plt.legend(loc='best', frameon=False, title="utility")
plt.xlim(-0.02, 0.4)
plt.ylim(-0.02, 0.4)
plt.axhline(0, color='k', ls='--', lw=2.0)
plt.axvline(0, color='k', ls='--', lw=2.0)
plt.xlabel('expected volatility')
plt.ylabel('expected return')
plt.show()

この無差別曲線から、リターンが大きいほど・リスクが小さいほど、投資家の期待効用が大きくなっていることが分かります。
4-3.最適投資割合の実装
解の公式から、無差別曲線と資本市場線が一つに交わる点を求めます。
(3)(4)式から、危険資産の最適投資割合を求めています。
sigma_opt = grad_P / rra
a_opt = sigma_opt / sigma_P
mu_opt = (1 - a_opt)*rf + a_opt*mu_P

### plot ###
x = np.linspace(0, np.sqrt(np.diagonal(Covs)).max(), 100)
plt.figure(figsize=(8, 6))
plt.plot(x, u(x, rra, 0.2), color="olive", linestyle="dotted")
plt.plot(x, u(x, rra, 0.13), color="g", linestyle="dotted")
plt.plot(x, u(x, rra, 0.069), color="purple", linestyle="dotted")
plt.plot(x, u(x, rra, 0.04), color="navy", linestyle="dotted")
plt.plot(V_Risk, V_Target,color='#007ee6', lw=3.0)
plt.plot(x, y,color='#b7282e')
plt.plot(np.sqrt(np.diagonal(Covs)), Mu, 'kx')
plt.plot(sigma_P, mu_P, 'ko')
plt.plot(sigma_opt, mu_opt, 'r*', markersize=15.0)
plt.xlim(-0.02, 0.4)
plt.ylim(-0.02, 0.4)
plt.axhline(0, color='k', ls='--', lw=2.0)
plt.axvline(0, color='k', ls='--', lw=2.0)
plt.xlabel('expected volatility')
plt.ylabel('expected return')
plt.show()
★に投資するのがベストとなります。
a_optは危険資産の最適投資割合なので、マーケットポートフォリオにおける投資割合に乗じることで個別銘柄の最適投資割合が求まります。
np.abs((weight_P * a_opt).round(3))
array([0.121, 0.116, 0.114, 0.007, 0. ])
よって、この投資家にとっての最適投資割合は、
マクド: 12.1%, ソニー: 11.6%, 東エレ: 11.4%, ファストリ: 0.7%, SBG: 0%, 現金: 64.2%
となります!!
5.おまけ
ここでは、モンテカルロ法を用いて資本市場線を実装します。
5-1.資本市場線の実装(Monte Carlo method)
以下の書籍を参考にして執筆しました。
詳しい説明については、この参考書に委ねます。
5-1-1.投資可能集合
各銘柄の投資割合に乱数を発生させ反復試行することで、投資可能集合を生成しています。(モンテカルロ法)
np.random.seed(999)

def port_ret(weights):
    return np.sum(Mu*weights)
def port_vol(weights):
    return np.sqrt(np.dot(weights.T,np.dot(Covs, weights)))

prets = []
pvols = []

for p in range (100000):
    weights = np.random.random(stock_len)
    weights /= np.sum(weights)
    prets.append(port_ret(weights))
    pvols.append(port_vol(weights))
prets = np.array(prets)
pvols = np.array(pvols)

### plot ###
plt.figure(figsize=(10, 6))
plt.scatter(pvols, prets, c=(prets-rf)/pvols, marker='.', cmap='coolwarm')
plt.xlim(-0.02, 0.4)
plt.ylim(-0.02, 0.4)
plt.plot(np.sqrt(np.diagonal(Covs)), Mu, 'kx')
plt.axhline(0, color='k', ls='--', lw=2.0)
plt.axvline(0, color='k', ls='--', lw=2.0)
plt.xlabel('expected volatility')
plt.ylabel('expected return')
plt.colorbar(label='Sharpe ratio')
plt.show()
5-1-2.効率的ポートフォリオ
ここでは、minimize関数を使って以下2つの最小化を行なっています。
・シャープレシオの最大化 (負値の最小化)
・一定の期待リターン下でのリスクの最小化
def min_func_sharpe(weights):
    return -(port_ret(weights) - rf) / port_vol(weights)

# シャープレシオの最大化 (負値の最小化)
cons = ({'type':'eq', 'fun':lambda x: np.sum(x)-1})
bnds = tuple((0,1) for x in range(stock_len))
eweights = np.array(stock_len * [1./stock_len,])

opts = sco.minimize(min_func_sharpe, eweights, method='SLSQP', bounds=bnds, constraints=cons)

cons = ({'type':'eq', 'fun': lambda x: port_ret(x)-tret},
       {'type':'eq', 'fun': lambda x: np.sum(x)-1})
bnds = tuple((0,1) for x in weights)

trets = np.linspace(Mu.min(), Mu.max(), 50)
tvols = []
for tret in trets:
    # 各期待リターン下でのリスクの最小化
    res = sco.minimize(port_vol, eweights, method='SLSQP', bounds=bnds, constraints=cons)
    tvols.append(res['fun'])
tvols = np.array(tvols)

### plot ###
plt.figure(figsize=(10, 6))
plt.scatter(pvols, prets, c=prets / pvols, marker='.', alpha=0.8, cmap='coolwarm')
plt.plot(tvols, trets, 'b', lw=4.0)
plt.plot(port_vol(opts['x']), port_ret(opts['x']), 'y*', markersize=15.0)
plt.xlim(-0.02, 0.4)
plt.ylim(-0.02, 0.4)
plt.axhline(0, color='k', ls='--', lw=2.0)
plt.axvline(0, color='k', ls='--', lw=2.0)
plt.xlabel('expected volatility')
plt.ylabel('expected return')
plt.colorbar(label='Sharpe ratio')
plt.show()
5-1-3.資本市場線
効率的フロンテイアにスプライン補間することで連続微分可能関数を定義します。
その関数を用いて、資本市場線についての連立方程式を解きます。
ind = np.argmin(tvols)
evols = tvols[ind:]
erets = trets[ind:]
tck = sci.splrep(evols, erets)

def f(x):
    return sci.splev(x, tck, der=0)
def df(x):
    return sci.splev(x, tck, der=1)
def equations(p, rf):
    eq1 = rf - p[0]
    eq2 = rf + p[1]*p[2]-f(p[2])
    eq3 = p[1] - df(p[2])
    return eq1, eq2, eq3

opt = sco.fsolve(equations, [0.01, 0.01, 0.01], rf)

### plot ###
plt.figure(figsize=(10, 6))
plt.scatter(pvols, prets, c=(prets-rf) / pvols, marker='.', cmap='coolwarm')
plt.plot(tvols, trets, 'b', lw=4.0)
cx = np.linspace(0.0, Mu.max())
plt.plot(cx, opt[0]+opt[1]*cx, 'r', lw=1.5)
plt.plot(opt[2], f(opt[2]), 'y*', markersize=15.0)
plt.grid(True)
plt.axhline(0, color='k', ls='--', lw=2.0)
plt.axvline(0, color='k', ls='--', lw=2.0)
plt.xlim(-0.02, 0.4)
plt.ylim(-0.02, 0.4)
plt.xlabel('expected volatility')
plt.ylabel('expected return')
plt.colorbar(label='Sharpe ratio')
plt.show()
資本市場線の傾きは、
opt[1]
1.0344560719089742
となり、前述の grad_P とほとんど等しくなり、4-1で引いた資本市場線と似た直線になりました!!
こちらの記事でも、モンテカルロ法を使った最適化が紹介されているので是非参考にしてみてください。


