シリーズ一覧 (更新:2023/2/9)
① 環境構築 ~ 地図の表示
② 地図のスタイルの変更
③ 円のプロット・ラベルの表示
④ 軌跡の可視化 - 基本編
⑤ 軌跡の可視化 - アニメーション編
⑥ 軌跡の可視化 - Space Time Cube編
概要
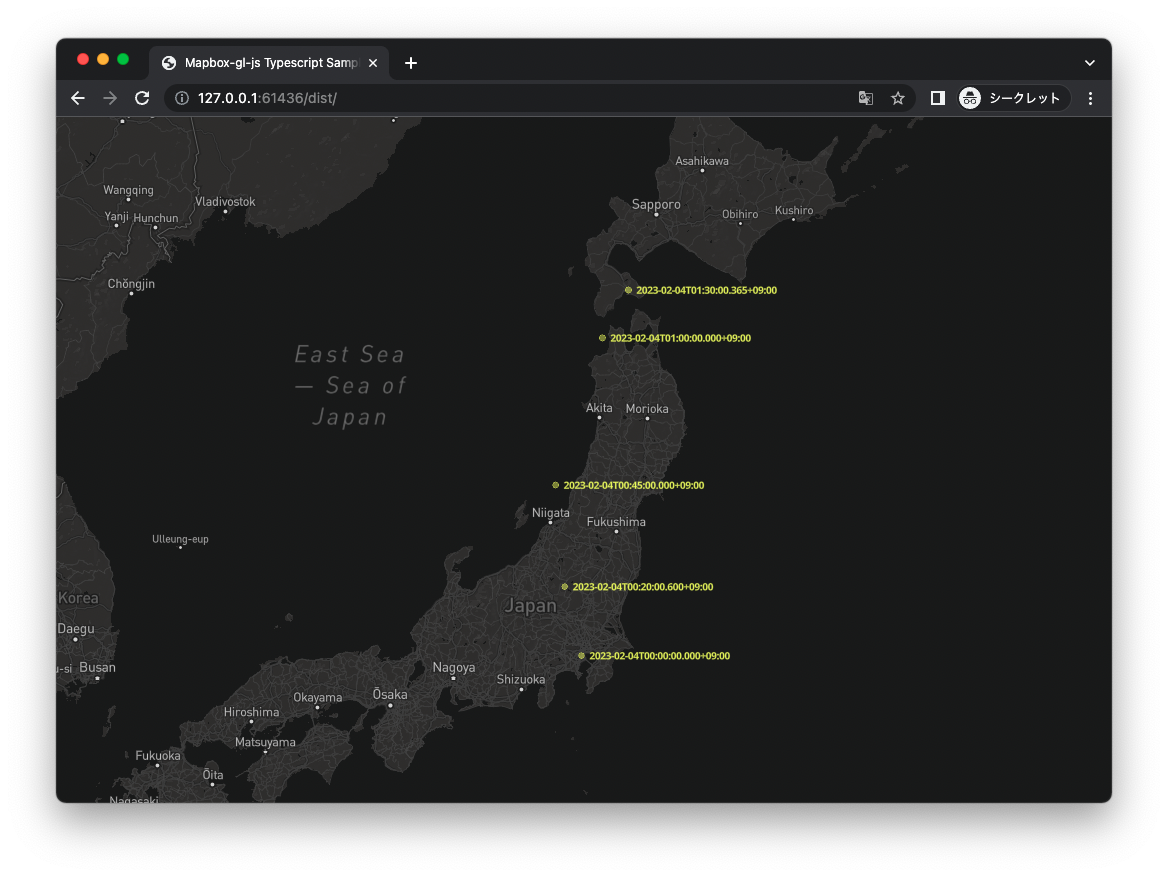
ここでは時系列データの読み込みと、読み込んだデータをもとにした地点の可視化について紹介します。

扱うデータ
筆者が作成した架空の時系列位置データを扱います。
json形式になっており、時刻(date),緯度(lng),経度(lat)の組からなるデータの配列です。
[
    {
        "date": "2023-02-04T00:00:00.000+09:00",
        "lng": 139.71174138471213,
        "lat": 35.5816199191723
    },
    {
        "date": "2023-02-04T00:20:00.600+09:00",
        "lng": 139.34314732166163,
        "lat": 36.80488544980616
    },
    {
        "date": "2023-02-04T00:45:00.000+09:00",
        "lng": 139.1444854253752,
        "lat": 38.571182457409854
    },
    {
        "date": "2023-02-04T01:00:00.000+09:00",
        "lng": 140.1721125374487,
        "lat": 41.05474536985825
    },
    {
        "date": "2023-02-04T01:30:00.365+09:00",
        "lng": 140.743644279715,
        "lat": 41.843442251758944
    }
]
型定義
interface MyData {
    date: number, lng: number, lat: number
}
読み込み
 map.on('load', () => {
    fetch('./trajectory.json')
        .then(res => res.json())
        .then(data => {
         /* ここに処理を書く */
        });
});
ジオコーディングライブラリ turf.js の導入
地理空間の演算を簡潔にコーディングするためにturf.jsを導入します。
turf.jsとは
maobox公式によれば
Turf.jsは、空間解析(英語)に使用されるオープンソースのJavaScriptライブラリです。従来の空間演算、GeoJSONデータ作成用のヘルパー関数、データ分類・統計ツールなどが含まれています。Turfはクライアントサイドのプラグインとしてウェブサイトに追加することも、Node.js(英語).を使ってサーバーサイドで動作(英語)させることも可能です。ソースコードはGitHub(英語)で公開されています。TurfはMapbox GL JSと連動しており、Mapbox Java SDKには、Turf for Javaライブラリ(英語)もあります。
引用元 : https://docs.mapbox.com/jp/help/glossary/turf/
インストールとインポート
- インストール
npm i -S @turf/truf
- インポート
import * as Turf from '@turf/turf';
視覚的要素の描画
mapbox-gl-jsではgeojson形式の記述によってさまざまな視覚的要素を描画することが可能です。
addSourceメソッドによってgeojsonを追加し、addLayerメソッドによってスタイルを適用し地図上に追加します。
- geojsonソースの例
このときtruf.jsのヘルパーを使用すると、座標やプロパティなどの引数からfeaturesを返してくれるため非常に便利である。
map.addSource('mySource', {
    type: 'geojson',
    data: {
        "type": "FeatureCollection",
        "features": [
            {
                'type': 'Feature',
                'properties': {},
                'geometry': {
                    'type': 'Point',
                    'coordinates': [139.71174138471213, 35.5816199191723]
                }
            },
            {
                'type': 'Feature',
                'properties': {},
                'geometry': {
                    'type': 'Point',
                    'coordinates': [139.34314732166163, 36.80488544980616]
                }
            }
        ]
    }
});
- スタイルの適用例
map.addLayer({
    id: 'myId',
    type: "fill",
    source: 'mySource',
    paint: {
        "fill-color": '#f1ff57',
        "fill-opacity": 0.5
    }
});
円の描画
turf.jsのcircle(ヘルパー)を使用したfeaturesの生成
const circleFeatures = data.map((d: MyData) => {
    let raduis: number = 6;
    let options = {
        steps: 64,
        units: 'kilometers'
    };
    let position: number[] = [d.lng, d.lat];
    return Turf.circle(position, radius, options);
});
地図への追加
map.addSource('position', {
    type: 'geojson',
    data: {
        "type": "FeatureCollection",
        "features": circleFeatures
    }
});
map.addLayer({
    id: 'position',
    type: "fill",
    source: 'position',
    paint: {
        "fill-color": '#f1ff57',
        "fill-opacity": 0.5
    }
});
ラベルの描画
turf.jsのpoint(ヘルパー)を使用したfeaturesの生成
データドリブンな視覚的要素の描画のためには、featureでpropertiesを指定し、addLayerメソッドで指定するlayoutから参照する必要があります。
const labelFeatures = data.map((d: MyData) => {
    let position: number[] = [d.lng, d.lat];
    let properties = { 'description': d.date };
    return Turf.point(position, properties);
});
生成したlabelFeaturesは以下の通りである
[
    {
        "type": "Feature",
        "properties": {
            "description": "2023-02-04T00:00:00.000+09:00"
        },
        "geometry": {
            "type": "Point",
            "coordinates": [
                139.71174138471213,
                35.5816199191723
            ]
        }
    },
    {
        "type": "Feature",
        "properties": {
            "description": "2023-02-04T00:20:00.600+09:00"
        },
        "geometry": {
            "type": "Point",
            "coordinates": [
                139.34314732166163,
                36.80488544980616
            ]
        }
    },
    {
        "type": "Feature",
        "properties": {
            "description": "2023-02-04T00:45:00.000+09:00"
        },
        "geometry": {
            "type": "Point",
            "coordinates": [
                139.1444854253752,
                38.571182457409854
            ]
        }
    },
    {
        "type": "Feature",
        "properties": {
            "description": "2023-02-04T01:00:00.000+09:00"
        },
        "geometry": {
            "type": "Point",
            "coordinates": [
                140.1721125374487,
                41.05474536985825
            ]
        }
    },
    {
        "type": "Feature",
        "properties": {
            "description": "2023-02-04T01:30:00.365+09:00"
        },
        "geometry": {
            "type": "Point",
            "coordinates": [
                140.743644279715,
                41.843442251758944
            ]
        }
    }
]
地図への追加
データドリブンな視覚的要素の追加において、featureで指定したプロパティを参照するためには、addLayerメソッド内で指定するlayoutの該当するプロパティ(ここではtext-filed)に ['get', 'プロパティ名']を指定する必要がある。
ここでは'text-field': ['get', 'description']とする。
map.addSource('positionLabel', {
    type: 'geojson',
    data: {
        type: 'FeatureCollection',
        features: labelFeatures
    }
});

map.addLayer({
    id: 'positionLabel',
    type: 'symbol',
    source: 'positionLabel',
    layout: {
        'text-field': ['get', 'description'],
        'text-anchor': 'left',
        'text-font': ['Open Sans Bold'],
        'text-size': 10,
        'text-max-width': 100,
        'text-radial-offset': 0.8,
    },
    paint: {
        'text-color': '#f1ff57'
    }
});
コード
import mapboxgl from 'mapbox-gl';
import * as Turf from '@turf/turf';

mapboxgl.accessToken = /* your token */;

interface MyData {
    date: number, lng: number, lat: number
}

window.addEventListener('load', () => {
    const map: mapboxgl.Map = new mapboxgl.Map({
        container: 'map',
        style: 'mapbox://styles/mapbox/dark-v10',
        center: [139.7670516, 39],
        zoom: 5
    });

    map.on('load', () => {
        fetch('./trajectory.json')
            .then(res => res.json())
            .then(data => {
                const circleFeatures = data.map((d: MyData) => {
                    return Turf.circle([d.lng, d.lat], 6);
                });

                map.addSource('position', {
                    type: 'geojson',
                    data: {
                        "type": "FeatureCollection",
                        "features": circleFeatures
                    }
                });
                map.addLayer({
                    id: 'position',
                    type: "fill",
                    source: 'position',
                    paint: {
                        "fill-color": '#f1ff57',
                        "fill-opacity": 0.5
                    }
                });

                const labelFeatures = data.map((d: MyData) => {
                    return Turf.point([d.lng, d.lat], { 'description': d.date });
                });

                console.log(JSON.stringify(labelFeatures));

                map.addSource('positionLabel', {
                    type: 'geojson',
                    data: {
                        type: 'FeatureCollection',
                        features: labelFeatures
                    }
                });

                map.addLayer({
                    id: 'positionLabel',
                    type: 'symbol',
                    source: 'positionLabel',
                    layout: {
                        'text-field': ['get', 'description'],
                        'text-anchor': 'left',
                        'text-font': ['Open Sans Bold'],
                        'text-size': 10,
                        'text-max-width': 100,
                        'text-radial-offset': 0.8,
                    },
                    paint: {
                        'text-color': '#f1ff57'
                    }
                });
            });
    });
});