シリーズ一覧 (更新:2023/2/9)
① 環境構築 ~ 地図の表示
② 地図のスタイルの変更
③ 円のプロット・ラベルの表示
④ 軌跡の可視化 - 基本編
⑤ 軌跡の可視化 - アニメーション編
⑥ 軌跡の可視化 - Space Time Cube編
概要
前回は時系列位置データの読み込みと、位置の可視化を行いました。しかしそれだけでは時系列位置データの可視化として十分とは言えません。
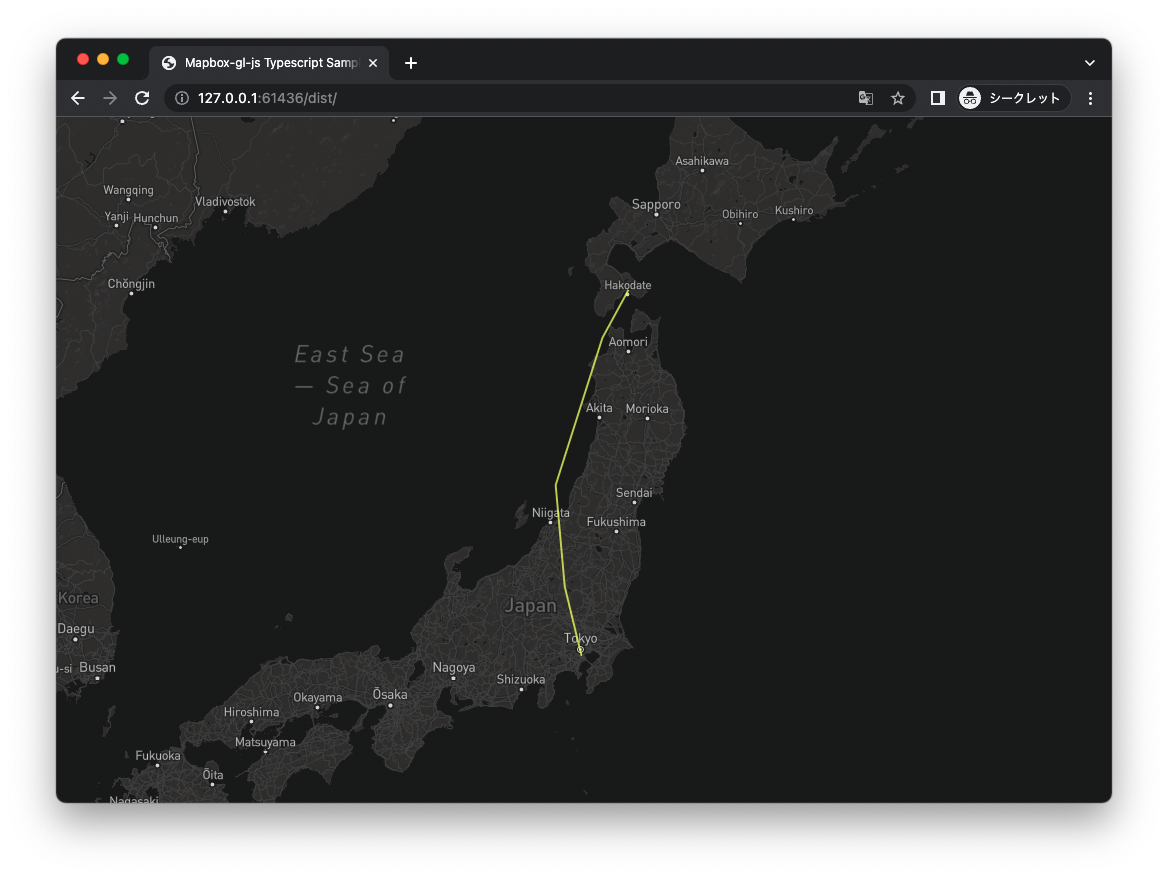
時系列位置データが意味するものは物体の移動です。物体の移動の様子は以下のように点と点を繋いだ軌跡によって表現されます。今回はこの軌跡の描画方法を紹介します。
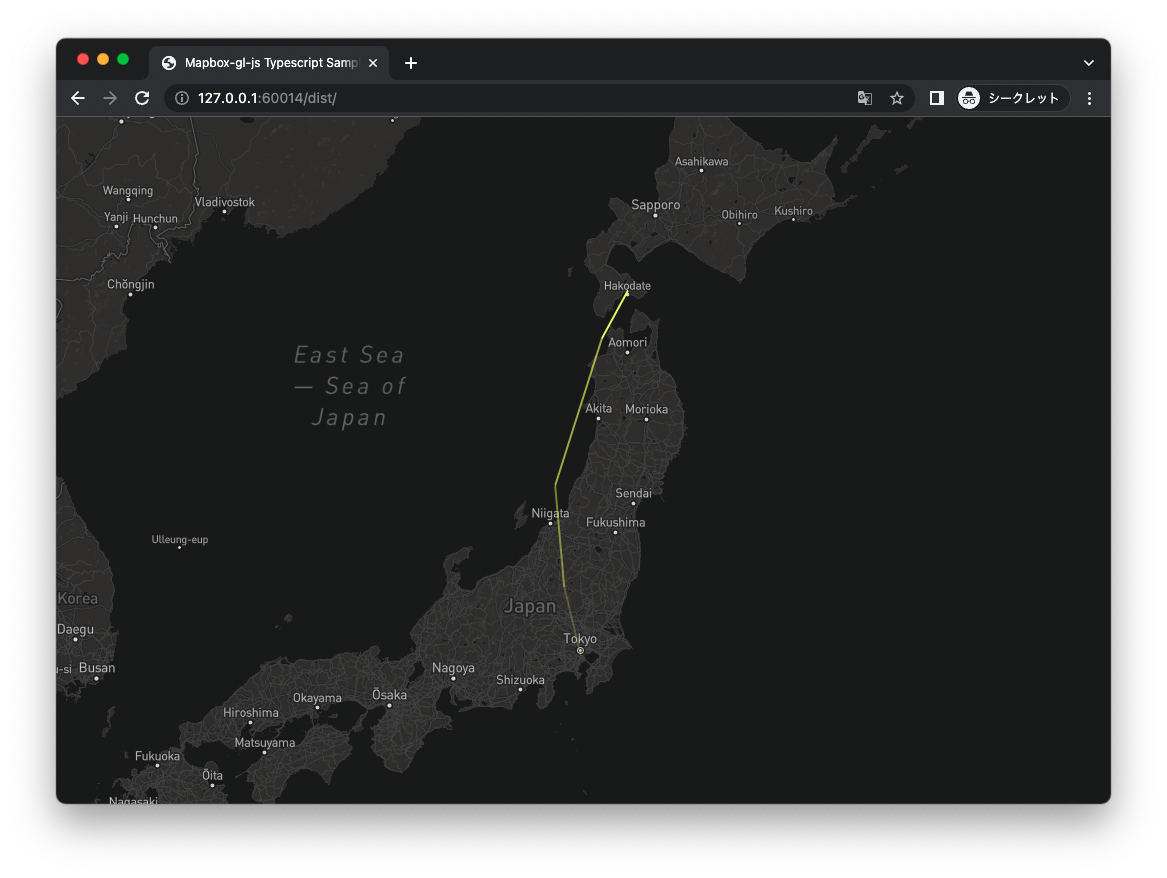
そしてさらに線分の不透明度のグラデーションによって時刻をエンコードする方法を紹介します。
扱うデータ
前回と同じです。
軌跡の可視化
前回同様にturf.jsのヘルパーを用いて線のfeaturesを生成します。
データから位置データのみを抽出したnumber型の二次元配列を作り、turs.jsのlineStringメソッドを用います。
const positions: number[][] = data.map((d: MyData) => [d.lng, d.lat]);
const feature = Turf.lineString(positions);
生成したfeaturesをmapに追加し、スタイルを適用すると軌跡が表示されます。
map.addSource('traj', {
    type: 'geojson',
    data: {
        type: 'FeatureCollection',
        features: [feature]
    }
});

map.addLayer({
    id: 'tarj',
    type: 'line',
    source: 'traj',
    paint: {
        'line-width': 2,
        'line-color': '#f1ff57',
        'line-opacity': 0.8
    }
});
コードの全容
import mapboxgl from 'mapbox-gl';
import * as Turf from '@turf/turf';

mapboxgl.accessToken = /* your token */;

interface MyData {
    date: number, lng: number, lat: number
}
window.addEventListener('load', () => {
    const map: mapboxgl.Map = new mapboxgl.Map({
        container: 'map',
        style: 'mapbox://styles/mapbox/dark-v10',
        center: [139.7670516, 39],
        zoom: 5
    });

    map.on('load', () => {
        fetch('./trajectory.json')
            .then(res => res.json())
            .then(data => {
                const positions: number[][] = data.map((d: MyData) => [d.lng, d.lat]);
                const feature = Turf.lineString(positions);

                map.addSource('traj', {
                    type: 'geojson',
                    data: {
                        type: 'FeatureCollection',
                        features: [feature]
                    }
                });

                map.addLayer({
                    id: 'tarj',
                    type: 'line',
                    source: 'traj',
                    paint: {
                        'line-width': 2,
                        'line-color': '#f1ff57',
                        'line-opacity': 0.8
                    }
                });
            });
    });
});
グラデーションを用いた時刻のエンコード
ここまでで軌跡を表示することはできましたが、時間変化を表現できていません。
軌跡上に時刻を表現する手法はいくつかあります。例えば前回のように点上に時刻のテキストラベルを表示する方法であったり、あるいはアニメーションを用いる方法があります。
ここでは軌跡の不透明度が徐々に変化するグラデーションによって時刻を表現します。軌跡が薄ければ薄いほど古い時刻を表すという表現です。
アプローチ
時刻スケールに応じたグラデーションを生成するためにデータドリブンな手法が必要です。
線のグラデーションの指定はmapbox-gl-jsに専用のプロパティがありますが、現段階ではデータドリブンな設定に対応していません。一方で単色による着色はデータドリブンな指定が可能です。
そこで軌跡を線分ごとに切り分けて着色し地図に追加するというアプローチを取ります。
geojsonソースとスタイルの追加
ここでは線の不透明度をデータドリブンに指定するために'line-opacity': ['get', 'opacity']とします。そしてfeatureを生成する際に{ 'opacity': opacity }を指定します。
map.addSource('traj', {
    type: 'geojson',
    data: {
        type: 'FeatureCollection',
        features: []
    }
});

map.addLayer({
    id: 'tarj',
    type: 'line',
    source: 'traj',
    paint: {
        'line-width': 2,
        'line-color': '#f1ff57',
        'line-opacity': ['get', 'opacity']
    }
});
線分ごとに異なる不透明度プロパティを指定したfeaturesの生成
線分はある時刻の点と次の時刻の点を結ぶことで作られます。
したがってi番目とi+1番目の2つの座標をもとにfeatureを作成します。
// 処理1 : 線分を作る座標の取得
const pos0: number[] = [data[i].lng, data[i].lat];
const pos1: number[] = [data[i + 1].lng, data[i+1].lat];
const positions = [pos0, pos1];
このときの不透明度を時間スケールをもとに指定します。
時刻の最大値と最小値を取得し、この区間に対するi+1番目の時刻の割合を計算します。
i+1番目の時刻の割合は0~1で与えられ、不透明度も同様に0~1で与えるので、この割合をそのまま不透明度とします。
const firstDate = new Date(data[0].date).valueOf();
const lastDate = new Date(data[data.length - 1].date).valueOf();

// 処理2 : 不透明度の指定
const date1 = new Date(data[i + 1].date).valueOf();
const opacity: number = (date1 - firstDate) / (lastDate - firstDate);
線分をつくる2つの座標とその不透明度をもとにfeatureを生成します。
// 処理3 : featureの生成
const feature: Turf.Feature = Turf.lineString(positions, { 'opacity': opacity });
この処理をデータ全体に対して行います。
let features: Turf.Feature[] = [];

const firstDate = new Date(data[0].date).valueOf();
const lastDate = new Date(data[data.length - 1].date).valueOf();

for (let i = 0; i < data.length - 1; i++) {
    // 処理1 : 線分を作る座標の取得
    // 処理2 : 不透明度の指定
    // 処理3 : featureの生成
    features.push(feature);
}
データドリブンに生成したfeaturesを地図に追加する
まず、featuresをもとにfeature collectionを生成します。
(型解決の方法がわからなかったため止むを得ずanyとしてしまいましたが、これはあまりよくありません。ご存知の方がいればコメントをお願いします。)
const featureCollection: any = Turf.featureCollection(features);
そして、geojsonソースを取得し、feature collectionをセットします。
const trajSource: mapboxgl.GeoJSONSource = <mapboxgl.GeoJSONSource>map.getSource('traj');
trajSource.setData(featureCollection);
コードの全容
import mapboxgl from 'mapbox-gl';
import * as Turf from '@turf/turf';

mapboxgl.accessToken = /* your token */;

interface MyData {
    date: number, lng: number, lat: number
}

window.addEventListener('load', () => {
    const map: mapboxgl.Map = new mapboxgl.Map({
        container: 'map',
        style: 'mapbox://styles/mapbox/dark-v10',
        center: [139.7670516, 39],
        zoom: 5
    });

    map.on('load', () => {
        map.addSource('traj', {
            type: 'geojson',
            data: {
                type: 'FeatureCollection',
                features: []
            }
        });

        map.addLayer({
            id: 'tarj',
            type: 'line',
            source: 'traj',
            paint: {
                'line-width': 2,
                'line-color': '#f1ff57',
                'line-opacity': ['get', 'opacity']
            }
        });

        fetch('./trajectory.json')
            .then(res => res.json())
            .then(data => {
                let features: Turf.Feature[] = [];
                const firstDate = new Date(data[0].date).valueOf();
                const lastDate = new Date(data[data.length - 1].date).valueOf();

                for (let i = 0; i < data.length - 1; i++) {
                    const pos0: number[] = [data[i].lng, data[i].lat];
                    const pos1: number[] = [data[i + 1].lng, data[i+1].lat];
                    const positions = [pos0, pos1];

                    const date1 = new Date(data[i + 1].date).valueOf();
                    const opacity: number = (date1 - firstDate) / (lastDate - firstDate);
                    const feature: Turf.Feature = Turf.lineString(positions, { 'opacity': opacity });
                    features.push(feature);
                }

                const featureCollection: any = Turf.featureCollection(features);

                const trajSource: mapboxgl.GeoJSONSource = <mapboxgl.GeoJSONSource>map.getSource('traj');
                trajSource.setData(featureCollection);
            });
    });
});

